Exxon: 4.7 Million Barrels a Day — and a Price Nobody Sets
ExxonMobil produced more oil and gas in 2025 than in any year for more than four decades — and still earned only half of what it made in 2022. The company writes the reason into its own annual report: one dollar on the Brent price moves about $700 million of earnings. We read the filings from 2020 onward, not from the record year.
 Thomas Mücke
Founder & Publisher
Thomas Mücke
Founder & Publisher
Chart
Interactive price chart (TradingView).
Note: pure fact-based analysis, not investment advice and not a solicitation to buy or sell. All figures without guarantee.
The giant illusion
There is a mental trap that reliably catches us with very large companies: we assume the biggest thing is automatically the most predictable one. A company that has existed since 1882, produces 4.7 million oil-equivalent barrels every day and employs people of more than 160 nationalities surely holds no surprises. That kind of business simply runs. You can plan around it.
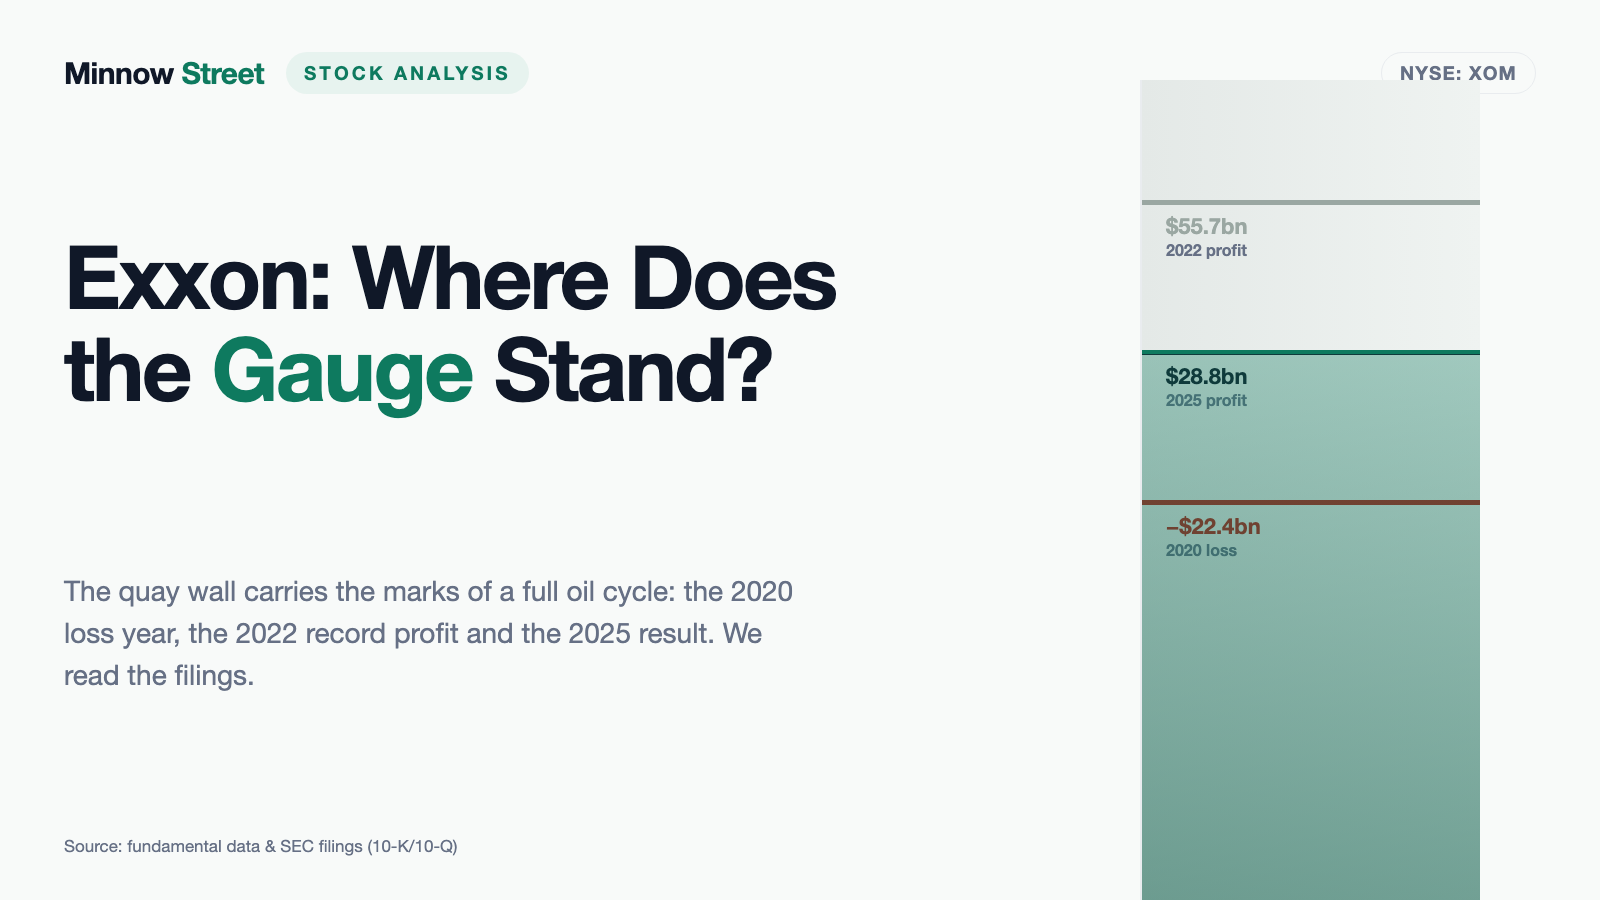
Then you open the filings. In 2020 ExxonMobil reported a loss of $22,440 million. Two years later, in 2022, a profit of $55,740 million. The same wells, the same refineries, largely the same management. Almost all of the roughly $78 billion difference between those two years originated outside the company.
That is the thread running through this analysis and the tension that shapes every chapter: ExxonMobil controls nearly everything except the one number its earnings depend on. And the company writes that dependency into its own annual report, so plainly that it is easy to miss.
The deal for this article: we read the numbers across a full upswing and downswing, not starting from the record year. No oil price forecast — we do not make one, and we do not borrow one either. Only what stands in the original documents.
What ExxonMobil actually does
ExxonMobil earns its money in four steps, and it helps to picture them as a chain: pull something out of the ground, turn it into fuel, turn part of that into plastics feedstock, and sell specialty products such as lubricants at the end. The company reports in exactly that order across four segments. Here is how earnings split in 2025 (in millions of dollars):
- Upstream, 21,354: exploring for and producing oil and natural gas. By far the largest segment, contributing about two thirds of segment earnings. Focus areas: the Permian Basin in Texas and New Mexico, Guyana, Qatar, Canada, the Emirates.
- Energy Products, 7,423: fuels, aromatics, catalysts and licensing — the classic refining business plus trading.
- Chemical Products, 800: olefins, polyolefins, intermediates. The weakest segment in 2025, down from 2,577 the year before.
- Specialty Products, 2,857: finished lubricants, basestocks, waxes, elastomers. The steadiest, highest-margin business.
From segment earnings of 32,434, corporate and financing costs took 3,590. What remained was the $28,844 million of net income attributable to ExxonMobil.
Why integration is more than a slogan
The decisive point about this chain is that its links pull against each other. When the oil price rises, Upstream earns more — but refining and chemicals pay more for their feedstock and earn less. ExxonMobil describes that double edge explicitly in its annual report. A pure producer such as APA Corporation has no such counterweight; a pure refiner such as HF Sinclair has none either, just in the opposite direction. Integration dampens the swing — it does not remove it, as the 2020 loss year shows.
The scale
In 2025 ExxonMobil produced 4.7 million oil-equivalent barrels per day, 403 thousand barrels more than in 2024 and, by the company's own account, the highest level in more than 40 years. The Permian Basin reached 1.6 million net oil-equivalent barrels per day, Guyana averaged 715 thousand gross barrels per day for the year — a record, carried by four floating production, storage and offloading vessels that together delivered more than 870 thousand barrels per day in the fourth quarter of 2025. Headcount at year end was 57,900, down from 60,900 (2024) and 61,500 (2023). More than 59 percent of employees work outside the United States.
Since July 1, 2026 Exxon has been a Texas corporation
This is not a footnote but a change of identity — and anyone searching the filings will trip over it. Until June 30, 2026 the listed company was Exxon Mobil Corporation, incorporated in the state of New Jersey in 1882. Since July 1, 2026 it has been ExxonMobil Holdings Corporation under Texas law.

"At the Effective Time, each share of common stock, without par value, of ExxonMobil … was automatically exchanged for one share of common stock, par value $0.001 per share, of ExxonMobil Holdings Corporation … ExxonMobil Holdings Corporation replaced ExxonMobil as the publicly held corporation traded on the New York Stock Exchange."
— ExxonMobil Holdings Corporation, Form 8-K12B of July 1, 2026, Item 2.01
For you as a shareholder nothing changes arithmetically: a one-for-one exchange, the same number of shares, the same stake, the same XOM ticker on the NYSE. All twelve directors and every officer carried over unchanged. Two things still matter. First, the old reports sit with the U.S. securities regulator, the SEC, under filer number 0000034088, the new ones under 0002115436. Second, a Form 25-NSE was filed on July 2, 2026 — the removal of the old common stock from NYSE listing. In a filing list that looks like a delisting, but it is simply the second half of the exchange. What did shift legally is covered in truth no. 6.
How the stock reached our desk
Honestly: not through a signal. Our in-house stock scanner sorts by metrics — valuation, balance sheet quality, momentum. For a cyclical business in the middle of its cycle those filters almost never point the same way, and the very largest names fall through them anyway.
This analysis comes from a survey dated July 28, 2026: we listed the 100 largest U.S. stocks by market capitalization and checked which of them already had an analysis. ExxonMobil ranked 16th — and had none. That is the entire origin story. Not a buy signal, but the closing of a gap.
It is also the more honest sequence: read first, judge afterwards. Not find a signal first and then look for the reasoning to match.
The numbers across the years — fairly credited
Let us start with what genuinely impresses. And there is plenty.
ExxonMobil raised production by roughly one million barrels per day in two years — from 3.7 million (2023) through 4.3 million (2024) to 4.7 million (2025). That is no small matter: one million barrels a day is roughly the daily output of a mid-sized OPEC member. The growth came from the Permian Basin and from Guyana, where the fourth floating production vessel, the ONE GUYANA, entered service in August 2025. In the first quarter of 2026 Guyana set a new quarterly record above 900 thousand gross barrels per day. At the end of March 2026 the first train of the Golden Pass liquefied natural gas plant, in which ExxonMobil holds 30 percent, produced LNG for the first time.
The balance sheet is equally solid. As of March 31, 2026, total assets of $464,410 million stood against $203,414 million of liabilities and $254,381 million of ExxonMobil shareholders' equity. Interest expense for 2025 was $603 million against pre-tax income of $41,268 million. This company does not have a debt problem.
And yet: earnings do not follow production
Now the part you have to see in a cyclical business. While production rose by about a quarter between 2023 and 2025, earnings fell by a fifth over the same three years.
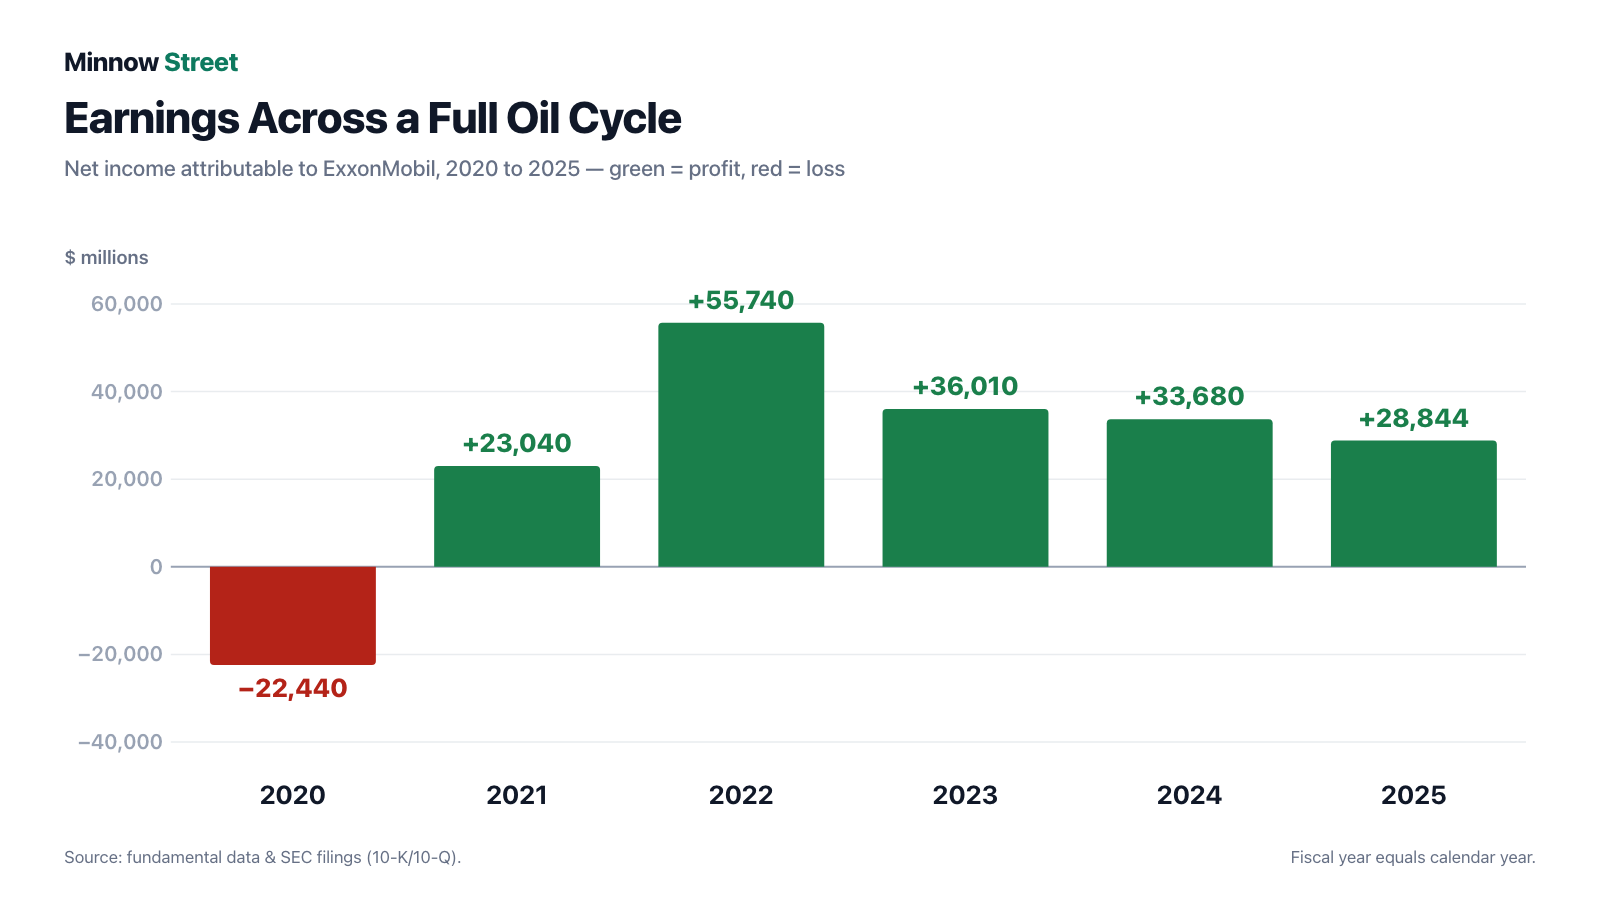
The series in numbers, net income and return on average equity:
- 2020: −$22,440 million, return −12.9 percent
- 2021: +$23,040 million, return 14.1 percent
- 2022: +$55,740 million, return 30.7 percent
- 2023: +$36,010 million, return 18.0 percent
- 2024: +$33,680 million, return 14.4 percent
- 2025: +$28,844 million, return 11.0 percent
Rule of thumb: in a cyclical business the average is the truth and any single year is a snapshot. Across the six years from 2020 to 2025 ExxonMobil earned an average of $25,812 million per year — well below 2022 and slightly below 2025.
The cash flow
Margin is bookkeeping, cash flow is truth — and this cash flow is remarkable. Operating activities provided ExxonMobil with $51,970 million in 2025 (2024: 55,022; 2023: 55,369). Even in the weak year 2020 the figure was still $14,668 million, positive, while the income statement showed a $22.4 billion loss. The reason is depreciation. In 2025 it amounted to $25,993 million including impairments — book value consumed, not cash paid out.
The first quarter of 2026 shows the range in miniature: $85,138 million of total revenue, $4,183 million of earnings, $1.00 per share — against $7,713 million and $1.76 in the prior-year quarter. The company attributes most of the decline to mark-to-market effects on open derivative positions that unwind in subsequent periods, and to supply disruptions in the Middle East.
Uncomfortable truth no. 1: one dollar is $700 million
If you take a single number away from this analysis, take this one. It sits in the 2025 annual report, in the section on market risks, and it is as precise as a dependency can be stated.
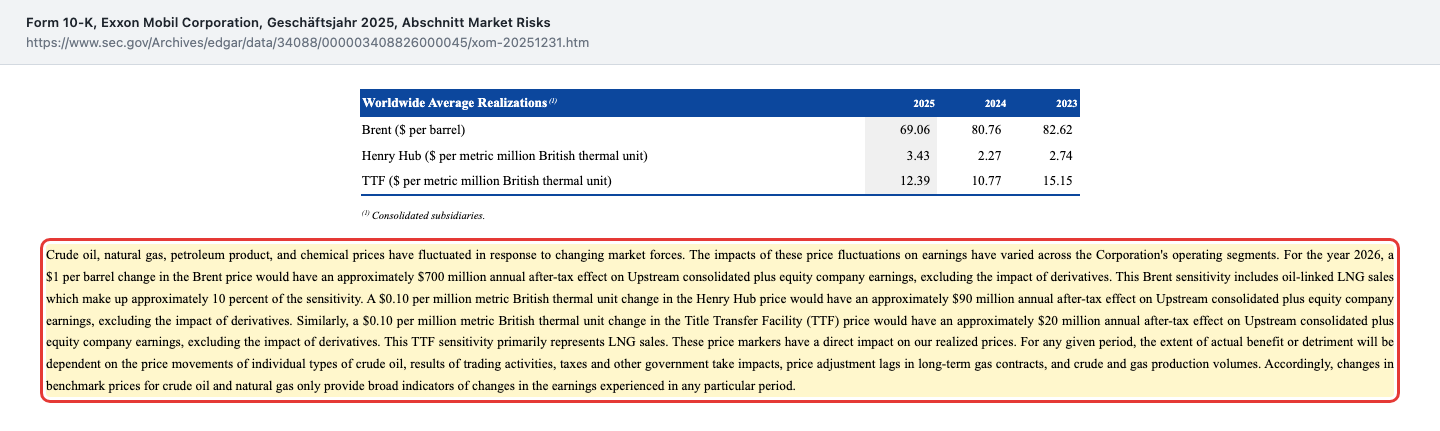
"For the year 2026, a $1 per barrel change in the Brent price would have an approximately $700 million annual after-tax effect on Upstream consolidated plus equity company earnings, excluding the impact of derivatives."
— Exxon Mobil Corporation, Form 10-K for 2025, "Market Risks"
Work that through. ExxonMobil's realized average prices, from the same table, were $69.06 per barrel of Brent (2025), $80.76 (2024) and $82.62 (2023). Between 2024 and 2025 the price fell by $11.70. Applying the company's own rule of thumb, that is roughly $8.2 billion less after-tax Upstream earnings — against an actual group-level decline of $4.8 billion. Production growth, cost savings and the downstream businesses absorbed the other half. That is precisely the point of integration, and precisely its limit.
For natural gas the report states the same arithmetic: a $0.10 change in the U.S. Henry Hub marker means roughly $90 million a year, and at the European TTF marker roughly $20 million. Anyone wanting to see how violently those markers swing will find it in an even more direct form at a pure gas producer such as Range Resources.
What the company itself estimates for the current quarter
On July 7, 2026, ExxonMobil published a list of factors expected to move second-quarter 2026 results relative to the first quarter. This is expressly not an earnings forecast but a collection of individual effects, and we report it only as that: higher liquids prices are estimated to add $3.5 to $3.9 billion, better fuel margins $2.0 to $2.4 billion, chemical margins $1.0 to $1.2 billion. Against that stand volume disruptions from Middle East events of $0.6 to $0.8 billion in Upstream and impairments of $0.8 to $1.0 billion in Energy Products. For context: the first quarter of 2026 reported $4.2 billion under U.S. accounting rules and $8.8 billion on the company's adjusted basis.
Remember the order of magnitude, not the individual figure: in a single quarter, prices and margins move more at this company than most listed businesses earn in a year.
Uncomfortable truth no. 2: more goes out than is left over
ExxonMobil is widely seen as a model of capital discipline, and in most respects it is. On one line item, that picture has not held for three years.
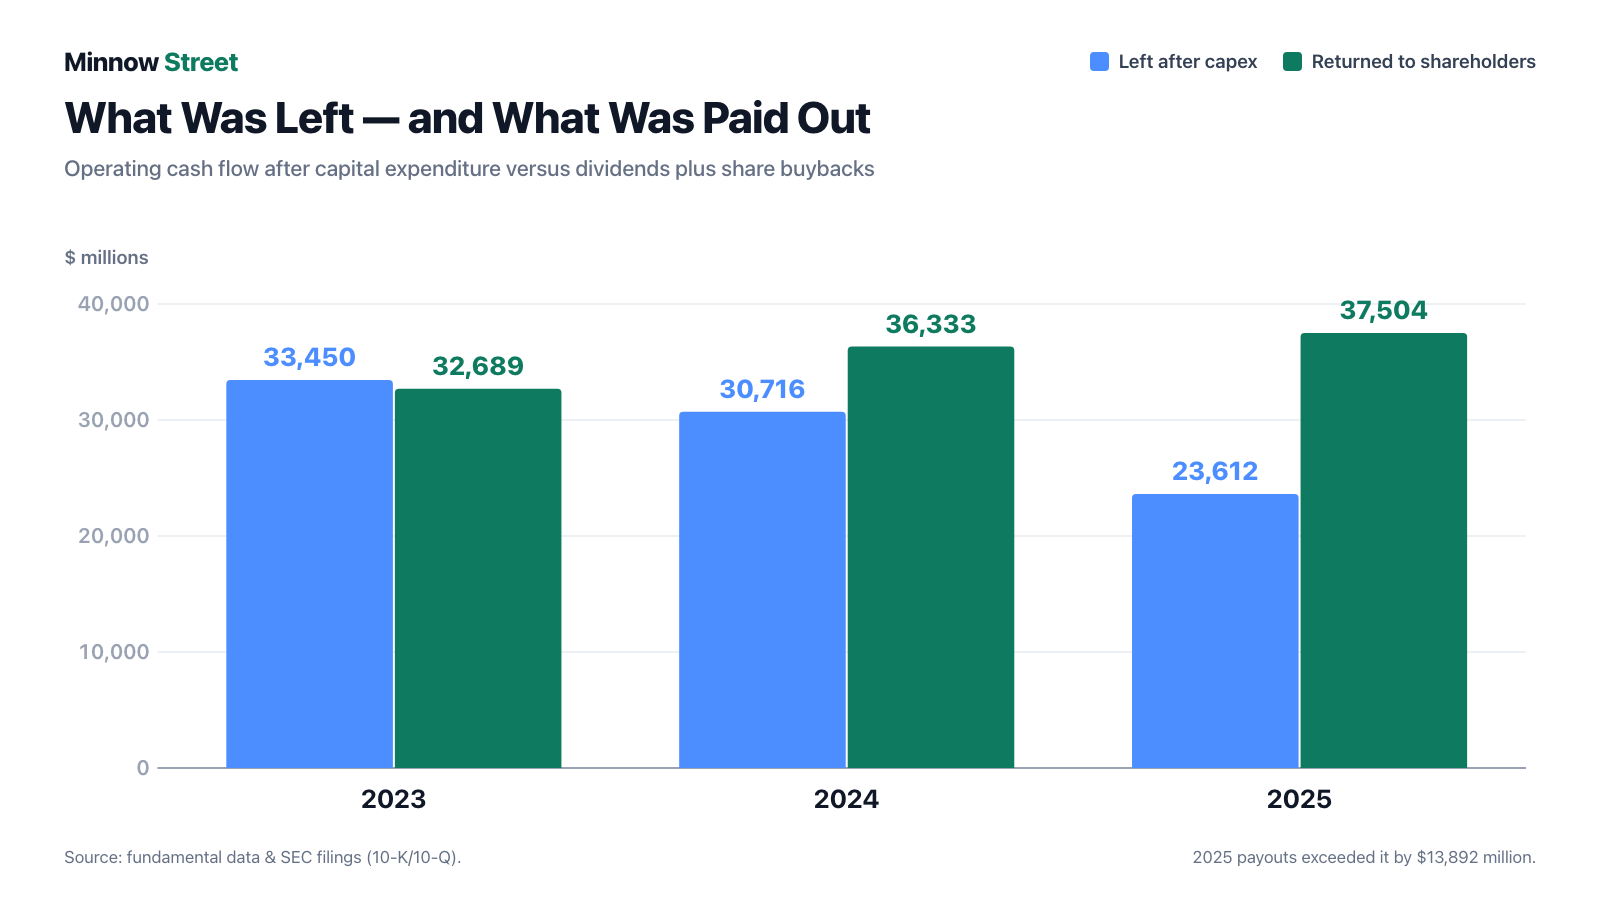
The arithmetic year by year, in millions of dollars:
- 2023: 55,369 provided, 21,919 invested — 33,450 left. Distributed 32,689 (14,941 dividends, 17,748 buybacks). Covered, narrowly.
- 2024: 55,022 provided, 24,306 invested — 30,716 left. Distributed 36,333 (16,704 + 19,629). Shortfall 5,617.
- 2025: 51,970 provided, 28,358 invested — 23,612 left. Distributed 37,504 (17,231 + 20,273). Shortfall 13,892.
Both blades of the scissors are moving: cash flow falls because the price falls; capital spending rises because Guyana, the Permian Basin and Golden Pass have to be built; distributions rise because the company said they would. The gap is paid out of the balance sheet. Cash fell from $23,187 million at the end of 2024 to $10,681 million at the end of 2025. Net debt to capital — net debt divided by net debt plus total equity — rose from 4.5 percent (2023) through 6.5 percent (2024) to 11.0 percent (2025).
The first quarter of 2026 continued the pattern: $8,705 million provided, $6,470 million invested, $9,202 million distributed ($4,334 million of dividends, $4,868 million of buybacks). The gap was closed with $9,075 million of newly issued commercial paper; cash fell further to $8,435 million and shareholders' equity from $259,386 million to $254,381 million.
And now the context that belongs with it: this is not a solvency problem. With more than $250 billion of equity and $603 million of annual interest expense, net debt to capital of 11 percent is comfortably carried. It is a decision: ExxonMobil holds the distribution through the price trough and funds the difference from the balance sheet. That is exactly what the balance sheet was repaired for in the good years. The open question is only how long that can continue if the price does not return. For 2026 the company again announced $20 billion of share repurchases in its corporate plan update of December 9, 2025 — explicitly subject to "reasonable market conditions".
Anyone who wants to see how another heavyweight resolves the same trade-off between payout and balance sheet will find it in our analysis of JPMorgan Chase — there a regulator has a say, here only the board.
Uncomfortable truth no. 3: $57 billion of buybacks, more shares than before
A share buyback means the company purchases its own stock and retires it, so your slice of the pie grows. Between 2023 and 2025 ExxonMobil spent $57,650 million doing exactly that. You would expect substantially fewer shares to exist afterwards.
The opposite is true. The weighted average share count was 4,052 million in 2023, 4,298 million in 2024 and 4,305 million in 2025. After $57.7 billion of buybacks there are 6.2 percent more shares than two years earlier. The reason sits in a footnote to the cash flow statement.

"The Corporation acquired Pioneer Natural Resources Company in an all-stock transaction on May 3, 2024, having issued 545 million shares of ExxonMobil common stock having a fair value of $63 billion and assumed debt with a fair value of $5 billion."
— Exxon Mobil Corporation, Form 10-K for 2025, cash flow statement and Note 20
Dilution means your slice of the pie gets smaller because more slices are cut. That is exactly what happened, and it was a deliberate choice — ExxonMobil paid for the largest acquisition of its recent history not with cash but with its own equity. In return, according to Note 20, it received property, plant and equipment with a fair value of $84 billion, mostly oil and gas properties in the Permian Basin. Goodwill — the premium above the fair value of the individual assets — was only $1 billion. That is remarkably little and suggests substance was bought here rather than expectation.
The honest balance of this arithmetic: the buybacks have almost caught up with the dilution from Pioneer. As of March 31, 2026, 4,145 million shares were outstanding, down from 4,179 million at the end of 2025. But anyone treating the buyback as a pure source of return has, at this company, spent two years merely undoing the effect of an acquisition.
Uncomfortable truth no. 4: Exxon pays its taxes elsewhere
At an oil and gas company the tax rate is not a side issue but part of the business model. Whoever produces in a resource-holding country normally pays far more than 21 percent — that is the price of access to the deposit. ExxonMobil discloses in Note 15 of its annual report where the taxes actually went.
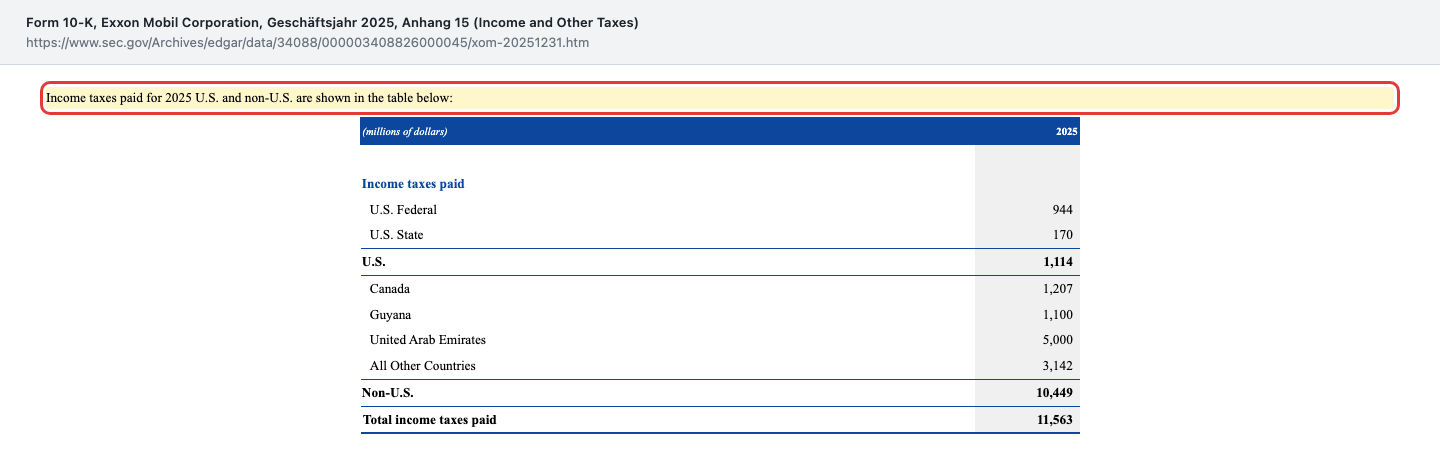
Of $11,563 million of income taxes paid in cash in 2025:
- $5,000 million went to the United Arab Emirates
- $1,207 million to Canada
- $1,100 million to Guyana
- $1,114 million to the United States ($944 million federal, $170 million state)
- $3,142 million to all other countries
In 2025 ExxonMobil therefore paid roughly four and a half times as much income tax in the Emirates as in its entire home country — against pre-tax income already weighted abroad, at $11,000 million in the United States and $30,268 million outside it. The tax rate reconciliation shows the effect on its own line: the Emirates rate differential raised the group effective tax rate in 2025 by $3,405 million, or 8 percentage points. The reported rate was 28 percent under U.S. accounting rules and 31 percent including the taxes of equity companies.
This is not an accusation — it is the mechanics of the business. But it means two things. First, part of the cost base is political rather than operational. Second, a tax cut in the United States helps this company far less than the headline would suggest.
Uncomfortable truth no. 5: the reserves last about ten years
An oil company sells its own fixed assets. Every barrel produced is one barrel less in the ground. The most important volume figure is therefore not production but the stock: proved reserves.
As of December 31, 2025, ExxonMobil reported 19,311 million oil-equivalent barrels of proved reserves, consolidated subsidiaries and equity companies combined. Against annual production of 1.8 billion barrels — the figure the report uses in its reserves reconciliation — that stock lasts roughly ten years. That is our own calculation from two figures in the same report, not a company statement.
More interesting is how the stock changed in 2025:
- Production: −1.8 billion barrels
- Asset sales: −0.1 billion
- Downward revisions, mainly in the United States: −0.9 billion
- Extensions and discoveries, chiefly the United States and Guyana: +2.1 billion
- U.S. acquisitions: +0.1 billion
Net, 1.3 billion barrels were added against 1.8 billion produced — a replacement ratio of roughly 72 percent. Without the downward revisions it would have been 122 percent. Both are our own calculations from the report's figures.
A second point belongs here: 7.0 billion barrels, or 36 percent of reserves, are undeveloped. They sit on the books only because management has committed funding to their development — nothing is being produced from them yet. For some fields in Australia and the Emirates this state has persisted for more than five years.
Why one valuation metric does not work here
The SEC additionally requires the so-called standardized measure: future net cash flows from proved reserves, discounted at 10 percent. It stood at $154,266 million as of December 31, 2025 — after $185,664 million a year earlier and $149,129 million at the end of 2023. The $31.4 billion drop from 2024 to 2025 has nothing to do with the deposits; it arises almost entirely because the rule prescribes the average price of the year in question. ExxonMobil says plainly what it thinks of the number:
"The Corporation believes the standardized measure does not provide a reliable estimate of the Corporation's expected future cash flows to be obtained from the development and production of its oil and gas properties or of the value of its proved oil and gas reserves."
— Exxon Mobil Corporation, Form 10-K for 2025, supplemental information on oil and gas activities
That is an important sentence — and it applies in spirit to almost every metric at a cyclical business. We therefore cite the figure as an order of magnitude and a trend, not as a measure of value.
And what has to be dismantled at the end
Whoever produces must eventually dismantle. For these obligations $12,518 million sat on the balance sheet as of December 31, 2025, up from $12,032 million a year earlier. For 2026 and 2027 the company expects payments of $1.3 billion and $1.5 billion. The notable addition concerns the manufacturing sites: because these locations are planned to operate indefinitely, the company states that the timing of their shutdown cannot be estimated — and therefore the fair value of the obligation cannot be measured. Those obligations are consequently not included in the $12.5 billion at all.
Uncomfortable truth no. 6: the move to Texas
Back to the redomiciliation from chapter two — because it was not uncontested. At the annual meeting on May 27, 2026, 2,216,403,048 shares (71.2 percent) voted in favour and 896,852,562 shares (28.8 percent) against. For comparison: ratification of the auditors received 96.4 percent, the say-on-pay vote 92.9 percent. Almost 900 million shares against a board proposal is unusually many at ExxonMobil.
What changes legally? In its proxy statement the company gives protection against "frivolous, wasteful litigation" as the main reason. Concretely: Texas requires a formal written demand before a shareholder may bring a derivative proceeding on the corporation's behalf. To inspect books and records a shareholder must hold at least 5 percent or have been a record holder for six months — and a publicly traded Texas corporation may deny inspection demands from shareholders with whom it is, or expects to be, in litigation. In addition, a proceeding that results only in additional disclosure no longer justifies plaintiff attorney's fees in Texas.
In fairness: the board did not take up several further options available under Texas law. It introduced neither an ownership threshold for derivative proceedings nor higher hurdles for shareholder proposals; there, Exchange Act Rule 14a-8 continues to apply. That is stated in the proxy statement of April 8, 2026.
Our point is not that this is good or bad. Our point is that when a corporation changes its legal framework, the tools shareholders have for asking questions change with it. That belongs in an analysis — especially when nothing changes economically.
What the stock costs
And now the part where a cyclical business most easily leads you astray. As of July 29, 2026, market capitalization was roughly $634 billion and enterprise value including debt roughly $681 billion. From that follow, each rounded:
- Price-earnings ratio of about 26 on the trailing twelve months, about 14 on next year's expectation
- Price-sales ratio of about 2.0
- Price-book ratio of about 2.5
- Dividend yield of about 2.6 percent
A price-earnings ratio of 26 looks high for an oil company. That is exactly where the trap lies, and it works the same way at every cyclical business: the price-earnings ratio is high at the earnings trough and low at the earnings peak. Measured against the 2022 record profit, the same company would trade at roughly 11 times earnings. Measured against the 2020 loss year there would be no ratio at all. Neither number says anything about the worth of the business, only about where in the cycle you happen to be standing.
The average is more robust: across the six years from 2020 to 2025 ExxonMobil earned an average of $25,812 million per year. On that basis the market was paying roughly 25 times an average cycle profit as of July 29, 2026. That is the more honest order of magnitude — and it already contains the loss year.
Book value of about $62 per share (end of 2025) is only partly meaningful at an oil and gas company: it reflects the historical cost of properties accounted for under the successful efforts method. Unsuccessful wells are written off immediately, successful ones are depreciated over production — which after many good years leaves a balance sheet value that is neither a market price nor a replacement cost. Impairments then arrive in waves: $3.4 billion after tax in 2023, nothing material in 2024, and $2.0 billion again in 2025.
Opportunities and risks at a glance
Opportunities
- Growth from a few very low-cost sources. According to the 2025 annual report about two thirds of production comes from the Permian Basin, Guyana and the LNG business, and that share is expected to grow. Uaru, Whiptail and the Hammerhead project sanctioned in September 2025 each add capacity of roughly 250 thousand barrels per day.
- Balance sheet strength as a buffer. Net debt to capital of 11.0 percent and annual interest expense of $603 million give the company room to sit out a price weakness without abandoning projects.
- Dependable distributions. For January 2026 the board declared a quarterly dividend of $1.03 per share; for 2026 another $20 billion of buybacks has been announced.
- Cost reduction is documented. The company reports structural cost savings against a 2019 baseline and quantifies them in every quarterly report — a rare case of a measurable self-commitment.
Risks
- Price dependency, quantified by the company itself. One dollar of Brent equals roughly $700 million of annual after-tax earnings. Nobody inside the company sets that number.
- Distributions above free cash flow. The 2025 gap was $13,892 million and in the first quarter of 2026 just under $7 billion. It is funded from cash and short-term debt.
- Political concentration. In Kazakhstan ExxonMobil earned roughly $1.1 billion after tax in 2025 on about 320 thousand barrels per day of share production; the export route runs through a pipeline crossing Russia to the Black Sea. The company names a possible interruption explicitly as a risk.
- Climate litigation. States, municipalities and other plaintiffs in the United States are seeking compensation for damages they attribute to climate change; Louisiana parishes additionally sue for coastal marsh restoration. ExxonMobil considers the claims meritless and a material outcome remote, and therefore books no provision.
- Retirement obligations and reserve quality. $12,518 million of asset retirement obligations as of December 31, 2025, expressly not measurable for manufacturing sites; 36 percent of reserves undeveloped; 0.9 billion barrels of downward revisions in 2025.
A human conclusion
Back to the giant illusion from the opening. It does not consist in ExxonMobil being a poor company — quite the contrary: this is a business that still pulls $52 billion out of operations in a weak year, that raised production by a million barrels a day in two years, and whose largest acquisition generated goodwill of just one billion dollars. That is craftsmanship at a high level.
The illusion consists in deriving predictability from that size. It is not there. The company itself writes down that a single dollar in the oil market moves $700 million — and that the valuation metric the regulator prescribes for its reserves does not, in its own view, say anything about the worth of those reserves. A company can hardly state it more honestly: we deliver the performance, the world delivers the price.
The question you have to ask yourself is therefore not "is ExxonMobil a good company?" — the numbers answer that, and the answer is yes. The question is: are you willing to own an earnings stream that can swing between minus 22 and plus 56 billion dollars without anyone inside the company being able to do much about it? Whoever can live with that and thinks across a cycle holds an unusually robust business here. Whoever cannot sit out the next price slump is buying not the production volume but a bet on a commodity price.
What you make of it is your decision. And that is exactly as it should be.
Sources
- Form 10-Q for the quarter ended March 31, 2026, Exxon Mobil Corporation, filed May 4, 2026 (SEC EDGAR, CIK 0000034088)
- Form 10-K for 2025, filed February 18, 2026 — segments, market risks, Notes 7, 9, 15 and 20, and the supplemental information on oil and gas activities
- Form 10-K for 2022, filed February 22, 2023 — source for the 2020 to 2022 cycle years
- First quarter 2026 earnings release, Form 8-K of May 1, 2026, Item 2.02, Exhibit 99.1
- "2Q 2026 Earnings Considerations", Form 8-K of July 7, 2026, Item 7.01, Exhibit 99.1 (ExxonMobil Holdings Corporation, CIK 0002115436)
- Form 8-K12B on the redomiciliation, filed July 1, 2026
- Annual meeting results, Form 8-K, Item 5.07, filed May 29, 2026
- DEF 14A proxy statement for the 2026 annual meeting, filed April 8, 2026 — comparison of New Jersey and Texas shareholder rights
- Fundamental data (valuation metrics, market capitalization; data as of July 29, 2026)
A note on how to read this. This article is journalistic analysis of publicly available corporate filings. It is not investment advice, not a recommendation and not a solicitation to buy or sell securities. All figures come from the sources listed above and carry the reporting date stated there; they may have changed since. Shares are subject to price fluctuations up to and including the total loss of the capital invested. The author holds no position in ExxonMobil at the time of publication.
Our Bottom Line at a Glance
- Operating performance positive
- Production rose from 3.7 (2023) through 4.3 (2024) to 4.7 million oil-equivalent barrels per day (2025) — by the company's own account the highest level in more than 40 years. The Permian Basin reached 1.6 million net barrels, Guyana 715 thousand gross barrels per day on average and more than 900 thousand in the first quarter of 2026.
- Balance sheet positive
- As of March 31, 2026, shareholders' equity of $254,381 million stood against total debt of $43,537 million (December 31, 2025). Interest expense in 2025 was just $603 million against pre-tax income of $41,268 million. No solvency risk is apparent.
- Earnings volatility negative
- Net income ran from −$22,440 million (2020) through +$55,740 million (2022) to +$28,844 million (2025), and return on average equity from −12.9 through 30.7 to 11.0 percent. The company quantifies the cause itself: $1 of Brent equals roughly $700 million of annual after-tax earnings (10-K 2025, Market Risks).
- Distribution coverage negative
- After capital expenditure, $23,612 million was left in 2025; $37,504 million was distributed. The $13,892 million gap was covered from cash ($23,187m to $10,681m) and debt. Net debt to capital rose from 4.5 percent (2023) through 6.5 percent (2024) to 11.0 percent (2025).
- Reserves and retirement obligations neutral
- Proved reserves of 19,311 million oil-equivalent barrels (December 31, 2025), roughly ten years of production, 36 percent of them undeveloped. In 2025, additions of 2.2 billion barrels met downward revisions of 0.9 billion. Asset retirement obligations were $12,518 million, expressly not measurable for manufacturing sites.
- Capital allocation and governance neutral
- The Pioneer acquisition of May 3, 2024 cost 545 million of the company's own shares (fair value $63 billion) with goodwill of only $1 billion — expensive, but backed by substance. The redomiciliation to Texas effective July 1, 2026 passed with 71.2 percent in favour; 28.8 percent of votes cast were against (Form 8-K of May 29, 2026).
ExxonMobil produced more in 2025 than in any year for over four decades and pulled $51,970 million from operations — yet earned only half of what it made in the record year 2022, because its realized Brent price fell from $82.62 to $69.06 per barrel. The company quantifies that dependency itself at roughly $700 million of annual earnings per dollar of price. At the same time, 2025 distributions ran $13,892 million above what was left after capital expenditure, funded from cash and debt. Not investment advice.
What Our Rating Means
Open questions
The business works in principle, but one material question is open. As long as it stays open, our findings do not carry a quality verdict.
The business plainly works: $51,970 million of operating cash flow in the weakest year of the cycle, $254,381 million of equity, $603 million of interest expense, production at its highest level in more than 40 years, and an acquisition that produced only $1 billion of goodwill on a $63 billion price — substance bought, not expectation. No going-concern warning, no negative equity, no existential dependence on a single counterparty, no accounting or governance breach. Two operating questions remain open, however, and together they weigh enough for the more cautious rating. First, profitability swings so hard that 2020 carried a loss of $22,440 million; the cause sits outside the company and is quantified by it at $700 million per dollar of Brent. Second, 2025 distributions exceeded cash flow after capital expenditure by $13,892 million, the third year of falling coverage, with cash and the net debt ratio showing the bill. Separately stands the price question: at roughly 26 times trailing earnings the stock looks expensive, yet for a cyclical business that is exactly the usual optics at an earnings trough — measured against average 2020 to 2025 earnings it is roughly 25 times. That is a valuation argument, not a quality argument, and it does not change the rating. The decision is yours.
A journalistic assessment by our editorial team at the time of the deep dive, based on public sources — not investment advice and not a solicitation to buy or sell. Your personal circumstances (investment goals, risk capacity, taxes) cannot be taken into account. What our levels mean, how verdicts are formed, and what conflicts of interest exist →
Worth Noting
- Origin: survey of the 100 largest U.S. stocks by market capitalization as of July 28, 2026. ExxonMobil ranked 16th and had no analysis. Not a scanner hit.
- Data basis: Form 10-Q for the quarter ended March 31, 2026 (filed May 4, 2026), Forms 10-K for 2025 and 2022, Form 8-K of May 1, 2026, Form 8-K of July 7, 2026 (Exhibit 99.1). Fundamental data as of July 29, 2026.
- Filer number caution: reports through the first quarter of 2026 sit with the SEC under CIK 0000034088 (Exxon Mobil Corporation, New Jersey); newer filings under CIK 0002115436 (ExxonMobil Holdings Corporation, Texas). The XOM ticker and the NYSE listing were unchanged.
- The Form 25-NSE of July 2, 2026 concerns the predecessor's common stock and follows from the share exchange; it is not a delisting signal.
- Peak-earnings note: ExxonMobil is a cyclical business. Earnings, cash flow and return on equity are shown here across the full 2020 to 2025 cycle. Price scenarios appear solely as the sensitivity published by the company itself, not as a forecast of our own.
Frequently Asked Questions
The redomiciliation to Texas became effective on July 1, 2026. ExxonMobil Holdings Corporation (Texas, CIK 0002115436) replaced Exxon Mobil Corporation (New Jersey, CIK 0000034088, incorporated 1882) as successor registrant. Every share was exchanged one for one and the XOM ticker on the NYSE was unchanged. All annual and quarterly reports through the first quarter of 2026 sit under the old filer number.
No. The Form 25-NSE of July 2, 2026 reports the removal of the predecessor's common stock from listing on the New York Stock Exchange under 17 CFR 240.12d2-2(a)(3). It is the second half of the share exchange: the old share disappears and the new ExxonMobil Holdings Corporation share has traded under the same XOM ticker on the same exchange since July 2, 2026.
The company quantifies it in the 2025 annual report: for 2026, a one dollar change in the Brent price equals roughly $700 million of annual after-tax Upstream earnings, excluding derivatives. For natural gas the figures are roughly $90 million per $0.10 at the U.S. Henry Hub marker and roughly $20 million per $0.10 at the European TTF marker.
Because earnings swing with the commodity price, the price-earnings ratio is high at the earnings trough and low at the earnings peak. On 2025 earnings ExxonMobil traded at about 26 times, on the 2022 record profit at about 11 times, and in the 2020 loss year at no ratio at all. The average across a full upswing and downswing is more robust: $25,812 million per year on average from 2020 to 2025.
Measured against free cash flow, yes, since 2024. In 2025 operating activities provided $51,970 million and $28,358 million went into property, plant and equipment, leaving $23,612 million. Distributions were $37,504 million. The $13,892 million gap was funded from cash and debt; net debt to capital rose from 4.5 percent (2023) to 11.0 percent (2025).
On May 3, 2024, ExxonMobil issued 545 million of its own shares with a fair value of $63 billion and assumed debt with a fair value of $5 billion. It acquired identifiable assets of $88 billion, mostly property, plant and equipment in the Permian Basin; goodwill was only $1 billion. The price was paid in equity rather than cash — which is why the share count sits above the 2023 level despite heavy buybacks.
As of December 31, 2025, the company reported 19,311 million oil-equivalent barrels of proved reserves. Against the annual production of 1.8 billion barrels stated in the same report, that is roughly ten years — our own calculation from two figures in one document. Some 36 percent of those reserves are still undeveloped. In 2025 additions totalled 2.2 billion barrels while downward revisions ran to 0.9 billion.
Of $11,563 million of income taxes paid in cash in 2025, roughly $5,000 million went to the United Arab Emirates, $1,207 million to Canada, $1,100 million to Guyana and $1,114 million to the United States. The Emirates rate differential alone raised the group effective tax rate by 8 percentage points. The reported rate was 28 percent under U.S. accounting rules and 31 percent including equity company taxes.
Found an error?
Did you spot a factual error, an outdated number, or a typo in this deep dive? Let us know briefly — your report goes straight to the editorial team.