HF Sinclair Stock: When a Cyclical Lights Up the Value Filter and the Momentum Filter at Once
HF Sinclair (NYSE: DINO), the U.S. refiner from the HollyFrontier-Sinclair merger, shows up in our "Joshua" growth scanner — and, at the same time, in a dozen value and trend filters (data as of July 17, 2026). We read the annual reports (10-K) for fiscal years 2024 and 2025: net income that crashed from $2.9 billion (2022) to $177 million (2024) and climbed back to $579 million (2025), a renewables segment with a negative gross margin in every year — and a stock whose price-to-earnings ratio looks lowest exactly when the danger is highest. Not investment advice — just the question of which single point on a sine wave you are mistaking for a trend line.
 Thomas Mücke
Founder & Publisher
Thomas Mücke
Founder & Publisher
Chart
Interactive price chart (TradingView).
Note: pure fact-based analysis, not investment advice and not a solicitation to buy or sell. All figures without guarantee.
There is an investor trap that catches, of all people, the good-at-arithmetic ones: the cycle trap. It works like this: you find a company that earned fabulously well in its last record year, divide the price by that profit — and mistake the low result for a bargain. Or the reverse: you see a catastrophic trough year, decide the company is broken, and never look again. Both make the same error: they mistake a single point on a sine wave for a trend line. Hardly any stock demonstrates this trap in the summer of 2026 as textbook-perfectly as HF Sinclair Corporation (NYSE: DINO), the U.S. refiner born from the merger of HollyFrontier and Sinclair Oil. Because DINO does something rare: the stock lights up in our "Joshua" growth scanner — and, at the same time, in a dozen classic value and trend filters (data as of July 17, 2026). Cheap and rising at once, that sounds like every investor's dream. So let's make a deal: before you let this double signal seduce you, we read together what the company itself reported, under penalty of law, to the U.S. securities regulator, the SEC — the annual reports (10-K) for fiscal years 2024 and 2025 and the latest quarterly report (10-Q) as of March 31, 2026. And these filings tell a story about a margin that belongs to no one. In the end, you decide for yourself.
What HF Sinclair actually does — and where the profit comes from
HF Sinclair turns crude oil into the things America drives, flies and lubricates with. The company runs seven refineries (El Dorado, Tulsa, Puget Sound, Navajo, Woods Cross, Parco and Casper, plus an asphalt business) and is organized into five segments: Refining (gasoline, diesel, jet fuel), Renewables (renewable diesel from biomass), Marketing (gas stations under the heritage Sinclair brand), Lubricants & Specialties (lubricants, incl. Petro-Canada Lubricants, Red Giant Oil and Sonneborn) and Midstream (pipelines, tankage and loading facilities). Today's company was formed on March 14, 2022, when HollyFrontier acquired the fuel and lubricants marketer Sinclair Oil and combined both under a new holding company — which is why the U.S. securities regulator lists HF Sinclair as a newly registered company, not a renamed one. It is based in Dallas, its fiscal year ends December 31, and at the end of 2025 the company employed roughly 5,165 people (4,301 in the United States, 656 in Canada, 208 in Europe).
To understand HF Sinclair, you only need to internalize one sentence: a refiner's profit is a difference, not a price. A refinery buys crude oil and sells gasoline and diesel; what remains is the spread in between — in the jargon, the crack spread (because crude is "cracked" into its components). A refinery can barely steer that spread: both ends, the crude purchase and the product sale, are set on world markets. If the gasoline price rises faster than the oil price, HF Sinclair earns brilliantly; when it reverses, the company earns almost nothing despite running flat out. Which brings us to the central tension of this analysis, and it runs through every chapter: on paper a cheap value hit with momentum — but the profit both lenses are valuing is the most volatile there is on the market: a margin that swings from week to week. How fast an energy business swings between rush and hangover is something we dissected at oil producer SandRidge Energy, and why a "green" business of the future can burn cash for years, at battery maker Eos Energy.
Where the stock shows up in our scanner
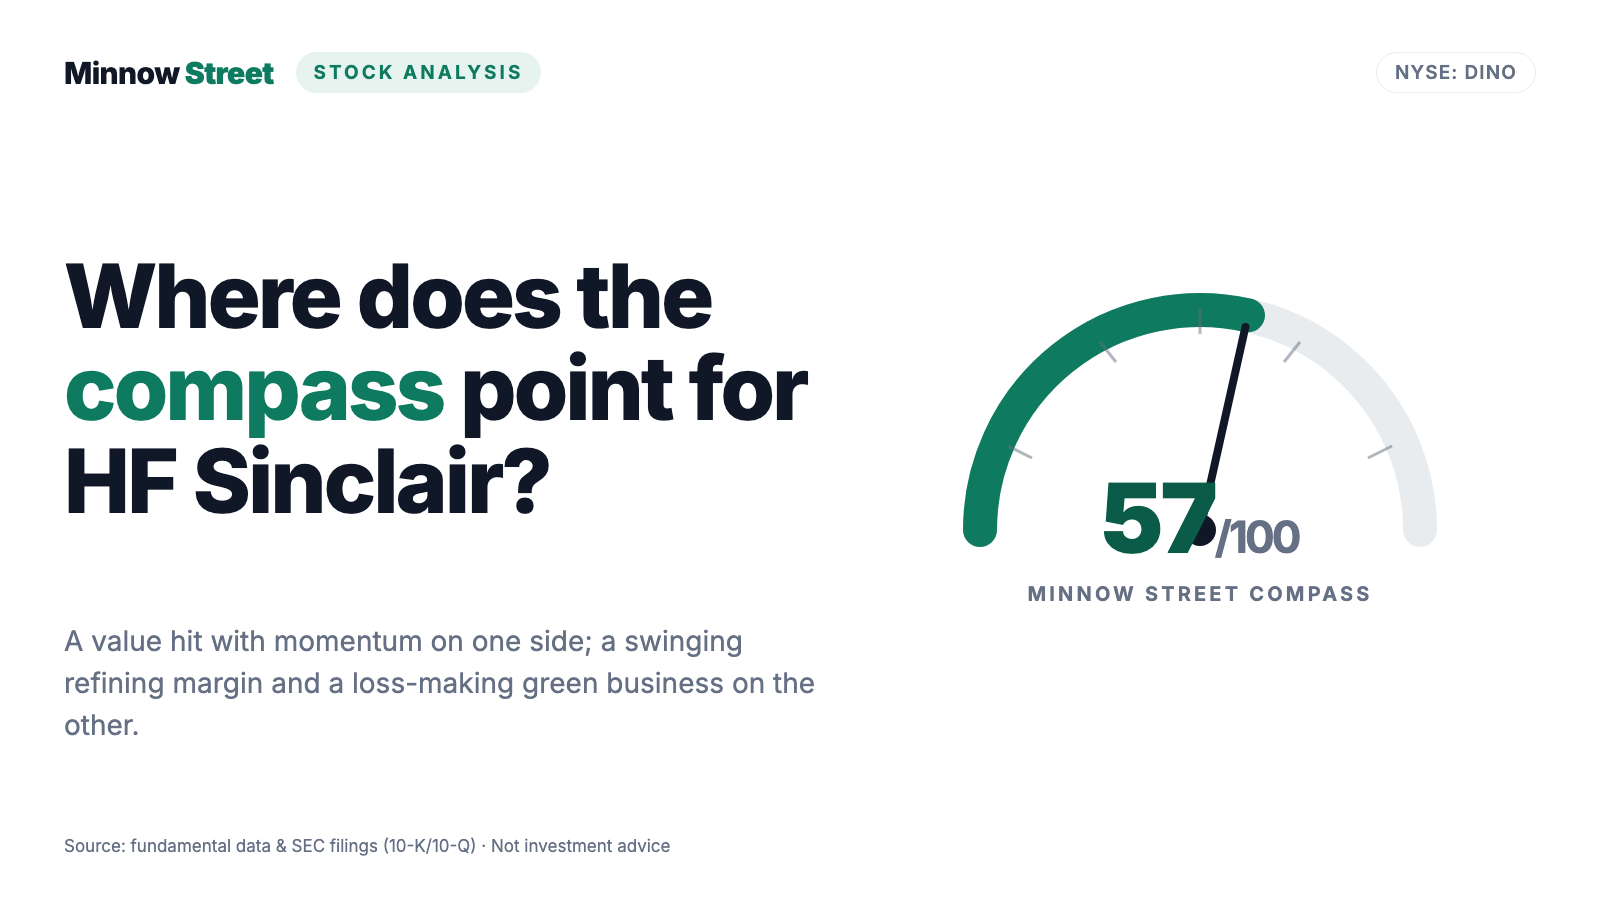
Every day we run about 3,500 stocks through our scanners. HF Sinclair reached the research list via the "Joshua" growth scanner (as of July 17, 2026) — but what is remarkable is not a single hit, it is the confluence: DINO sits in twelve of our scanners at once, and they seem to contradict each other. On the value side, the stock appears in "Tobias Carlisle: Acquirer's Multiple," "James O'Shaughnessy: Trending Value," and in the price-to-sales and price-to-cash-flow rankings — all filters that hunt for cheaply valued companies. On the trend side, the same scanner flags "Stan Weinstein: Stage 2" (price above a rising 200-day average), "Above the 50- and 200-day averages" and "institutional accumulation" — most recently 11 funds added while 6 trimmed. Behind that stand plus 32 percent over 200 days and plus 66 percent over twelve months (data as of July 17, 2026), with the price roughly 11 percent below its all-time high.
Translated, that means: one model thinks DINO is cheap, another thinks it is an intact uptrend. That is exactly the constellation that arms the cycle trap — a cyclical often looks cheap and strong at the same time right at the turn from trough to upswing, because the price is already turning while the reported profit still reflects the weak prior year. The scanner's fundamental metrics fit the picture: a price-to-earnings ratio around 10, a price-to-book ratio around 1.3 and a price-to-sales ratio around 0.4 (data as of July 17, 2026) — values typically low for a refiner, because the market knows the profits are not permanent. The analyst consensus of 16 firms sits at an average rating around 1.7 (on a scale where 1 means "strong buy") — cautiously positive, no cheering. Remember this fingerprint: when value filters and trend filters praise the same cyclical stock at once, they usually praise the same turning point — and that says nothing about where in the cycle you actually stand.
The numbers over the years — honestly appraised
First, what genuinely impresses. HF Sinclair is no growth laggard but a cash machine when the margin cooperates. In the record year 2022 — the first full year after the merger, when refining margins exploded worldwide — the company earned $2.9 billion in net income on $38.2 billion of revenue, diluted EPS reached a staggering $14.28, and operating cash flow hit $3.8 billion. Even in weaker years the business throws off serious cash: in 2025, despite mediocre margins, $1.3 billion of operating cash flow came in. And the most recent trend looks strong: after a virtually zero quarter in early 2025 (diluted EPS minus $0.02), the first quarter of 2026 jumped to $3.56 per share — a single quarter earned more than the entire prior year. Read only these lines and you see a cheap company with firming earning power. But now look at the whole curve — and at how deep the valley in between was.
Because between the record and the recovery lay a brutal crash. Net income fell from $2.9 billion (2022) through $1.59 billion (2023) to $177 million in fiscal year 2024 — diluted EPS shrank from $14.28 to $0.91. No scandal, no mismanagement, no accounting hole: simply a refining margin that normalized. And therein lies the lesson. A company that earns $14.28, then $0.91, then $3.08 per share in three years has no "normal" earning power you could write in a single line — it has a range. And every metric that computes with a single year's profit inherits that year's arbitrariness. Remember the rhythm: at HF Sinclair, the pace is set not by the company's own plant but by the gap between two world-market prices — and that gap does not care about quarterly targets. Which brings us to the uncomfortable truths.
What the filings say — the uncomfortable truths
Uncomfortable truth no. 1: The profit is a margin that belongs to no one
Why does the profit of a fully utilized refiner swing by a factor of 15? The annual report says so itself, in the risk section, with disarming candor — profitability hangs almost entirely on a price difference the company does not control:
"The profitability of our Refining, Lubricants & Specialties and Marketing segments depends largely on the spread between market prices for refined petroleum products and crude oil prices. … This margin is continually changing and may fluctuate significantly from time to time."
— HF Sinclair Corporation, SEC annual report 10-K for fiscal year 2025, Item 1A "Risk Factors"
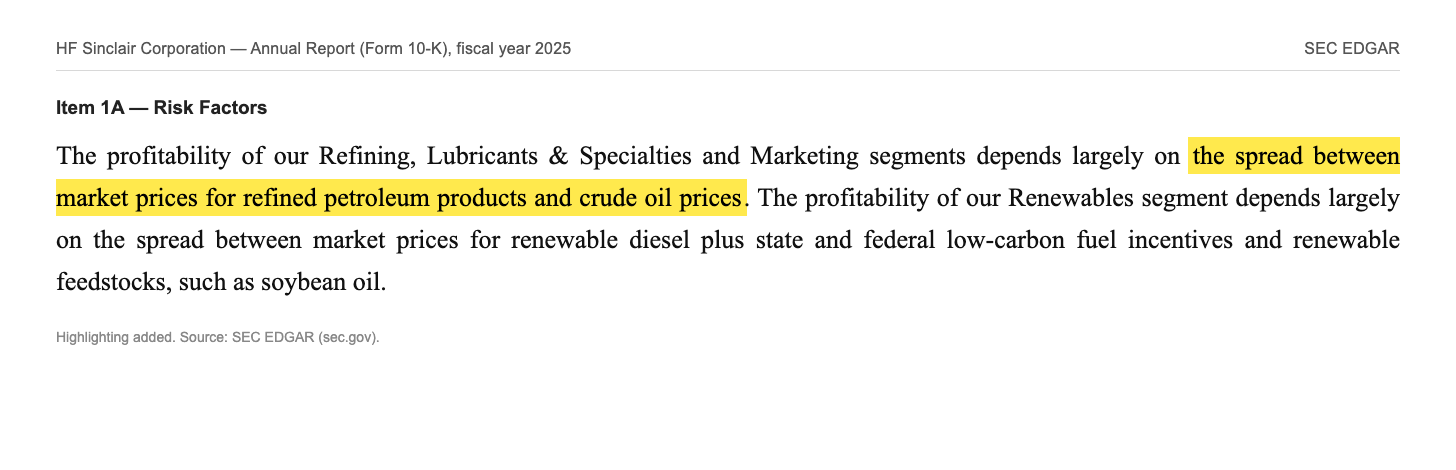
How completely that one line governs the whole company shows in the Refining segment's operating income over the years: $1,870 million in 2023, minus $167 million in 2024 — a genuine operating loss — and $563 million in 2025. The company itself quantifies the recovery soberly: refinery gross margin per produced barrel rose 47 percent in 2025 versus 2024. Which is exactly why honesty requires the other side too: HF Sinclair is well run, broadly diversified and extremely profitable in good years — but whoever buys the stock buys a bet on a price difference, not on a plannable business. Picture a baker who buys flour at world-market prices and sells bread at world-market prices, both set without his input — one year he is rich, the next he works for free, even though the oven never stood still for a second. That is how a refiner makes its money.
Uncomfortable truth no. 2: The green business of the future burns cash every year
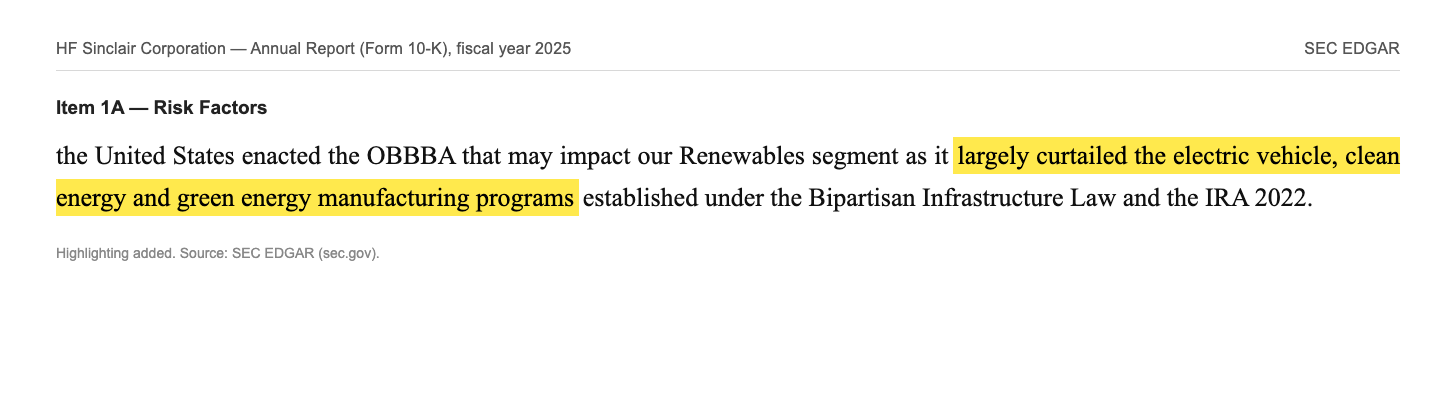
In many energy companies' storytelling, "renewables" is the word meant to secure the future. At HF Sinclair, over the review period, it is mainly a money-losing business. The Renewables segment (renewable diesel) reported a negative gross margin in fiscal years 2023, 2024 and 2025 throughout — minus $128, minus $86 and minus $129 million — and an operating loss of $133 million in 2025 alone. The reason is the same margin mechanics as with crude, only with different prices: renewable diesel only pays off when the sale price plus government low-carbon incentives exceed the expensive feedstocks. And policy is turning the incentive tap right now — the annual report names it explicitly:
"the United States enacted the OBBBA that may impact our Renewables segment as it largely curtailed the electric vehicle, clean energy and green energy manufacturing programs established under the Bipartisan Infrastructure Law and the IRA 2022."
— HF Sinclair Corporation, SEC annual report 10-K for fiscal year 2025, Item 1A "Risk Factors"
In fairness: HF Sinclair has honestly disclosed the renewables business as a standalone segment rather than letting the losses vanish in the big Refining pot — and, unlike the core business, it has already written the green business down by $309 million (accumulated goodwill impairment). But for the investment decision the sober finding counts: the segment meant to secure the future currently costs money instead of earning it — and its fate lies in Washington, not in the market. How stubborn a "green" promise of the future can be when it burns more cash than it brings in for years is shown in our analysis of Eos Energy.
Uncomfortable truth no. 3: "Cheap" is an illusion on cyclicals — and most dangerous at the peak
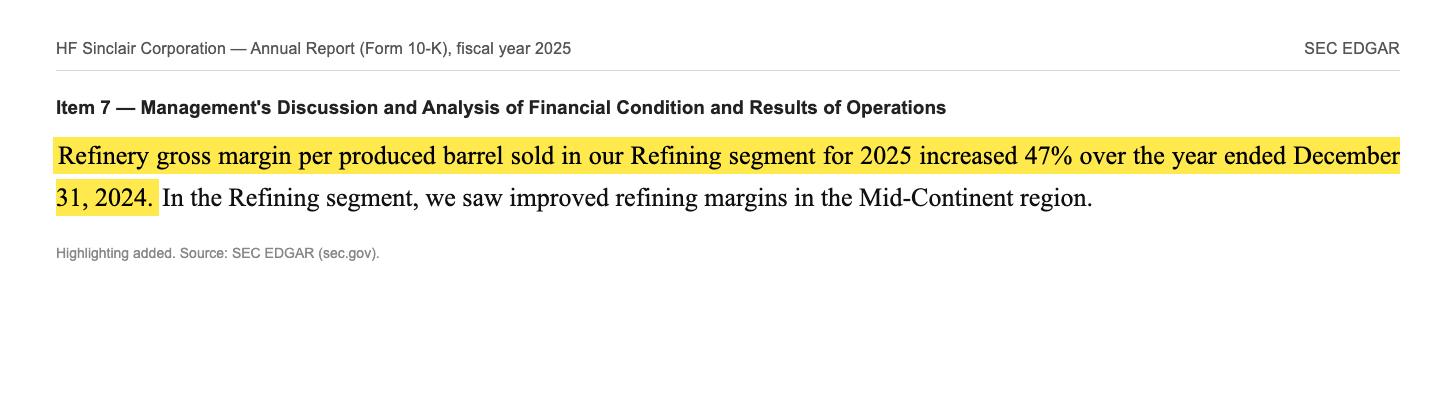
Now we return to the cycle trap from the opening, because here it becomes tangible. A price-to-earnings ratio around 10 sounds like a bargain. But which profit is in the denominator? Annualize the strong first quarter of 2026 ($3.56 per share times four ≈ $14 of annual profit) and the stock looks dirt cheap — a single-digit P/E. Compute with the trough year 2024 ($0.91 per share) and the same stock sits at a P/E above 60 and looks wildly expensive. Both calculations use the same price and the same company — and are a factor of seven apart. That is exactly the cyclical valuation fallacy: on a cyclical, a low P/E is often a warning sign (earnings are at the peak and will fall), and a high P/E often harmless (earnings are at the bottom and will rise). The company itself supplies the proof of how fast the margins turn:
"Refinery gross margin per produced barrel sold in our Refining segment for 2025 increased 47% over the year ended December 31, 2024."
— HF Sinclair Corporation, SEC annual report 10-K for fiscal year 2025, Item 7 "Management's Discussion and Analysis"
The lovely counterweight comes in the next chapter — it is called Midstream. But first remember this rule, which will help you with any commodity, chemical or auto-supplier stock: a cyclical is cheap not when the P/E is low, but when it earns more across a whole cycle than the price implies. And you do not read a whole cycle from a single quarter.
Valuation: roughly $11 billion in market value — and a quiet anchor made of steel pipe
At mid-year 2026, HF Sinclair carried roughly $11 billion of market value (data as of July 17, 2026), on about 186 million shares outstanding. Measured against revenue that is little (price-to-sales around 0.4), against book value moderate (price-to-book around 1.3 on $9.2 billion of equity), and against earnings — well, that depends on which year you believe (price-to-earnings around 10, data as of July 17, 2026). More important than any single metric is what does not swing: the Midstream segment (pipelines, tankage, loading) earned a steady $363 million of operating income in 2025 — more than the large but moody Refining segment ($563 million, after minus $167 million the year before). Pipelines collect fee-based revenue and care little about the crack spread; they are the calm counterweight within the company. Add profitable lubricants (operating income $165 million in 2025, after $240 million in 2024) and the small but growing Sinclair marketing brand ($73 million). This segment mix makes HF Sinclair more robust than a pure-play refinery.
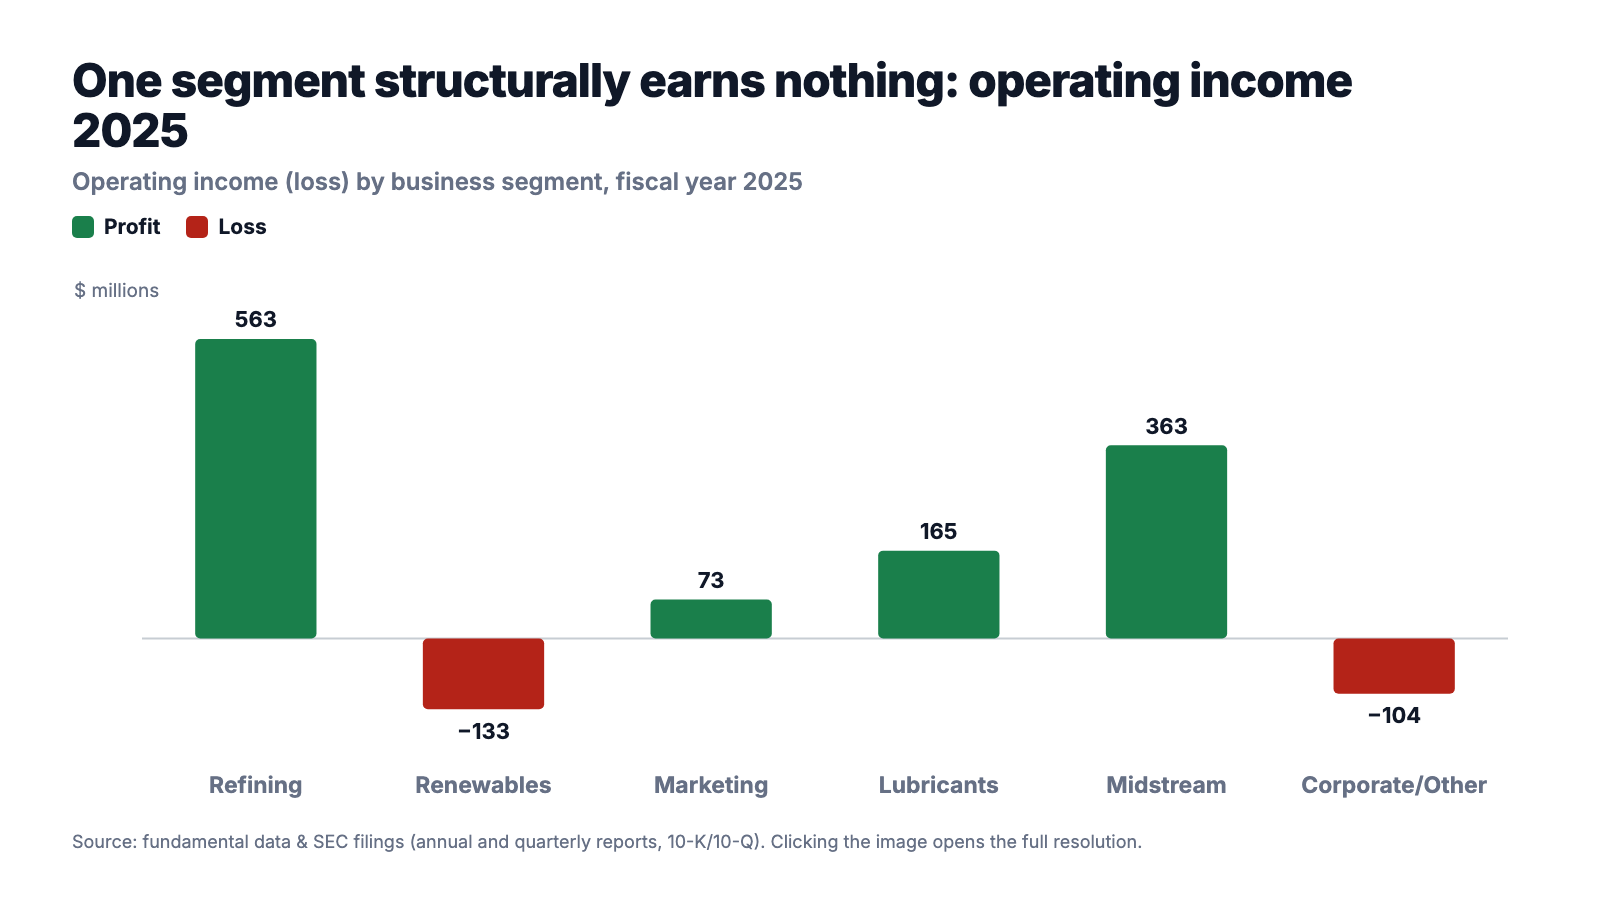
Capital returns dutifully follow the cycle: the dividend has stood at $2.00 per share since fiscal year 2024 ($0.50 per quarter, most recently payable March 12, 2026) — $376 million flowed to shareholders for it in 2025. Buybacks, by contrast, breathe with the profit: from $1.37 billion in the record year 2022 through $999 million (2023) and $672 million (2024) to just $354 million in 2025. That is balance-sheet smart — the company buys when cash is there rather than borrowing — but it also exposes the limit of the "cheap plus buyback" story: precisely when the stock would look optically cheapest (in a low-margin year), the money for big buybacks is missing. The balance sheet stays solid: $978 million in cash and roughly $3.0 billion of total liquidity at year-end 2025, against $2.77 billion of long-term debt — no millstone, but no net-cash cushion like some small caps either.
Opportunities and risks at a glance
What speaks for HF Sinclair:
- Earning power in good years: net income of $2.9 billion (2022) and $1.3 billion of operating cash flow even in the mediocre year 2025; the first quarter of 2026, at $3.56 per share, earned more than the entire prior year.
- Stable counterweights to Refining: the Midstream segment (pipelines) delivered $363 million of operating income in 2025 — more than the swinging Refining segment — plus profitable lubricants ($165 million) and the growing Sinclair marketing brand ($73 million).
- Low valuation on revenue and book value: price-to-sales around 0.4, price-to-book around 1.3 (data as of July 17, 2026); plus a dividend held stable at $2.00 per share since 2024.
- A solid, un-stretched balance sheet: $978 million in cash, roughly $3.0 billion of liquidity, $9.2 billion of equity at year-end 2025; buybacks are paid from cash flow, not on credit.
- Technicals and confluence: a Stan Weinstein stage-2 uptrend, price above the 50- and 200-day averages, institutional accumulation, plus 66 percent over twelve months — and, at the same time, hits in several value filters (data as of July 17, 2026).
What speaks against it:
- The profit is a margin that belongs to no one: net income from $14.28 through $0.91 to $3.08 per share (2022–2025); Refining operating income tipped into a $167 million loss in 2024 — the company controls neither crude nor product prices.
- The cyclical valuation fallacy: a P/E around 10 can be a bargain or a trap depending on where in the cycle earnings sit — a low P/E is often a warning sign on refiners, not a buy argument.
- The Renewables segment burns cash: a negative gross margin in fiscal years 2023, 2024 and 2025 (down to minus $129 million), a $133 million operating loss in 2025 — and the supporting funding programs are being curtailed by law (OBBBA), per the 10-K.
- Capital returns shrink with the profit: buybacks fell from $1.37 billion (2022) to $354 million (2025) — precisely in the low-margin year the money for big buybacks is missing.
- Regulation and the energy transition as permanent themes: refineries carry high environmental, compliance and emissions costs, and the long-run demand path for fossil fuels is uncertain.
A human conclusion
Back to the cycle trap from the opening. Its core is not that cyclicals are bad investments — across a whole cycle they can be very good ones, and HF Sinclair is a soundly run, broadly diversified company with a quiet pipeline anchor and an honest balance sheet. Its core is that our brain mistakes the last data point for the future: the record year 2022 makes the stock look permanently cheap, the strong first quarter of 2026 tempts you to extrapolate, and the double signal from value and momentum filters feels like double confirmation — when both merely praise the same turning point. So the honest question for you is not "Is HF Sinclair cheap?" (measured against a single year's profit: sometimes yes, sometimes no), but: how much does this company earn on average across a whole up-and-down — and are we closer to the bottom or the top of that wave right now? Whoever has a reasoned answer and can stomach the swing finds a business with real anchors of substance here. Whoever lacks the answer buys not a cheap company but a particular point on a sine wave — and hopes it was the right one. What you make of it is your decision. And that is exactly as it should be.
Sources
All original documents used in this analysis — to read for yourself:
- HF Sinclair Corporation — SEC annual report 10-K for fiscal year 2025 (ended December 31, 2025; filed February 27, 2026)
- HF Sinclair Corporation — SEC annual report 10-K for fiscal year 2024 (ended December 31, 2024; filed February 20, 2025)
- HF Sinclair Corporation — SEC quarterly report 10-Q as of March 31, 2026 (filed May 1, 2026)
- HF Sinclair Corporation — SEC quarterly report 10-Q as of September 30, 2025 (filed October 30, 2025)
- HF Sinclair Corporation — SEC quarterly report 10-Q as of March 31, 2025 (filed May 1, 2025)
- HF Sinclair Corporation's complete SEC filing history: EDGAR overview (sec.gov)
- Fundamental data (metrics, segment and quarterly series, valuation; data as of July 17, 2026), reconciled with the SEC filings.
- Screener and rating data: in-house stock scanner, "Joshua" growth scanner plus eleven more filters (data as of July 17, 2026).
Transparency & disclaimer: This analysis is a journalistic contextualization of publicly available information and is not investment advice, not a financial analysis in the regulatory sense, and not a solicitation to buy or sell securities. Stock investments carry substantial risks up to total loss. All information without guarantee; the data cut-off is noted in the text in each case. The author holds no position in HF Sinclair stock at the time of publication.
Our Bottom Line at a Glance
- Earning power & cash positive
- A cash machine in good years: $2.9 billion of net income in 2022, $1.3 billion of operating cash flow even in the mediocre year 2025, Q1 2026 already above the entire prior year at $3.56 per share (10-K FY 2025, 10-Q as of 03/31/2026).
- Cyclicality & margin dependence negative
- The profit is a margin that belongs to no one: EPS from $14.28 through $0.91 to $3.08 (2022–2025), Refining operating income in a $167 million loss in 2024. A low P/E is often a warning sign here, not evidence of a bargain (10-K FY 2025, Item 1A).
- Renewables segment negative
- The green business of the future burns cash: a negative gross margin in fiscal years 2023, 2024 and 2025 (down to minus $129 million), a $133 million operating loss in 2025 — and the supporting funding programs are being curtailed by the OBBBA law, per the 10-K.
- Diversification & balance sheet positive
- Quiet anchors against the refining cycle: Midstream (pipelines) earned a steady $363 million of operating income in 2025, plus profitable lubricants and the growing Sinclair brand; a solid balance sheet with $978 million in cash, roughly $3.0 billion of liquidity and $9.2 billion of equity (12/31/2025).
- Valuation & capital returns neutral
- Optically cheap on revenue (P/S ~0.4) and book value (P/B ~1.3), dividend stable at $2.00 per share since 2024 — but buybacks shrank with the profit from $1.37 billion (2022) to $354 million (2025); the "cheap plus buyback" story carries least in the low-margin year (data as of July 17, 2026).
HF Sinclair is a soundly run, broadly diversified U.S. refiner with a quiet pipeline anchor (Midstream $363 million of operating income in 2025) and an honest balance sheet — but its profit is a refining margin that belongs to no one and swung from $14.28 through $0.91 to $3.08 per share (2022–2025). The green Renewables segment posts a negative gross margin every year, and a price-to-earnings ratio around 10 is ambiguous on a cyclical: a bargain at the bottom, a trap at the top. Whoever invests here buys not plannable earning power but a point on a sine wave. Not investment advice.
What Our Rating Means
- If you don't own the stock
- As long as the question raised in the bottom line stays open, we see no basis for an entry.
- If you hold it in your portfolio
- Our findings offer no acute reason to sell — the checkpoints named remain decisive.
A journalistic assessment by our editorial team at the time of the deep dive, based on public sources — not investment advice and not a solicitation to buy or sell. Your personal circumstances (investment goals, risk capacity, taxes) cannot be taken into account. What our categories mean, how verdicts are formed, and what conflicts of interest exist →
Worth Noting
- DINO reached our research list via the "Joshua" growth scanner (as of July 17, 2026); the confluence with eleven more scanners — including several value filters (Tobias Carlisle, O'Shaughnessy) and trend filters (Stan Weinstein stage 2) — is typical for a cyclical at the turn and is not double proof, but the same one twice.
- Scanner metrics (P/E, P/S, P/B) are computed from trailing or expected figures; on a cyclical the reported P/E depends massively on which year sits in the denominator — which is why the order of magnitude matters more than the decimal place.
- Price and valuation figures are dated to July 17, 2026 (market value roughly $11 billion); analyses are evergreen, daily prices are not a buy argument. HF Sinclair's fiscal year ends December 31; identity and history (merger 03/14/2022, no former names) verified via EDGAR submissions.
Frequently Asked Questions
HF Sinclair Corporation (NYSE: DINO) of Dallas is a U.S. refiner with five segments: Refining (seven refineries for gasoline, diesel, jet fuel), Renewables (renewable diesel), Marketing (the Sinclair gas-station brand), Lubricants & Specialties (lubricants, incl. Petro-Canada Lubricants) and Midstream (pipelines and tankage). Revenue in fiscal year 2025 (ended December 31, 2025): $26.9 billion, net income $579 million.
HF Sinclair was formed on March 14, 2022, from the merger of HollyFrontier and Sinclair Oil under a new holding company — which is why the U.S. securities regulator lists it as a newly registered company (no former names in the EDGAR registry). The ticker DINO plays on the green dinosaur "Dino," the decades-old advertising mascot of the Sinclair brand.
Because a refiner's profit is a margin, not a price: the company buys crude oil and sells refined products, and both prices are set on world markets. That spread (the "crack spread") fluctuates sharply. Net income accordingly fell from $2.9 billion (2022) to $177 million (2024) and rose to $579 million (2025); diluted EPS swung from $14.28 through $0.91 to $3.08.
Not over the review period: the Renewables segment (renewable diesel) posted a negative gross margin in fiscal years 2023, 2024 and 2025 (minus $128, minus $86 and minus $129 million) and a $133 million operating loss in 2025. Per the annual report (10-K), the 2025 U.S. curtailment of green funding programs (OBBBA) burdens the segment further.
Careful: on cyclicals the price-to-earnings ratio deceives. Annualize the strong first quarter of 2026 ($3.56 per share) and DINO looks dirt cheap; compute with the trough year 2024 ($0.91) and the same stock sits at a P/E above 60. A low P/E is often a warning sign on refiners (earnings at the peak), not a buy argument — what matters is the average across a whole cycle (data as of July 17, 2026).
Solid, but without a fat cash cushion: at year-end 2025, $978 million in cash and roughly $3.0 billion of total liquidity stood against $2.77 billion of long-term debt and $9.2 billion of equity. The dividend has held steady at $2.00 per share since 2024 ($0.50 per quarter). Buybacks, by contrast, shrank with the profit from $1.37 billion (2022) to $354 million (2025).
Found an error?
Did you spot a factual error, an outdated number, or a typo in this deep dive? Let us know briefly — your report goes straight to the editorial team.