Range Resources: A Balance Sheet Score of 8 of 9 — and the Bet That Score Never Sees
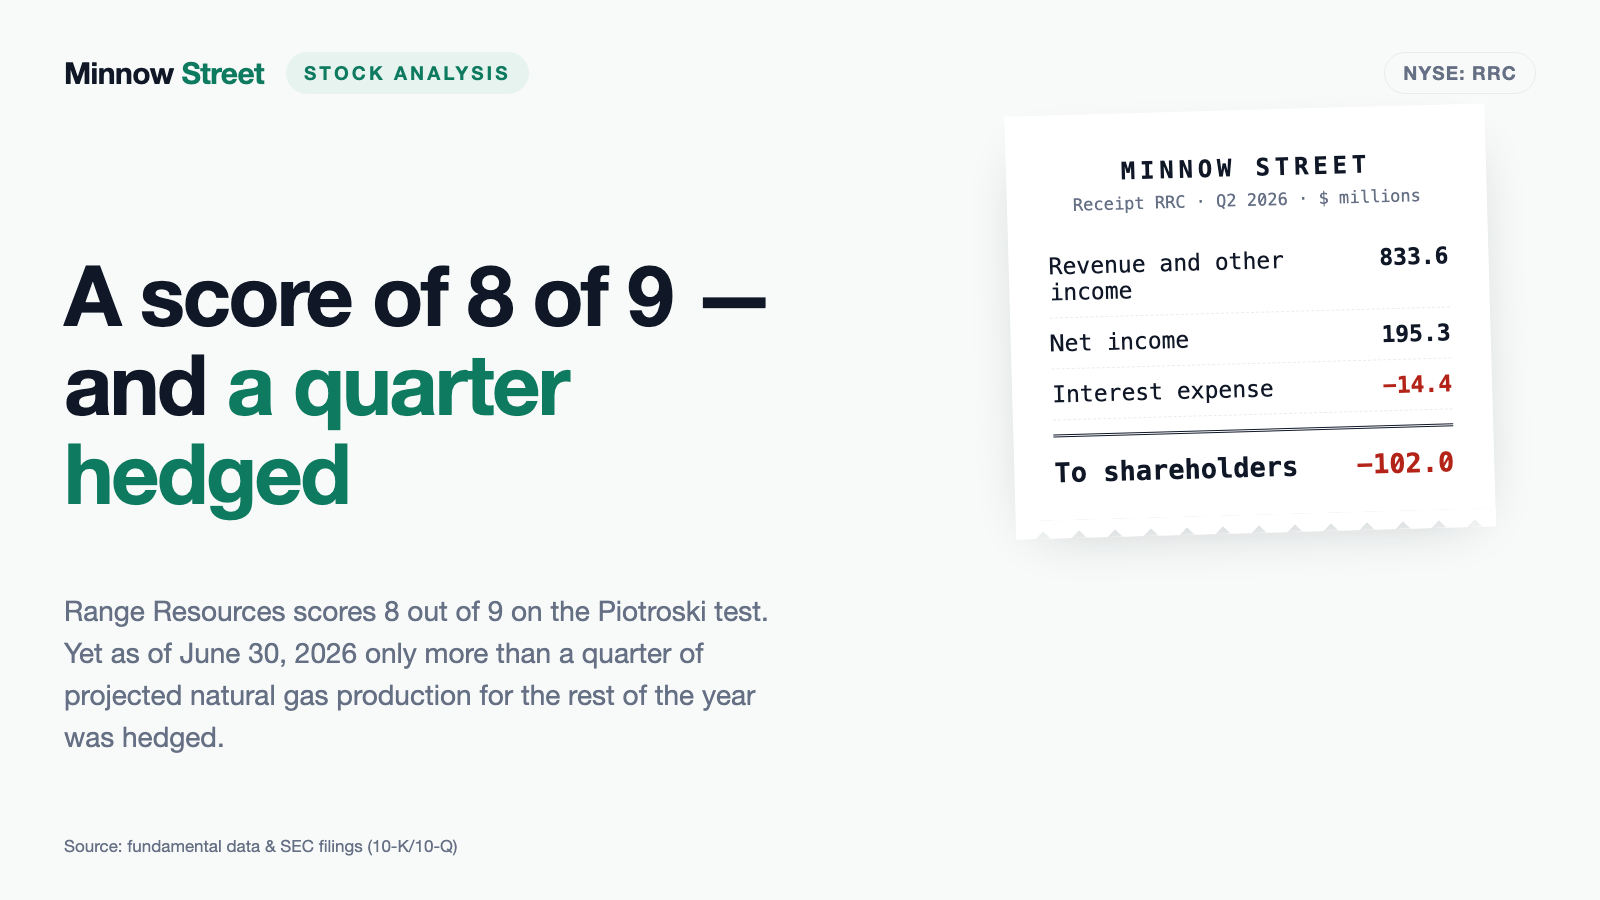
As of July 26, 2026, our in-house stock scanner lists Range Resources on 18 screens, among them the Piotroski balance sheet test with a score of 8 of 9. The numbers behind it are real: $1,171.3 million of operating cash flow in 2025, $537.0 million of net income in the first half of 2026 alone, an expensive $600 million bond retired in January 2026. But that test measures only what already happened. The quarterly report filed July 21, 2026, carries the sentence that shows what is still open: as of June 30, 2026 barely more than a quarter of projected gas production for the rest of the year was hedged — the rest rides the spot price. A good grade for yesterday is not a promise for tomorrow.
 Thomas Mücke
Founder & Publisher
Thomas Mücke
Founder & Publisher
Chart
Interactive price chart (TradingView).
Note: pure fact-based analysis, not investment advice and not a solicitation to buy or sell. All figures without guarantee.
There is an investing trap that was installed back in school: the report card reflex. You see a grade — 8 out of 9 — and your brain instantly turns it into a forecast. Whoever earned an eight last term will earn an eight again. With people that is often true. With Range Resources Corporation (NYSE: RRC) it is a category error: the test that handed out that eight measures only what happened in the last completed fiscal year. What the next twelve months bring is decided by something else entirely — the price the market pays for a thousand cubic feet of natural gas. So let us make a deal: before you trust the grade, we read together what the company itself told the U.S. securities regulator, the SEC. Above all the quarterly report (10-Q) as of June 30, 2026, filed July 21, 2026, and the annual report (10-K) for 2025, filed February 24, 2026. An SEC filing is honest under penalty of perjury. And this one describes a company that operates unusually well, has retired its most expensive debt, keeps $247,000 in the bank — and sends three quarters of its gas production into the market unhedged. What you do with that is your call.

What Range Resources Actually Does — Drilling Where the Gas Sits Tight
Range Resources is a producer, not a transporter and not a utility. The company leases acreage, drills straight down and then sideways into a rock formation, pumps in water and sand until the rock fractures, and lifts out what has been locked away for millions of years. Its home turf is the Marcellus shale in Pennsylvania — geologically one of the most prolific gas formations in North America, and commercially interesting mainly because it sits close to the demand centers of the U.S. East Coast.
The scale: as of December 31, 2025 Range reported 18.1 Tcfe of proved reserves. Tcfe stands for trillion cubic feet of natural gas equivalent — the volume that can be recovered with today’s wells, technology and prices with a high degree of confidence. Of that, 71 percent is already developed, 65 percent is natural gas, 34 percent natural gas liquids (NGLs) and 1 percent oil. In 2025 the company produced an average of 2.24 billion cubic feet equivalent per day from 1,579 wells (1,499 of them net), up from 2.18 billion in 2024. All of that is run by 564 full-time employees (as of January 1, 2026) out of Fort Worth, Texas, under President and CEO Dennis L. Degner.
Remember that pair of numbers: 2.18 to 2.24. That is two years of volume growth — barely 3 percent. Everything beyond that which swings in the income statement comes from price. And there sits the tension running through this analysis: a company that operates remarkably steadily delivers results that are anything but steady.
One note on mistaken identity: anyone digging through older SEC records will find the name Lomak Petroleum Inc. That is the same company. In the regulator’s register it was carried under that name until July 16, 1998; the file number (CIK 315852) has not changed since. There was no bankruptcy restart and no successor entity — the series run straight through.
How the Stock Reached Our Desk
Range Resources landed on the research list through our in-house stock scanner, specifically the screen called Piotroski F-Score (7–9). The Piotroski test is a balance sheet check built from nine yes-or-no questions: Is the company earning money? Is real cash coming in? Is it getting more profitable? Is debt shrinking? Does it need to issue new shares? Each yes is worth one point. Range scores 8 of 9 — genuinely strong: a 6 would be fine but not good, while a thoroughly healthy company sits at 8 or 9. As of July 26, 2026, the U.S. selection of this screen held 16 names.
More interesting than any single screen is the overlap. On July 26, 2026 Range appeared on 18 screens at once — alongside the Piotroski check, the P/E ranking, value stocks, the Levermann filter, the Buffett criteria, Terry Smith quality, QARP (quality at a reasonable price), the EBIT margin ranking and Benjamin Graham’s defensive investor. If you want to repeat this yourself: open the scanner, select the Piotroski F-Score (7–9) screen and set the market to the United States. All of these lists are recalculated daily — what is in today can be gone tomorrow.
One screen breaks the pattern, and honestly it is the most important one: Stan Weinstein Stage 1. In Weinstein’s framework, stage 1 is the basing phase — the stock trades sideways and has not started an uptrend. As of July 24, 2026 it sat below both its 50-day and its 200-day moving average. That is not a contradiction of the quality screens; it is the tension translated into price action: the balance sheet convinces, the market waits. What it is waiting for comes next.
Six of the nine Piotroski criteria can be recounted straight from the filings. Net income in 2025 was positive ($658.0 million). Operating cash flow was positive ($1,171.3 million). Return on assets rose from 3.6 percent to 8.9 percent ($266.3 million and $658.0 million of net income against total assets of $7,347.7 million and $7,421.9 million). Cash flow ran well above net income — a sign the profit is not an accounting artifact. No new shares were issued; on the contrary, Range repurchased $230.6 million of its own stock in 2025. And asset turnover rose from 0.33 to 0.42, because the same balance sheet produced more revenue.
The Numbers Across the Years — Given Their Due
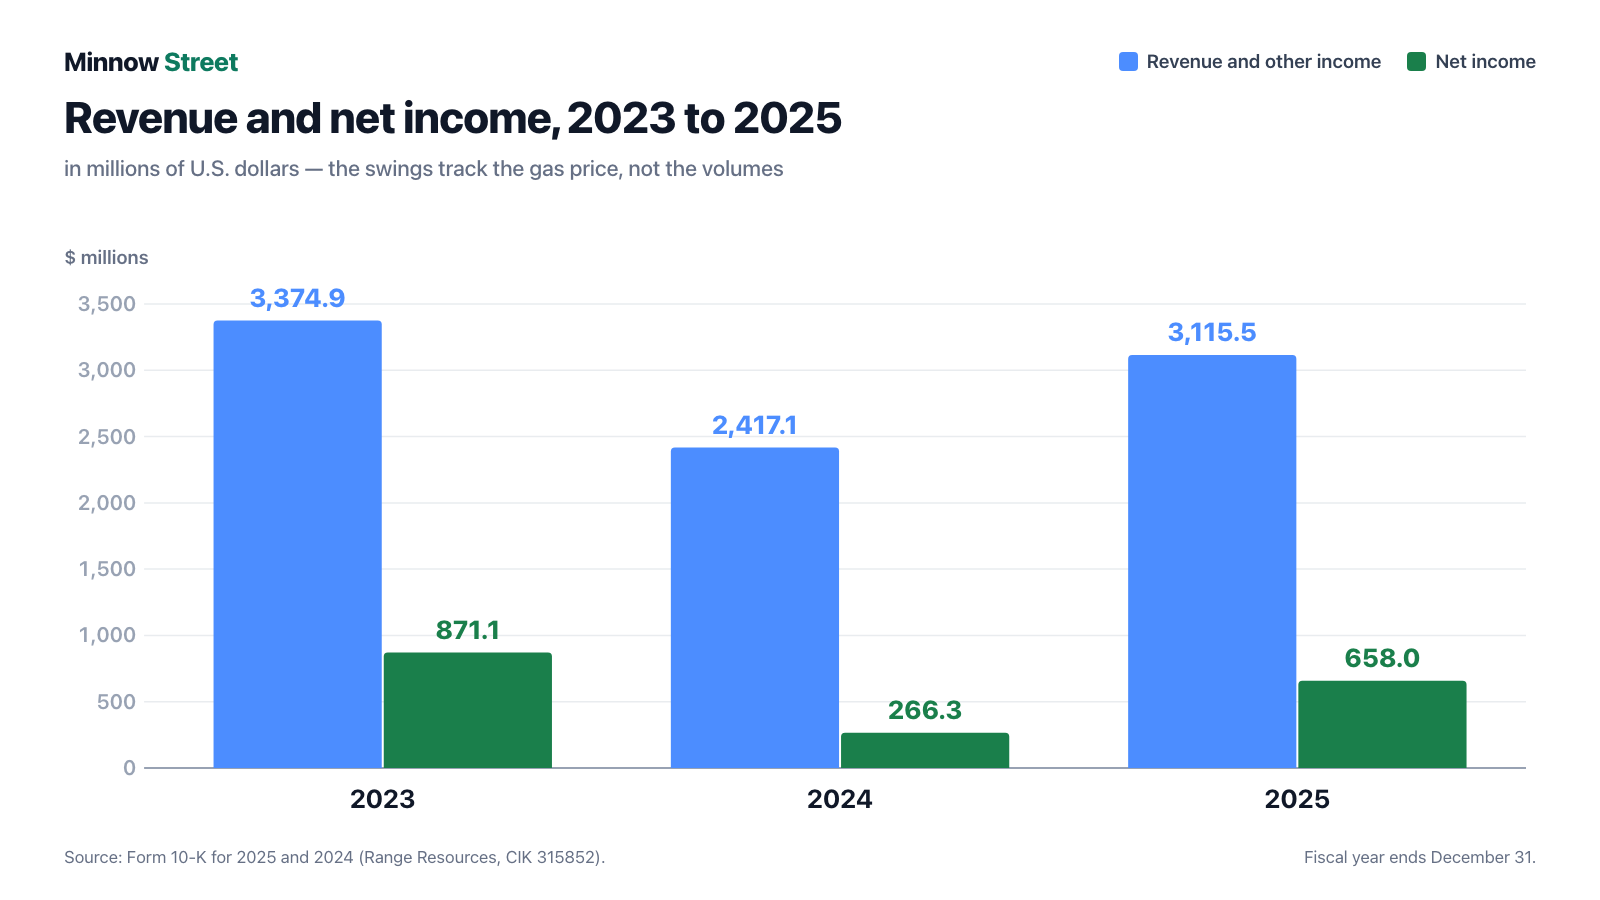
Start with what genuinely impresses. Range Resources has not posted a single annual loss in three years — in an industry where losses are part of the furniture. 2023: $3,374.9 million of revenue and other income, $871.1 million of net income. 2024: $2,417.1 million of revenue, $266.3 million of net income. 2025: $3,115.5 million of revenue, $658.0 million of net income, or $2.74 per diluted share after $1.09 the year before.
More telling than net income is operating cash flow — the money that actually lands in the account after all running costs. It came to $977.9 million in 2023, $944.5 million in 2024 and $1,171.3 million in 2025. Unlike net income, it barely dipped in the weak year. That is the strength of this business model: costs per unit produced are low and stable. Direct operating expense ran at $0.13 per mcfe in the second quarter of 2026, against $0.11 a year earlier.
And the first half of 2026 goes further still: $1,867.7 million of revenue (prior-year period $1,546.8 million), $537.0 million of net income ($334.6 million), or $2.27 per diluted share ($1.39), on $854.2 million of operating cash flow ($666.3 million). The money went into the balance sheet. In January 2026 Range redeemed its 8.25 percent senior notes, $600 million of principal, ahead of schedule at 101.375 percent of par, booking a $12.3 million loss on early extinguishment. Interest expense consequently fell to $14.4 million in the second quarter of 2026 from $26.8 million a year earlier — a 46 percent drop per mcfe produced.
As of June 30, 2026, stockholders’ equity stood at $4,708.7 million against total assets of $7,561.9 million, an equity ratio of roughly 62 percent. For a commodity producer that is very solid. If you want the same math for the transport side of the gas business, our Summit Midstream analysis shows the ratio flipped on its head.
What the Filings Say — The Uncomfortable Truths
No. 1: The Grade Measures the Past. The Price Makes the Future.
Range writes it into its own risk factors, without any softening:
“Natural gas, NGLs and oil prices are volatile, and a decline in prices could adversely affect our profitability and financial condition. As a commodity business, the oil and gas industry is typically cyclical and we expect the volatility to continue. Natural gas prices are likely to affect us the most because approximately 65% of our proved reserves were natural gas as of December 31, 2025 and, at times in the past, natural gas prices have been low compared to our costs to produce.”
— Range Resources, Form 10-K for 2025, Item 1A Risk Factors

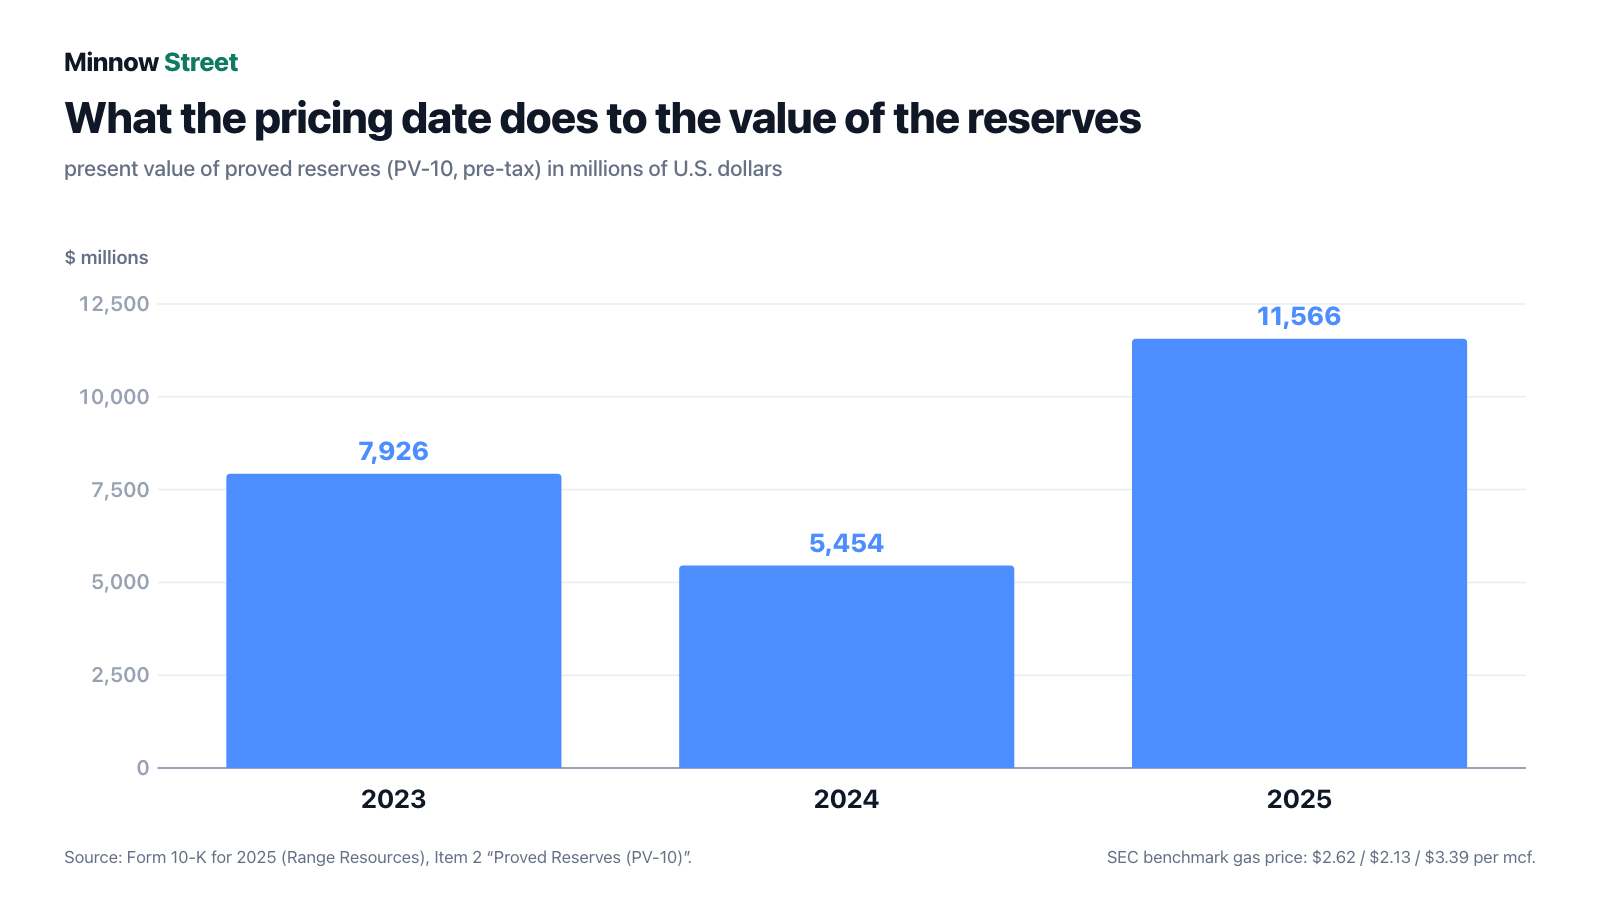
No metric shows the strength of that lever better than PV-10. It is the discounted present value of the cash flows Range expects from its proved reserves — in plain terms, what the gas in the ground is worth. SEC rules require that it be calculated at the average price of the year in question. The result: PV-10 was $7,926 million in 2023, $5,454 million in 2024 and $11,566 million in 2025. The reserves in the ground were essentially the same across all three years. Only the benchmark gas price moved: $2.62, then $2.13, then $3.39 per mcf.
No. 2: Three Quarters of Production Runs Into the Market Unhedged
A producer can protect itself against falling prices by selling forward. That costs upside when prices rise and saves the year when they fall. Range uses it only sparingly. The quarterly report filed July 21, 2026 puts it this way:
“As of June 30, 2026, we have hedged more than 25% of our projected natural gas production for the remainder of 2026.”
— Range Resources, Form 10-Q as of June 30, 2026, Item 2 (Liquidity and Capital Resources)

The second quarter of 2026 showed what that means in practice. Production rose 5 percent to 208,972,296 mcfe. Over the same stretch the NYMEX benchmark for natural gas fell from $3.44 to $2.89 per mcf. The result: natural gas revenue dropped 15 percent to $339.8 million, and earnings per share slipped from $0.99 to $0.83. More work, less money — and nobody inside the company made a mistake.
No. 3: $247,000 in Cash — the Liquidity Is Borrowed
As of June 30, 2026, Range Resources held $247,000 in cash. Not million: two hundred forty-seven thousand. As of December 31, 2025 it was $204,000. The reported liquidity of roughly $1.5 billion therefore consists almost entirely of a secured credit facility:

This is not distress — it is a deliberate choice not to let money sit idle. But it carries a consequence worth knowing. The facility is not a fixed amount. Its $3.0 billion borrowing base is redetermined annually and depends, per the filing, primarily on how the lenders assess future cash flows — that is, on the commodity price. It was reaffirmed at $3.0 billion in March 2026, with commitments from the seventeen participating banks at $2.0 billion. Drawings stood at $381.0 million as of June 30, 2026, against $125.0 million a year earlier, plus $165.1 million of undrawn letters of credit. If the gas price falls hard, cash flow and the credit line shrink together.
No. 4: The Second-Biggest Revenue Block Is Not Gas at All
In the second quarter of 2026, of $702.1 million in production revenue only $339.8 million came from natural gas — and $312.8 million from natural gas liquids, meaning the ethane, propane and butane that come up with the stream. Oil added $49.5 million. NGLs now stand for 45 percent of production revenue and sit just $27.0 million behind natural gas. While gas revenue fell 15 percent, NGL revenue rose 31 percent and oil revenue 61 percent. Anyone buying this stock as a pure gas bet has it half wrong — we took apart how closely the NGL business tracks its own price cycles in our NGL Energy Partners analysis.
No. 5: The Balance Sheet Has a Memory
As of June 30, 2026, equity held $5,978.2 million of additional paid-in capital, less $852.6 million for treasury stock — and a retained deficit of $419.9 million. A retained deficit is the sum of every profit and loss since the company was founded, minus the dividends paid out. It is still negative. As of December 31, 2024 it stood at $1,480.6 million in the red, as of December 31, 2025 at $909.2 million. Meaning: Range Resources is still working off the crash of earlier years. At the pace of the first half of 2026, zero would be reached in well under a year — provided the gas price cooperates. The price range the annual report cites for 2023 through 2025 makes the swing tangible: between $22.61 and $43.50 per share.
Valuation — Not Expensive, but Not Safe Either
A daily quote has no place in an analysis; it is wrong by tomorrow. So start with an anchor that lives inside a mandatory filing: in the second quarter of 2026 Range Resources itself repurchased 2.0 million shares for $78.4 million — an average of just over $39 per share. Applied to the 233,679,515 shares outstanding on July 17, 2026, that implies a market capitalization on the order of $9.2 billion. Fundamental data show $8.57 billion as of July 24, 2026; the difference is a matter of the measurement date, not of the arithmetic.
On that basis (fundamental data as of July 24, 2026) the valuation looks like this: price to earnings of roughly 9.6, and about 9.3 on the estimate for the current year. Price to book of 1.9. Enterprise value to EBITDA of roughly 6.1. Price to cash flow of 6.3. A dividend yield of 1.06 percent on a payout ratio of only 10.6 percent, which leaves plenty of room. For a producer with a 62 percent equity ratio, a 21.1 percent return on equity and an Altman Z-score of 5.55 — anything above 3 counts as balance sheet safe — that is not expensive.
The professional view: 26 analysts cover the name, the consensus price target sits at $46.59, and the mean recommendation is 1.7 on a scale from 1 (buy) to 5 (sell). That is decidedly friendly. Against it stands a figure worth noticing: 11.98 percent of the free float was sold short (data as of July 24, 2026). Nearly one in eight freely tradable shares has been borrowed and sold by someone betting on a decline. Optimism and skepticism rarely square off this hard.
And the debt side? As of June 30, 2026, total debt stood at $881.0 million: $500 million of fixed-rate senior notes at 4.75 percent due 2030, plus $381.0 million drawn on the floating-rate credit facility at a recent 5.4 percent. The filing does the rate sensitivity itself: one additional percentage point at the short end costs roughly $3.8 million of extra annual interest.

Opportunities and Risks at a Glance
What speaks for Range Resources:
- Three years without a loss in a loss-prone industry: $871.1 million (2023), $266.3 million (2024) and $658.0 million of net income (2025), plus $537.0 million in the first half of 2026 alone.
- Operating cash flow held at $944.5 million even in the weak year 2024 and rose to $1,171.3 million in 2025 — the cost base per mcfe produced is low and stable.
- The balance sheet has been cleaned up consistently: the 4.875 percent notes were repaid in May 2025, and the 8.25 percent notes worth $600 million were redeemed early in January 2026. Interest expense fell to $14.4 million in the second quarter of 2026 from $26.8 million a year earlier.
- Cash returns are running: $230.6 million of buybacks (6.4 million shares) and $85.7 million of dividends ($0.36 per share, up 12.5 percent) in 2025, plus $105.5 million of buybacks and $47.5 million of dividends in the first half of 2026. In February 2026 the board raised the repurchase program to an aggregate $1.5 billion; roughly $1.4 billion of it was still available as of June 30, 2026, and the payout ratio is only 10.6 percent.
- The reserve life is long: 18.1 Tcfe as of December 31, 2025 against annual production of roughly 0.8 Tcfe — more than twenty years on paper. 53 net wells were drilled in 2025 with a 100 percent success rate.
- No customer concentration worth the name: only one purchaser reached 10 percent of production revenue in 2025, after 15 percent in 2024 and 13 percent in 2023.
What speaks against it:
- As of June 30, 2026, barely more than a quarter of projected gas production for the rest of the year was hedged. The rest rides the spot price — in the second quarter of 2026 that cost 15 percent of gas revenue despite 5 percent more production.
- A balance sheet grade of 8 out of 9 is a rear-view mirror. It rewards exactly what a strong price year produces automatically: rising returns, rising asset turnover, falling debt.
- Cash on hand was $247,000 as of June 30, 2026. The reported $1.5 billion of liquidity is a credit line whose borrowing base is redetermined annually against expected cash flows — and therefore against commodity prices.
- The retained deficit of $419.9 million as of June 30, 2026 shows that across its entire history the company has still lost more than it has earned.
- Nearly one in eight freely tradable shares was sold short (11.98 percent of the free float, data as of July 24, 2026) — the opposing bet is large.
- Our in-house scanner places the stock in Stan Weinstein’s basing phase (stage 1): as of July 24, 2026 it traded below both its 50-day and its 200-day moving average. Quality alone does not make a trend.
A Human Verdict
The report card reflex from the opening deserves an honest answer. The eight out of nine is not invented — it is earned, and six of its building blocks can be recalculated straight from the filings. Range Resources is a well-run, low-cost, balance-sheet-clean producer that has shed its most expensive debt and returns money to its owners. That is more than most commodity producers can claim.
Only that grade answers a different question than the one you are actually asking. It says: “This company ran a clean shop last year.” It does not say: “This company will earn cleanly next year.” Between those two sentences sit $2.89 per mcf — the benchmark price of the second quarter of 2026, against $3.44 a year earlier — and a hedge ratio of barely more than a quarter. Range has deliberately chosen not to hedge the price away. That is a legitimate strategy: if you believe gas prices are going up, hedging gives away money. But it is a bet, and shareholders carry it whether they want to or not.
So whoever buys this stock buys two things in one package: an above-average producer and an unhedged position in the natural gas price. The first can be analyzed. The second nobody can forecast — not even the 26 analysts with their $46.59 target. What you make of that is your decision. And that is exactly as it should be.
Sources
- Quarterly report 10-Q as of June 30, 2026 (filed July 21, 2026), Range Resources Corporation, CIK 0000315852
- Quarterly report 10-Q as of March 31, 2026 (filed April 21, 2026)
- Annual report 10-K for 2025 (filed February 24, 2026)
- Annual report 10-K for 2024 (filed February 25, 2025)
- Current reports on Form 8-K dated July 22, 2026 (second-quarter 2026 results), July 10, 2026 and May 13, 2026
- Fundamental data (metrics, valuation, analyst estimates, short interest), data as of July 24, 2026
- Our in-house stock scanner, screen membership and Piotroski score, as of July 26, 2026 — the screens are recalculated daily
This analysis is journalistic commentary on publicly available documents and is not investment advice. It contains no buy or sell recommendation and is not a solicitation to buy or sell securities. Shares of commodity producers are volatile; a total loss is possible with any equity investment. All figures come from the SEC filings named above or from fundamental data with a stated as-of date. The author holds no position in Range Resources at the time of publication.
Our Bottom Line at a Glance
- Operations and cost position positive
- Range produces cheaply and steadily: 2.24 billion cubic feet equivalent per day on average in 2025 after 2.18 billion in 2024, with direct operating expense of $0.13 per mcfe in the second quarter of 2026. 53 net wells drilled in 2025 at a 100 percent success rate, and 18.1 Tcfe of proved reserves as of December 31, 2025 — more than twenty years of inventory on paper. The largest purchaser accounted for 10 percent of production revenue in 2025, after 15 percent in 2024.
- Earnings quality and volatility negative
- Net income swung from $871.1 million (2023) to $266.3 million (2024) and back to $658.0 million (2025) on essentially unchanged volumes. That is not operational weakness; it is the design of the business — earning power is not plannable. The retained deficit of $419.9 million as of June 30, 2026 shows the company has still lost more than it has earned across its entire history.
- Balance sheet and debt reduction positive
- As of June 30, 2026, $881.0 million of debt faced stockholders' equity of $4,708.7 million, an equity ratio of roughly 62 percent and an Altman Z-score of 5.55 (data as of July 24, 2026). The 4.875 percent notes were repaid in May 2025 and the 8.25 percent notes worth $600 million redeemed early in January 2026. Interest expense fell to $14.4 million in the second quarter of 2026 from $26.8 million a year earlier.
- Hedging and liquidity structure negative
- As of June 30, 2026, the quarterly report puts hedged volumes at more than 25 percent of projected gas production for the rest of the year — close to three quarters runs unhedged. On top of that, cash on hand was $247,000, and the reported $1.5 billion of liquidity is a credit line whose $3.0 billion borrowing base is redetermined annually against expected cash flows. If the gas price falls, both shrink together.
- Capital returns positive
- In 2025 the company spent $230.6 million on buybacks (6.4 million shares) and $85.7 million on dividends ($0.36 per share, up 12.5 percent). The first half of 2026 added $105.5 million of buybacks and $47.5 million of dividends. The payout ratio stood at only 10.6 percent as of July 24, 2026. In February 2026 the board raised the repurchase program to an aggregate $1.5 billion; roughly $1.4 billion of it was still available as of June 30, 2026.
- Valuation neutral
- As of July 24, 2026, price to earnings sat at roughly 9.6, price to book at 1.9 and EV/EBITDA at roughly 6.1 — not expensive for a producer with this balance sheet. The documented price anchor from the company's own second-quarter 2026 repurchases is $39.20 per share. Against that stand 11.98 percent of the free float sold short and a consensus target of $46.59 from 26 analysts.
Range Resources is neither a turnaround case nor a growth story, but a cleanly run natural gas producer carrying an open bet in its belly. The documented strengths are real: $1,171.3 million of operating cash flow in 2025, $537.0 million of net income in the first half of 2026 alone, an equity ratio of roughly 62 percent, the expensive 8.25 percent notes retired in January 2026, plus buybacks and a growing dividend. Against that: as of June 30, 2026 only just over a quarter of projected gas production was hedged, cash on hand was $247,000, and net income fell by more than two thirds between 2023 and 2024 without anyone making a mistake. Whoever buys here buys a good company and an unhedged commodity position in the same package. Not investment advice.
What Our Rating Means
Open questions
The business works in principle, but one material question is open. As long as it stays open, our findings do not carry a quality verdict.
The business clearly works: low production costs, more than twenty years of reserves, three consecutive profitable years, a balance sheet with roughly 62 percent equity, and interest expense that fell to $14.4 million per quarter after the 8.25 percent notes were retired in January 2026. There is no substance finding — no going concern issue, no customer concentration, no accounting or governance red flag. What remains open is the operational core question of earning power: net income swung between $266.3 million and $871.1 million within three years on essentially identical volumes, and as of June 30, 2026 just over a quarter of projected gas production was hedged. The retained deficit of $419.9 million also shows the company has lost more than it has earned across its history. Hence yellow: proven quality in execution, unproven consistency in results. The decision is yours.
A journalistic assessment by our editorial team at the time of the deep dive, based on public sources — not investment advice and not a solicitation to buy or sell. Your personal circumstances (investment goals, risk capacity, taxes) cannot be taken into account. What our levels mean, how verdicts are formed, and what conflicts of interest exist →
Worth Noting
- Range Resources reached our research list through our in-house stock scanner, specifically the Piotroski F-Score (7–9) screen with a score of 8 of 9. As of July 26, 2026 the stock appeared on 18 screens in total, including the P/E ranking, value stocks, Levermann, the Buffett criteria, Terry Smith quality, QARP and Benjamin Graham's defensive investor — and at the same time on Stan Weinstein Stage 1, meaning the basing phase without an uptrend. The U.S. selection of the Piotroski screen held 16 names at that date. All screens are recalculated daily.
- Mistaken identity: SEC records up to July 16, 1998 carry the name Lomak Petroleum Inc. That is the same company under the same file number (CIK 0000315852) — there was no bankruptcy restart and no successor entity, so the series run straight through. Also not to be confused: Range Resources produces and does not transport; gathering and pipeline companies with similar names in the gas business are separate firms with a different business model.
- Valuation figures are dated and evergreen: the $39.20 price anchor is not a daily quote but the average price of the company's own share repurchases in the second quarter of 2026 ($78.4 million for 2.0 million shares, documented in the quarterly report filed July 21, 2026). The annual report cites a price range of $22.61 to $43.50 for 2023 through 2025. Metrics and analyst estimates carry an as-of date of July 24, 2026. Analyses are evergreen; daily prices are not a reason to buy.
Frequently Asked Questions
Range Resources Corporation (NYSE: RRC), based in Fort Worth, Texas, produces natural gas, natural gas liquids (NGLs) and oil from the Marcellus shale in Pennsylvania. It drills its own wells but does not transport gas and serves no end customers. As of December 31, 2025 it held 18.1 Tcfe of proved reserves and produced an average of 2.24 billion cubic feet equivalent per day from 1,579 wells, with 564 full-time employees as of January 1, 2026.
The Piotroski test asks nine yes-or-no questions of the latest annual accounts: Is net income positive? Is cash coming in? Are returns rising? Is debt falling? Each yes scores one point. An 8 of 9 is a strong result — a 6 would be fine but not good. The key caveat: the test measures only the completed period and says nothing about the price environment ahead.
Almost entirely. Production rose only from 2.18 to 2.24 billion cubic feet equivalent per day between 2024 and 2025, while net income jumped from $266.3 million to $658.0 million. The present value of the reserves (PV-10) follows the pricing date the same way: $7,926 million in 2023, $5,454 million in 2024 and $11,566 million in 2025, on essentially unchanged reserves in the ground.
The quarterly report filed July 21, 2026 states it verbatim: as of June 30, 2026, more than 25 percent of projected natural gas production for the rest of 2026 was hedged through derivative contracts. Close to three quarters therefore runs at the prevailing market price. That is a deliberate strategy — it pays off when prices rise and costs when they fall.
Because no money is meant to sit idle. Every free dollar goes into drilling, debt reduction, share repurchases and the dividend. The roughly $1.5 billion of liquidity cited in the quarterly report as of June 30, 2026 therefore consists almost entirely of the secured credit facility, whose $3.0 billion borrowing base is redetermined annually and depends on expected future cash flows.
Yes, and it is growing. The company paid out $85.7 million in 2025, equal to $0.36 per share after $0.32 in 2024. In the second quarter of 2026 it was $0.10 per share against $0.09 a year earlier. As of July 24, 2026 the payout ratio stood at only 10.6 percent of earnings and the dividend yield at 1.06 percent.
NGLs are natural gas liquids — ethane, propane and butane that come up with the gas stream and are sold separately. They follow different price cycles than natural gas. In the second quarter of 2026 they brought in $312.8 million, 45 percent of production revenue, leaving them just $27.0 million behind natural gas at $339.8 million.
As of June 30, 2026, total debt stood at $881.0 million: $500 million of fixed-rate senior notes with a 4.75 percent coupon due 2030, and $381.0 million drawn on the credit facility at a recent 5.4 percent. Stockholders' equity was $4,708.7 million. In January 2026 the expensive 8.25 percent notes worth $600 million were redeemed early.
Found an error?
Did you spot a factual error, an outdated number, or a typo in this deep dive? Let us know briefly — your report goes straight to the editorial team.