XP Inc.: The Cheapest Number on Our List Is Wrong Twice
XP ranks 10th in the U.S. selection of our in-house stock scanner, at a price-to-free-cash-flow ratio of 0.6. That would be dirt cheap if the number were right. It is not: it divides a market capitalization in U.S. dollars by a cash flow in Brazilian reais. Put both in the same currency and the ratio is about 3.0. And even then the metric does not hold, because the money flowing through it belongs to clients. We walk through every step so you can check it yourself.
 Thomas Mücke
Founder & Publisher
Thomas Mücke
Founder & Publisher
Chart
Interactive price chart (TradingView).
Note: pure fact-based analysis, not investment advice and not a solicitation to buy or sell. All figures without guarantee.
There is a reflex that reliably costs investors money, and it looks harmless: you see a small number and read it as a price. A price-to-earnings ratio of 4. A price-to-book of 0.5. Or, as here, a price-to-free-cash-flow ratio of 0.6 — meaning the entire market value would be paid back out of current cash flow in seven months. Your head does the arithmetic and your gut shouts: the market must have made a mistake.
Sometimes it has. And sometimes the number itself is simply wrong. With XP Inc. (NASDAQ: XP) it is the latter — twice over. So we are going to do something we rarely do: take apart our own metric before we talk about the company. By the end you will know what is left of that 0.6, and you will be able to reproduce every step.
What XP actually does
XP is the largest independent investment platform in Brazil. Before XP, securities business there ran almost entirely through five large banks selling their own products. XP built an open marketplace alongside them: independent advisors bring in clients, the platform executes the trades, and it earns money on commissions, on the interest spread and on asset management.
The scale as of December 31, 2025: 4.76 million active clients, R$1,491 billion in client assets under custody, roughly 18,000 affiliated advisors and 8,069 employees of its own, based in São Paulo, Rio de Janeiro, New York and Miami. On top of that a loan book of R$35 billion, a card business with R$53 billion in transaction volume and retirement plan balances of R$95 billion.
One detail that matters in a moment: XP is legally a Cayman Islands company, listed in New York and priced in U.S. dollars — and it reports in Brazilian reais. The share costs dollars; the business earns reais. The annual report says so explicitly:

Where the stock came across our desk
Every day we run about 3,500 stocks through our in-house stock scanner. One of those lists is the price-to-free-cash-flow ranking: it sorts companies by how many times the market capitalization is contained in free cash flow, cheapest first.
The finding, measured on July 27, 2026: 545 stocks in the U.S. selection meet the criteria. XP sits at a displayed ratio of 0.6 in rank 10 — among the ten apparently cheapest names on the entire list, visible on the first page. Measured identically on both of our brands. These lists are recalculated daily.
That rank 10 is the reason for this analysis. Because it does not survive being recalculated.
Uncomfortable truth no. 1: the metric divides dollars by reais
A price-to-free-cash-flow ratio is a fraction. Market capitalization on top, free cash flow underneath. For the result to mean anything, both figures have to be in the same currency — otherwise you are measuring apples in pears.
With XP that is exactly what happened. Recalculated with the inputs behind our list:
- Numerator: market capitalization of about $8.29 billion (data as of July 27, 2026).
- Denominator: free cash flow for the four quarters to March 31, 2026, of R$15,049 million.
- Result: 8.29 divided by 15.05 gives 0.55 — displayed as 0.6.
Those two figures are in different currencies. The annual report supplies the exchange rate itself — the commercial selling rate published by the Brazilian Central Bank for December 31, 2025:

„Unless otherwise indicated, we have translated real amounts into U.S. dollars using a rate of R$5.502 to US$1.00, the commercial selling rate for U.S. dollars as of December 31, 2025 as reported by the Central Bank.“
— XP Inc., SEC annual report on Form 20-F for 2025, Item 5.A
Now the calculation in one currency. Convert the numerator into reais: $8.29 billion times 5.502 is roughly R$45.6 billion. Divided by cash flow of R$15.05 billion, that gives:
A price-to-free-cash-flow ratio of about 3.0 — not 0.6.
The check in the other direction lands in the same place: convert the cash flow into dollars (R$15.05 billion divided by 5.502 is about $2.74 billion) and divide the market capitalization by it, and you again get roughly 3.0. The displayed figure is therefore too low by a factor of 5.5 — precisely the exchange rate.
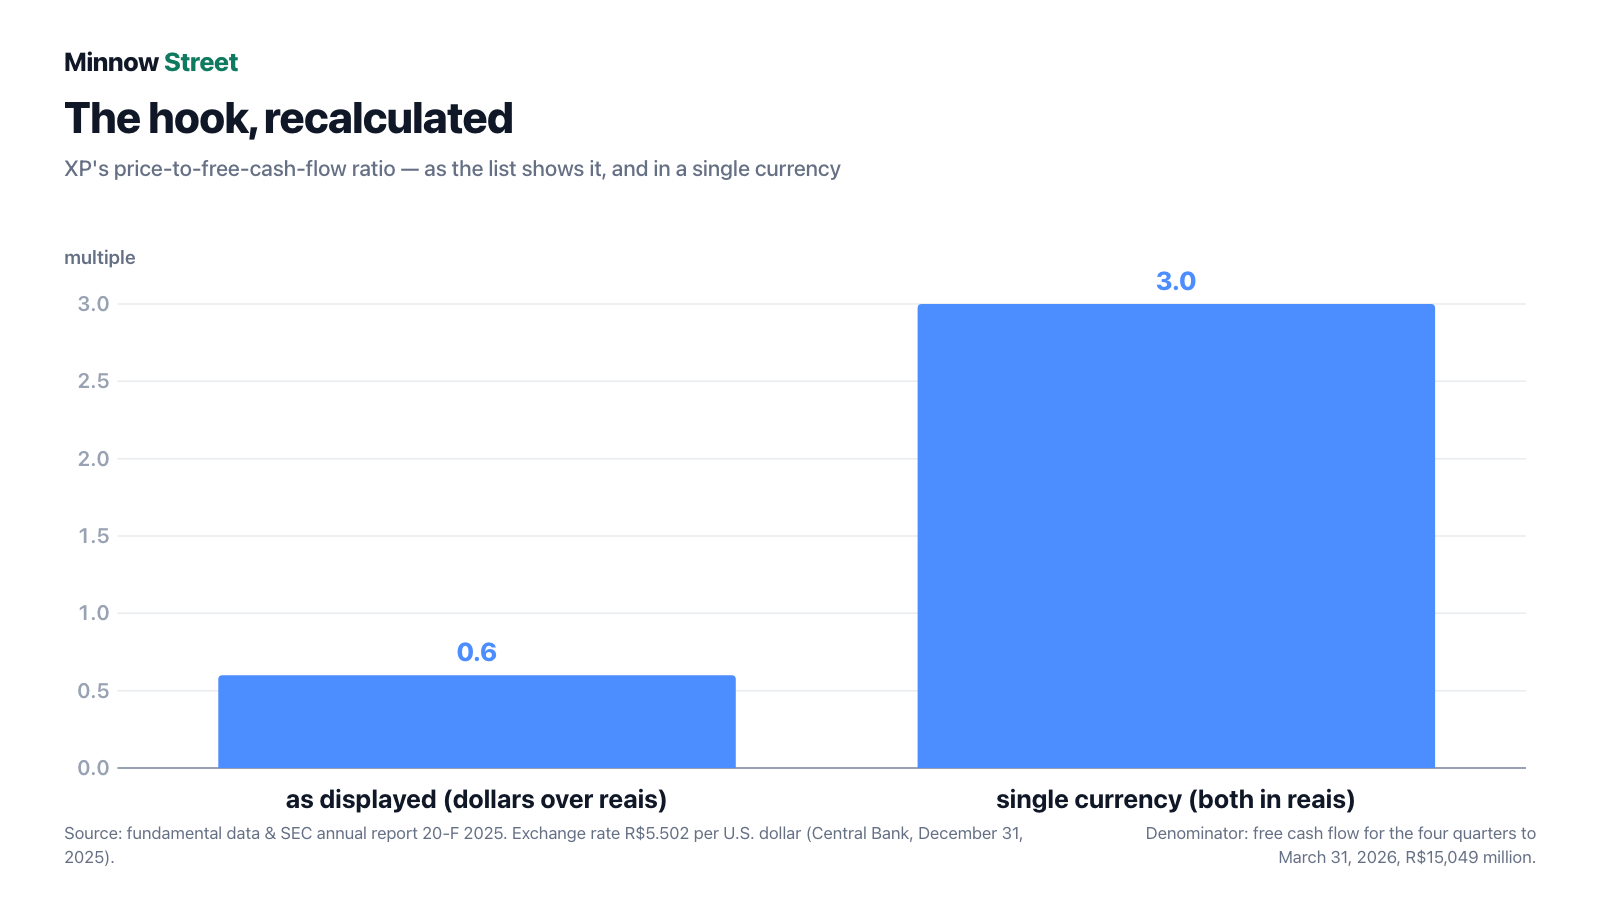
What that does to the rank: rank 10 is an artifact. At a ratio around 3.0, XP would sit well behind the 25 rows the detail page shows at all. Anyone opening the list and seeing XP near the top is not looking at a bargain, but at a conversion error.
And this is not a one-off. We found the same break in a second Brazilian name: the StoneCo analysis carries a price-to-cash-flow ratio of 1.1 that likewise sets a dollar market capitalization against a real-denominated cash flow. The pattern hits foreign issuers listed in New York that do not report in dollars. How many names are affected in total we have not yet measured — that it is more than one, we now know.
Uncomfortable truth no. 2: the money flowing through belongs to clients
Suppose the currency error were not there — would a ratio of 3.0 then be a buying argument? Still no. Because at an investment platform, operating cash flow measures something different from what it measures at an industrial company.
At a machinery maker, operating cash flow is what remains after wages, materials and taxes: money the company can dispose of. At XP, client money runs through that same line — securities balances, cash sitting in settlement accounts, retirement plan balances. When those balances rise it looks like cash inflow; when they fall, like outflow. None of it is distributable, because none of it belongs to XP.
You do not have to infer this from the balance sheet — XP writes it into the annual report:
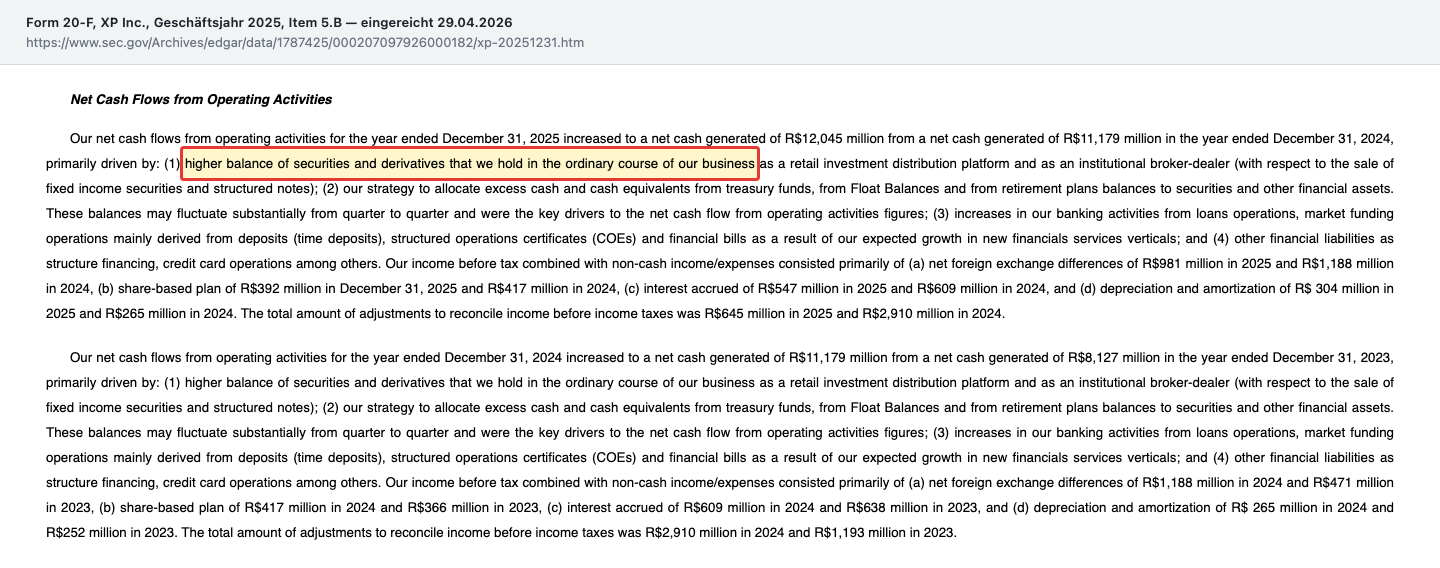
„These balances may fluctuate substantially from quarter to quarter and were the key drivers to the net cash flow from operating activities figures.“
— XP Inc., SEC annual report on Form 20-F for 2025, Item 5.B
How violently those balances swing shows up quarter by quarter: in the first quarter of 2025 operating cash flow was negative at minus R$2,634 million; in the third quarter of 2025 it was positive at R$12,307 million; in the fourth quarter it turned negative again. A metric whose denominator changes sign is not a valuation anchor.
We have met this pattern twice before. At OneMain Holdings the operating cash flow contains the interest margin before credit losses; at Fidelity National Financial it is policyholder deposits. The underlying rule is always the same: where the core business sits in investing activities, operating cash flow measures throughput, not profit.
The numbers over the years — fairly credited
After two sections criticizing our own metric, a correction is due: XP is a profitable, growing company. That is the part the broken number actually obscures.
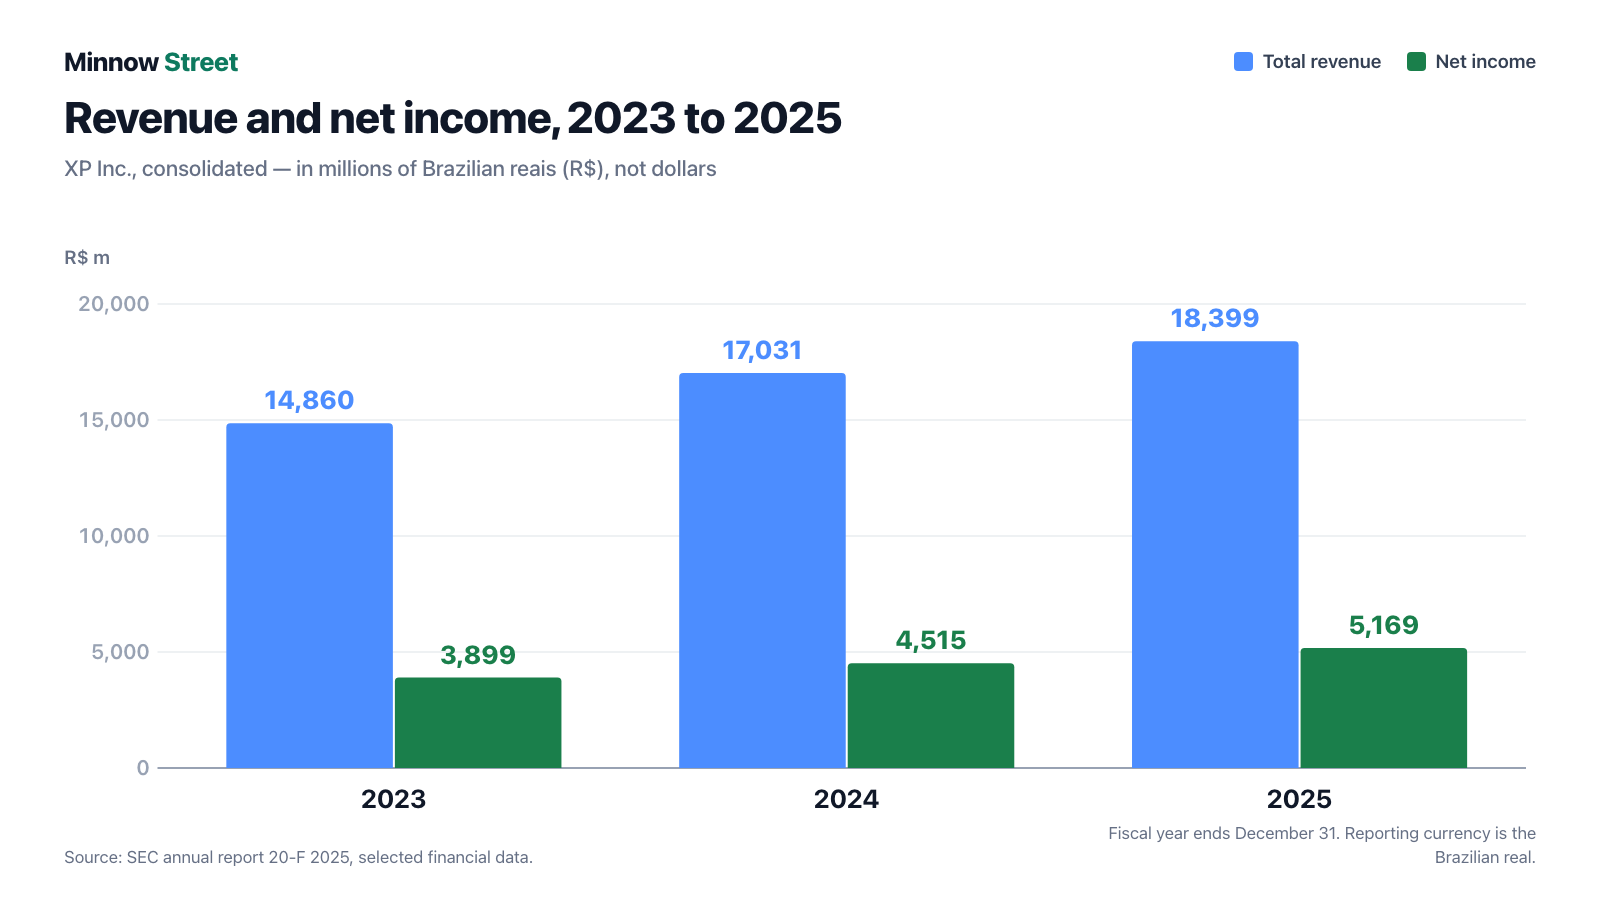
Revenue rose 8 percent in 2025 to R$18,399 million, net income 14 percent to R$5,169 million. The net margin stands at 28.1 percent — a strong figure for a financial services group. Earnings per share came to R$9.80.
Revenue in 2025 splits as follows: retail R$14,584 million, corporate and issuer services R$2,733 million, institutional R$1,373 million, other R$743 million. The business clearly stands on its retail leg.
But the momentum is fading. Net inflow of new client money fell from R$104.9 billion in 2023 and R$108.8 billion in 2024 to R$94.3 billion in 2025. And the take rate — the share XP earns on assets under custody — slipped from 1.29 to 1.25 percent. Client assets grew about 16 percent, revenue only 8. That gap is the real question for the coming years.
Uncomfortable truth no. 3: ten votes per share
XP has two classes of shares. What trades on Nasdaq are the Class A shares — one share, one vote. Alongside them sit Class B shares, which do not trade and carry ten votes each.
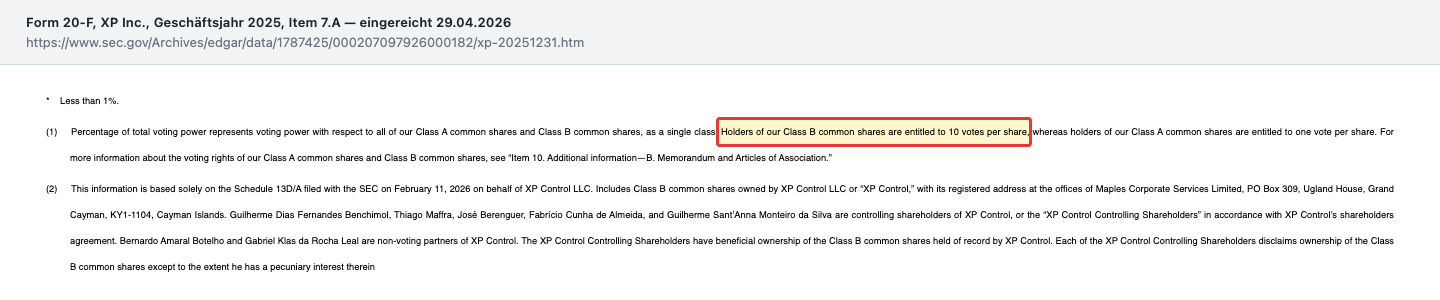
Directors and executive officers — 13 people — together hold all Class B shares and therefore 71.09 percent of the voting power. They are bundled in a vehicle called XP Control LLC.
That is not automatically bad: founder-controlled companies can sustain uncomfortable investments that a quarter-driven shareholder meeting would strangle. But it shifts the question of power. Buying Class A stock buys a share of the profits, not influence. On a takeover offer, a capital increase or a dispute about the dividend, the founder group decides alone.
Valuation: what you get for your money
For orders of magnitude — all figures as of July 24 to 27, 2026, no daily prices: the market capitalization is around $8.3 billion. Equity stood at R$23,548 million on December 31, 2025, roughly $4.3 billion. That puts the price-to-book ratio in the region of 1.9. The price-to-earnings ratio is around 8.5.
On the balance sheet. Total assets at year end were R$396,528 million against equity of R$23,548 million. The equity ratio is therefore 5.9 percent. That sounds thin, but for a broker and banking group it is normal: most of the balance sheet consists of client positions passing through, not proprietary bets.
Why we quote no Altman Z here. The Altman Z score estimates distress risk and was developed for industrial companies. It sets working capital, retained earnings and sales against total assets — quantities that mean something entirely different at a bank. Our data set carries a value of 2.72 for XP, which on the relevant scale would sit between the 1.1 and 2.6 thresholds. We deliberately do not use it, because it says nothing about this business model. Anyone judging XP's stability should look at the equity ratio, client assets, net inflow, and the question of how stable the take rate stays.
Opportunities and risks at a glance
What speaks for XP:
- A profitable, growing core business: net income of R$5,169 million in 2025, a net margin of 28.1 percent.
- Market position as Brazil's largest independent platform, with R$1,491 billion in client assets and 4.76 million active clients (December 31, 2025).
- A broad revenue base across commissions, net interest income, asset management, cards and lending — not dependent on a single fee.
- A valuation that is not expensive even on a single-currency basis: a price-to-earnings ratio around 8.5 with double-digit earnings growth.
What speaks against it:
- The hook does not hold: the displayed price-to-cash-flow ratio of 0.6 is a currency error; calculated cleanly it is about 3.0.
- Even adjusted, the metric measures client money rather than distributable surplus — the denominator changed sign twice during 2025.
- Fading momentum: net inflow down from R$108.8 billion to R$94.3 billion, take rate down from 1.29 to 1.25 percent.
- No say: 71.09 percent of the voting power sits with 13 people, and Class B shares carry ten votes each.
- Currency and country risk: the business earns reais while the share is quoted in dollars. A weaker real depresses any dollar result regardless of operating performance.
A human conclusion
We started with the reflex: a small number read as a price. We deliberately demonstrated it on our own list, because that is where it is most dangerous — on a figure you trust because it came out of your own tool.
What is left once the 0.6 is cleared away? A solid Brazilian financial company with nearly R$5.2 billion in annual profit, a strong market position, slowing growth and an ownership structure that gives outsiders no voice. That is neither a bargain nor a scandal — it is an ordinary company at an ordinary price.
The real lesson, though, is not about XP but about the number in front of it: with any foreign-listed name, check that numerator and denominator speak the same currency. We have now found the same break in two Brazilian stocks. They are unlikely to be the only ones.
What you make of it is your decision. And that is exactly as it should be.
Sources
- XP Inc., SEC annual report on Form 20-F for 2025 (filed April 29, 2026) — Item 5.A exchange rate, Item 5.B cash flow, Item 6.D employees, Item 7.A voting rights, Note 2 reporting currency
- Interim reports on Form 6-K filed May 6, 18, 26 and 29, 2026
- Ownership filings SCHEDULE 13G/A (May 14, 2026) and SCHEDULE 13D/A (July 7, 2026), prospectus supplement 424B7 (July 2, 2026)
- Source: fundamental data & SEC filings (20-F/6-K), data as of July 24 to 27, 2026
- In-house stock scanner, price-to-free-cash-flow ranking, U.S. selection, measured July 27, 2026
This analysis is journalism and editorial context, not investment advice. It contains no buy or sell recommendation and is not a solicitation to buy or sell securities. Equity investments carry the risk of total loss. All figures come from the sources named above and carry the stated cut-off dates; metrics drawn from data sets can contain errors — this article demonstrates exactly that on one example. The author holds no position in the stock discussed at the time of publication.
Our Bottom Line at a Glance
- The hook does not hold negative
- The displayed price-to-free-cash-flow ratio of 0.6 comes from dividing a market capitalization in U.S. dollars ($8.29bn) by a cash flow in Brazilian reais (R$15,049m). Using the rate from the 20-F itself (R$5.502 per U.S. dollar, December 31, 2025), the ratio is about 3.0. Rank 10 in the U.S. selection is an artifact (measured July 27, 2026).
- The metric measures client money negative
- Even on a single-currency basis the denominator does not hold: in the 20-F for 2025 (Item 5.B) XP names securities balances, float balances and retirement plan balances as the key drivers of operating cash flow of R$12,045m. The figure was negative in two of four quarters in 2025.
- Operating business positive
- Revenue of R$18,399m (up 8 percent) and net income of R$5,169m (up 14 percent) in 2025, a net margin of 28.1 percent and earnings per share of R$9.80. Brazil's largest independent investment platform with R$1,491bn in client assets (December 31, 2025).
- Fading momentum neutral
- Net inflow fell from R$108.8bn (2024) to R$94.3bn (2025) and the take rate from 1.29 to 1.25 percent. Client assets grew about 16 percent while revenue grew only 8 percent — that gap is the open question for the coming years.
- Voice and balance sheet neutral
- Class B shares carry ten votes; directors and executive officers hold 71.09 percent of the voting power (20-F 2025, Item 7.A). The equity ratio is 5.9 percent (equity R$23,548m against total assets of R$396,528m) — normal for a broker and banking group, but no cushion for surprises.
XP is a profitable, growing financial company with a strong position in Brazil — but the reason it sits near the top of our list does not survive recalculation. The displayed price-to-cash-flow ratio of 0.6 mixes U.S. dollars and Brazilian reais; in a single currency it is about 3.0. And even then the metric measures client money rather than distributable surplus. Buying XP means buying an ordinary company at an ordinary price — not the bargain the number promises. Not investment advice.
What Our Rating Means
Open questions
The business works in principle, but one material question is open. As long as it stays open, our findings do not carry a quality verdict.
The core business holds up: revenue of R$18,399 million and net income of R$5,169 million in 2025, a net margin of 28.1 percent, R$1,491 billion in client assets under custody and 4.76 million active clients. Nothing supports red: no loss, no going-concern doubt, no regulatory question, no filing backlog. Three things rule out green. First, momentum: net inflow fell for a second year to R$94.3 billion and the take rate from 1.29 to 1.25 percent — client assets grew about 16 percent while revenue grew only 8 percent. Second, voice: Class B shares carry ten votes and 71.09 percent of the voting power sits with 13 people; outside shareholders decide nothing on a takeover, a capital increase or the dividend. Third, currency and country risk: the business earns reais while the share is quoted in dollars, so a weaker real depresses any dollar result regardless of operating performance. And the hook on our own list does not hold: the displayed ratio of 0.6 is a currency error, about 3.0 when calculated cleanly.
A journalistic assessment by our editorial team at the time of the deep dive, based on public sources — not investment advice and not a solicitation to buy or sell. Your personal circumstances (investment goals, risk capacity, taxes) cannot be taken into account. What our levels mean, how verdicts are formed, and what conflicts of interest exist →
Worth Noting
- Hook: in-house stock scanner, price-to-free-cash-flow ranking, U.S. selection (545 hits), rank 10 at a displayed value of 0.6 — measured July 27, 2026, identically on both brands. The lists are recalculated daily.
- All income and balance sheet figures are in Brazilian reais (reporting currency per 20-F 2025, Note 2), the market capitalization in U.S. dollars. The two are never mixed in this article; wherever a conversion is made, the rate of R$5.502 per U.S. dollar (Central Bank, December 31, 2025) is stated alongside it.
- No Altman Z as a solvency verdict: the formula is built for industrial companies and says nothing meaningful about a broker and banking group. Our data set carries 2.72; the value is deliberately not used.
- Risk of confusion: XP Inc. (Cayman Islands, Nasdaq: XP) is not its Brazilian subsidiary XP Investimentos S.A., nor the operating entity XP CCTVM, which is reported separately in the annual report.
Frequently Asked Questions
Because the metric mixes two currencies. The market capitalization is in U.S. dollars (about $8.29 billion), the free cash flow in Brazilian reais (R$15,049 million). Put both in the same currency and the ratio is about 3.0 rather than 0.6. Rank 10 is an artifact of the conversion.
Brazilian reais. The annual report on Form 20-F for 2025 states in Note 2 that the real is the functional and presentation currency of the group. The share itself trades in U.S. dollars on Nasdaq. That split is what produces the error in the metric.
Because client money runs through it. In its annual report XP itself names securities balances, float balances and retirement plan balances as the key drivers of the R$12,045 million operating cash flow reported for 2025. Those balances swing hard: in 2025 the figure was negative in two quarters and above R$12,000 million in another.
No. The U.S. securities regulator, the SEC, classifies XP as a foreign private issuer, so it files an annual report on Form 20-F and interim reports on Form 6-K. The Forms 10-K and 10-Q familiar from U.S. domestic filers do not exist for XP.
Little. The Class A shares traded on Nasdaq carry one vote each; the unlisted Class B shares carry ten. Directors and executive officers together hold all Class B shares and therefore 71.09 percent of the voting power (20-F 2025, Item 7.A).
Yes, but more slowly. Revenue rose 8 percent in 2025 to R$18,399 million and net income 14 percent to R$5,169 million. Net inflow of new client money, however, fell from R$108.8 billion in 2024 to R$94.3 billion, and the take rate slipped from 1.29 to 1.25 percent.
Because the formula was developed for industrial companies and says little about banks and brokers. It sets working capital and sales against total assets — quantities that mean something different at a platform carrying client positions. The equity ratio, client assets and net inflow are far more informative.
At least one more: the StoneCo analysis also carries a price-to-cash-flow ratio that sets a dollar market capitalization against a real-denominated cash flow. Foreign issuers listed in New York that do not report in dollars are the group at risk. How many names are affected in total has not yet been measured.
Found an error?
Did you spot a factual error, an outdated number, or a typo in this deep dive? Let us know briefly — your report goes straight to the editorial team.