StoneCo: A P/FCF of 1.1 — and Two Different Currencies
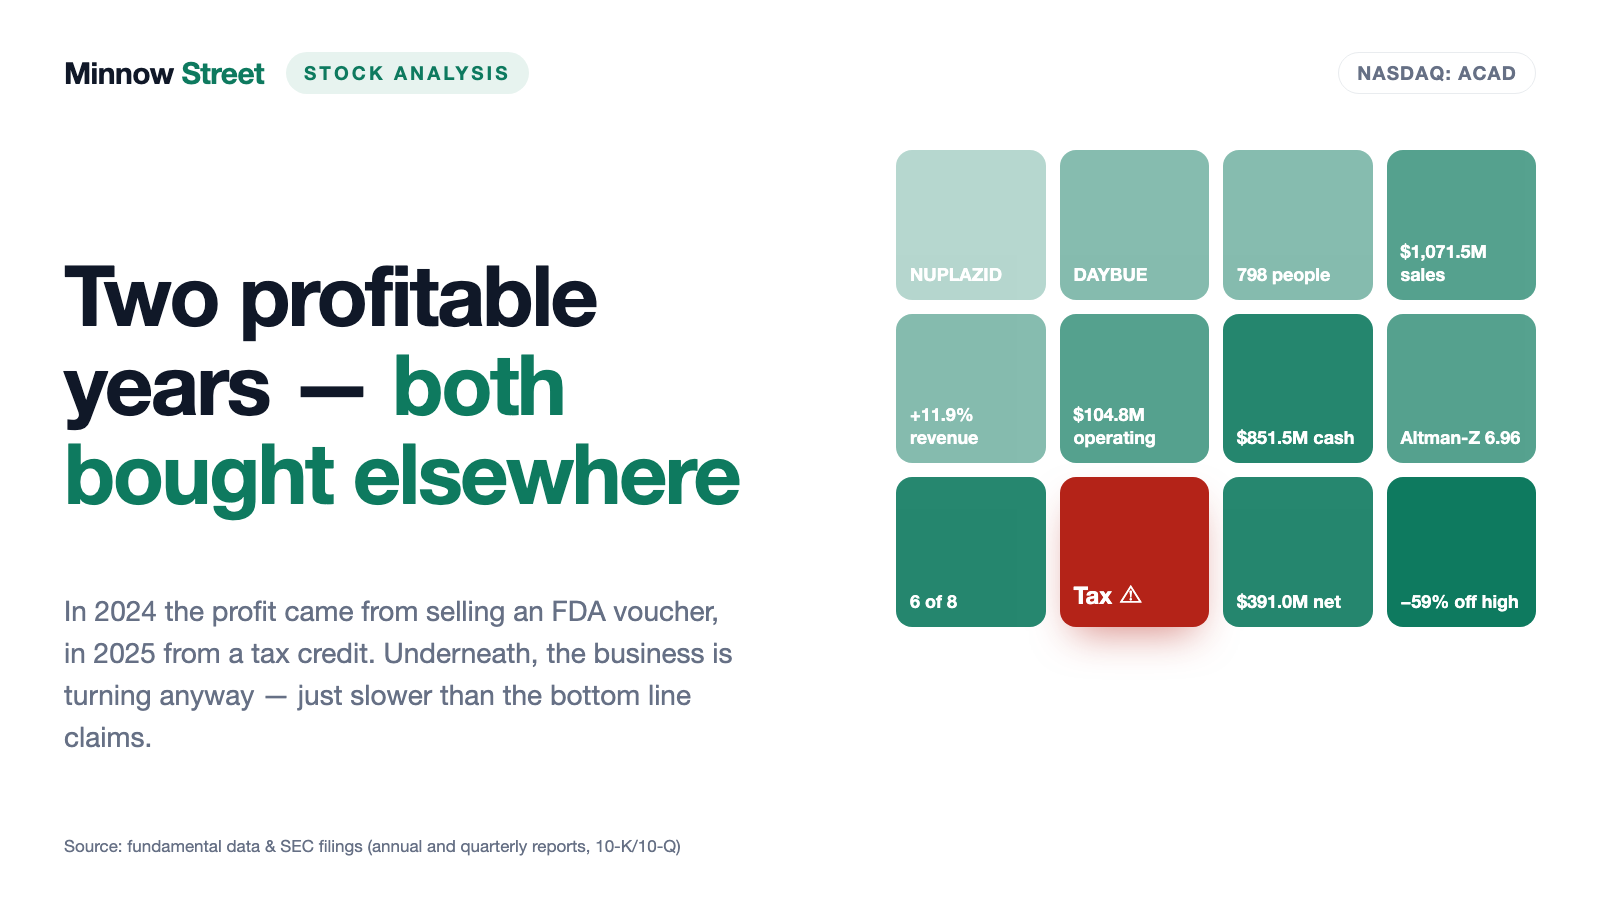
On July 27, 2026, StoneCo sat at No. 20 in the U.S. selection of our in-house P/FCF ranking. The value shown is 1.1 — and it comes from a division whose numerator is in U.S. dollars and whose denominator is in Brazilian reais. We put both sides into the same currency, open the cash flow statement in the annual report and trace which lines that cash inflow actually comes from. What remains is still a low number — and a question no ranking answers.
 Thomas Mücke
Founder & Publisher
Thomas Mücke
Founder & Publisher
Chart
Interactive price chart (TradingView).
Note: pure fact-based analysis, not investment advice and not a solicitation to buy or sell. All figures without guarantee.
The reflex that skips the currency
Picture yourself at a market stall in Salvador da Bahia. The sign reads 50. For the blink of an eye your head does the sum in dollars, and the price feels outrageous. Only afterwards does the unit arrive: reais. Suddenly it is a bargain.
That is not stupidity, that is wiring. Our brains process the number first and the unit second. And that reflex is exactly why metric rankings are so seductive: they hand you the number and skip the unit.
For StoneCo the number is 1.1. That is the price-to-free-cash-flow ratio in our own ranking, measured on July 27, 2026. Translated, it would mean this: the entire company costs about as much on the stock market as it generates in free cash in a single year. For a growing, profitable business that would be an exclamation mark.
So the deal for this article is simple. We do not accept the number. First we check which currency each side of the division is in. Then we open the cash flow statement and look for the lines that actually produce this inflow. What remains at the end is still a low figure — just a very different one from 1.1.
What StoneCo actually does
Think of a bakery in Recife, a hair salon in Belo Horizonte, a kiosk in São Paulo. All three need the same three things: a device that lets customers pay by card or phone, an account where the money lands, and in a bad month a loan that covers the rent. Those three things are what StoneCo sells — from a single hand.
Legally the group is a Cayman Islands holding company based in George Town; the business sits entirely in Brazil. Around 16,367 people worked there as of December 31, 2025, of whom 3,743 were at the software subsidiary Linx, since sold. The Nasdaq listing dates from October 25, 2018; before that the same SEC registrant was called DLP Payments Holdings Ltd.
What matters for everything that follows is what the revenue is made of. In the first quarter of 2026 the split looked like this, all figures in millions of Brazilian reais:
- Financial income: R$2,582.2 million — 72.2 percent of all revenue. At heart this is interest: StoneCo advances merchants their card receipts before the card issuers pay, and charges for it. On top come the interest earnings of its own credit book.
- Other financial income: R$262.5 million — interest on its own cash.
- Net revenue from transaction activities: R$481.4 million — the classic per-swipe fee.
- Subscription services and equipment rental: R$251.8 million — the terminals themselves.
That is the first surprise for anyone who files StoneCo under "payment processor": almost three quarters of revenue is interest income. Economically StoneCo sits closer to a bank for micro-entrepreneurs than to a hardware vendor. Anyone thinking about this stock is thinking about a credit book, not about plastic boxes.
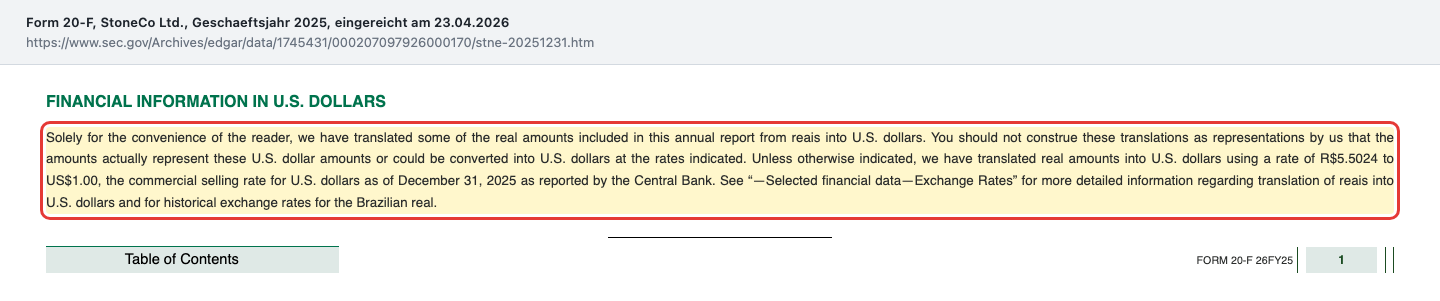
One more thing belongs at the very start, because it colors every figure that follows: the books are kept in Brazilian reais, the shares trade in U.S. dollars. The annual report says so in a single sentence.
"Unless otherwise indicated, we have translated real amounts into U.S. dollars using a rate of R$5.5024 to US$1.00, the commercial selling rate for U.S. dollars as of December 31, 2025 as reported by the Central Bank."
— StoneCo Ltd., Form 20-F for fiscal 2025, "Financial information in U.S. dollars"
A note on filing duties, because it comes up constantly below: the U.S. securities regulator, the SEC, treats StoneCo as a foreign private issuer. Such companies file an annual report on Form 20-F and report everything in between on Form 6-K. There is no quarterly report on Form 10-Q — the quarterly numbers arrive as exhibits to the 6-K filings. Searching for "StoneCo 10-Q" is a dead end.
How the stock landed on our desk
StoneCo did not reach our list through a headline but through a sort order. Our in-house stock scanner, the P/FCF ranking, collects every stock with positive free cash flow and a price-to-free-cash-flow ratio of at most 10 and sorts them ascending — the arithmetically cheapest first.
Here is the snapshot, measured on the live page on July 27, 2026 (list computed July 26, 2026):
- No. 20 in the U.S. selection at a displayed value of 1.1
- 544 stocks passed the criteria in the English list that day
- The page shows the 25 strongest rows per market selection
To repeat it yourself: open the "Stocks" section, choose "Scanner", pick the P/FCF ranking, set the market filter to the United States and look for the STNE row. These lists are recomputed daily. No. 20 is a dated snapshot from July 27, 2026, not a permanent state.
What does the metric even measure? Market value divided by free cash flow over the trailing four quarters. Free cash flow is what is left after all investment — in theory the money available for dividends, buybacks or debt reduction. A value of 10 means ten years of that inflow equal today's price. A value of 1.1 would mean a little over one year.
Now the first cross-check. The market value comes from market data and is denominated in U.S. dollars. The cash flow comes from the cash flow statement and is denominated in Brazilian reais. The division therefore mixes two currencies. Put both sides into the same currency — using the rate StoneCo names in its own annual report, R$4.965 per U.S. dollar as of April 22, 2026 — and roughly $2.6 billion of market value becomes about R$13.0 billion. Divided by the R$2,402.6 million of free cash flow across those four quarters, that is a ratio of roughly 5.4.
Remember the sentence: a ratio is only as good as the unit both of its sides stand in. A value of 5.4 is still low. But it is a different finding from 1.1 — and the gap is not an arithmetic error of this analysis, it is the difference between two currencies.
That does not settle the matter, though. The second question is what the denominator is made of. For a payment company with its own credit book that is anything but academic. That is where we go next.
One more framing point: a metric ranking is not a quality verdict. It sorts the universe by a single measure. Whether that measure delivers what it promises is decided by the annual report, not by the list. We ran the same check on another name from the same list — a consumer lender whose cash flow likewise comes out of a loan book: our analysis of Oportun Financial shows the same pattern in a different currency.
The numbers over the years — fairly credited
Let us start with what StoneCo genuinely does well. This company grows, and it earns money while doing it — three years running.
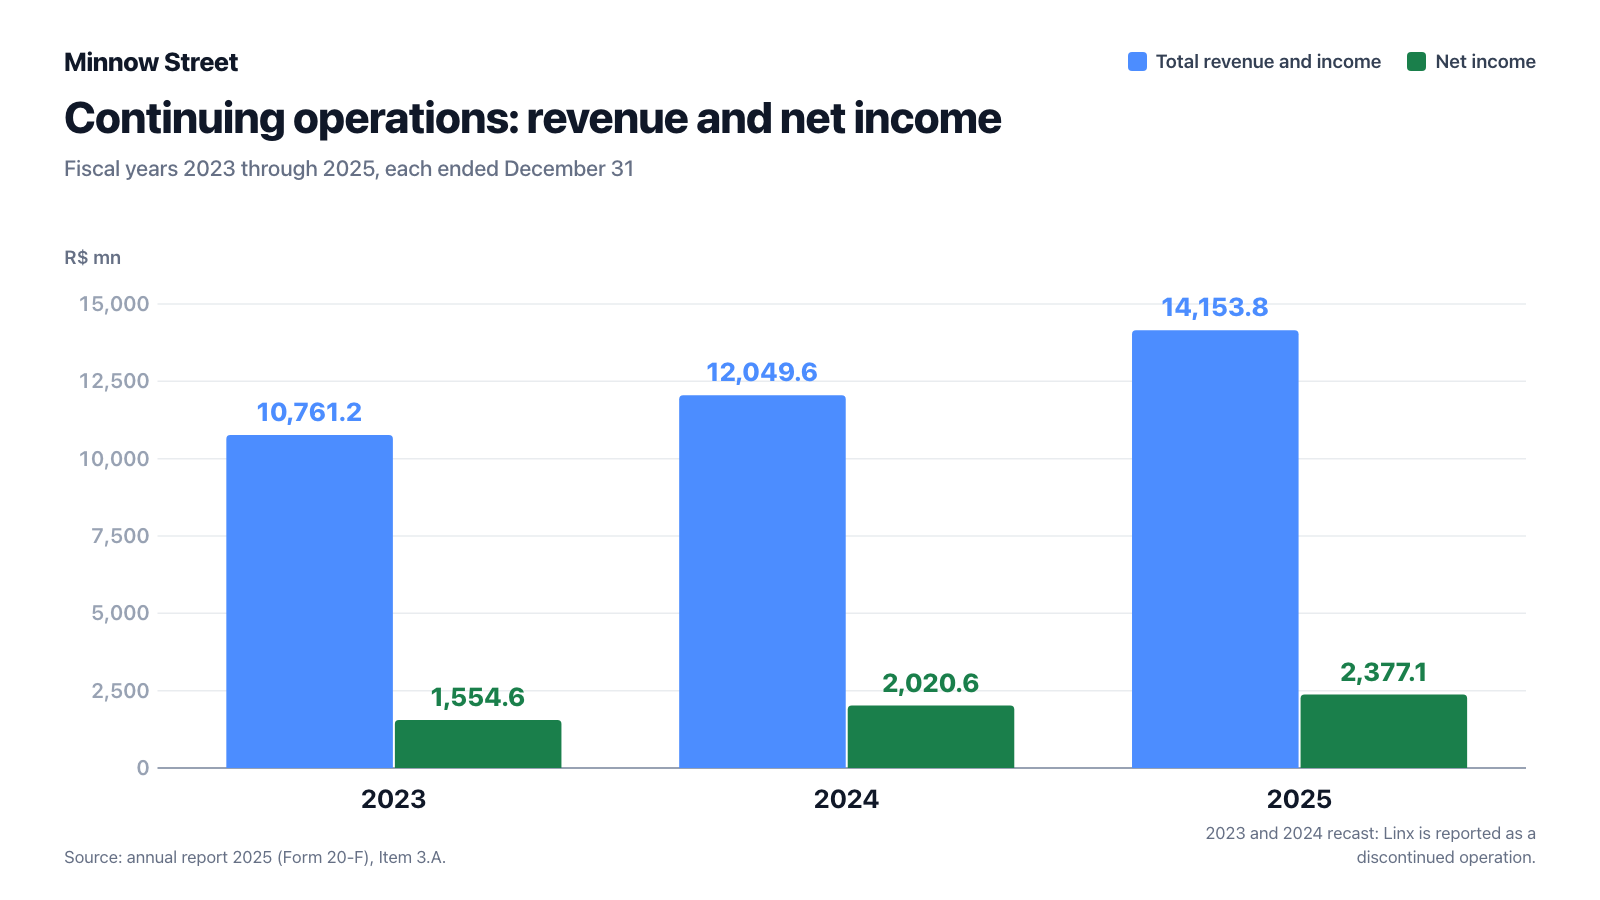
The detail, all from continuing operations and therefore excluding the divested software business. StoneCo recast 2023 and 2024 for that purpose, because Linx has counted as a discontinued operation since the second quarter of 2025 — both prior years are explicitly labeled "Recast" in the annual report:
- Total revenue and income: R$10,761.2 million (2023), R$12,049.6 million (2024), R$14,153.8 million (2025)
- Net income: R$1,554.6 million, R$2,020.6 million, R$2,377.1 million
- Basic earnings per share: R$4.96, R$6.68, R$8.85
- Total payment volume: R$438.3 billion, R$516.2 billion, R$560.9 billion
- Active payment clients: 3,522.1 thousand, 4,172.7 thousand, 4,803.5 thousand
What stands out is how much faster earnings per share climbed: up 78 percent in two years while net income rose 53 percent. The difference is not an accounting trick but share repurchases. In 2025 StoneCo bought back R$3.0 billion of its own stock and cut the share count by 40.3 million. Translated: your slice of the pie grows because the company takes slices out of circulation.
The balance sheet is no construction site either. As of March 31, 2026 total equity stood at R$12,282.7 million, and the company's own adjusted net cash figure — a non-IFRS measure that sets cash, short-term investments and receivables from card issuers against deposits and debt — came to R$4,939.1 million, up from R$2,588.1 million at year-end 2025. Return on equity was 18.6 percent in the first quarter of 2026.
And the growth has not stopped. The credit unit, discussed at length below, lifted its revenue from R$103.8 million to R$297.1 million within a year — up 186.2 percent. Instant-payment volume over Brazil's central bank standard Pix grew 37.3 percent to R$27.4 billion per quarter inside the payments business.
Now the other side of the same coin. It is uncomfortable, and it is more than one point.
What the filings say
Uncomfortable truth No. 1: free cash flow in fiscal 2025 was negative
The ranking says 1.1 years of free cash flow. The annual report says something else. For fiscal 2025 StoneCo reports operating cash inflow of R$676.6 million. Capital expenditure in the same year came to R$1,188.6 million — R$705.6 million on property and equipment and R$483.0 million on internally developed software. Subtract one from the other and what remains is a shortfall of about R$512 million.
The year before was worse: in 2024, operating activities consumed R$3,621.4 million. In 2023 they produced R$1,647.7 million. Three years, three completely different signs and magnitudes — for a business whose revenue grew steadily throughout.
How does that square with the value of 1.1? Simply: the ranking does not use the calendar year but the last four reported quarters. And that window contains an outlier.
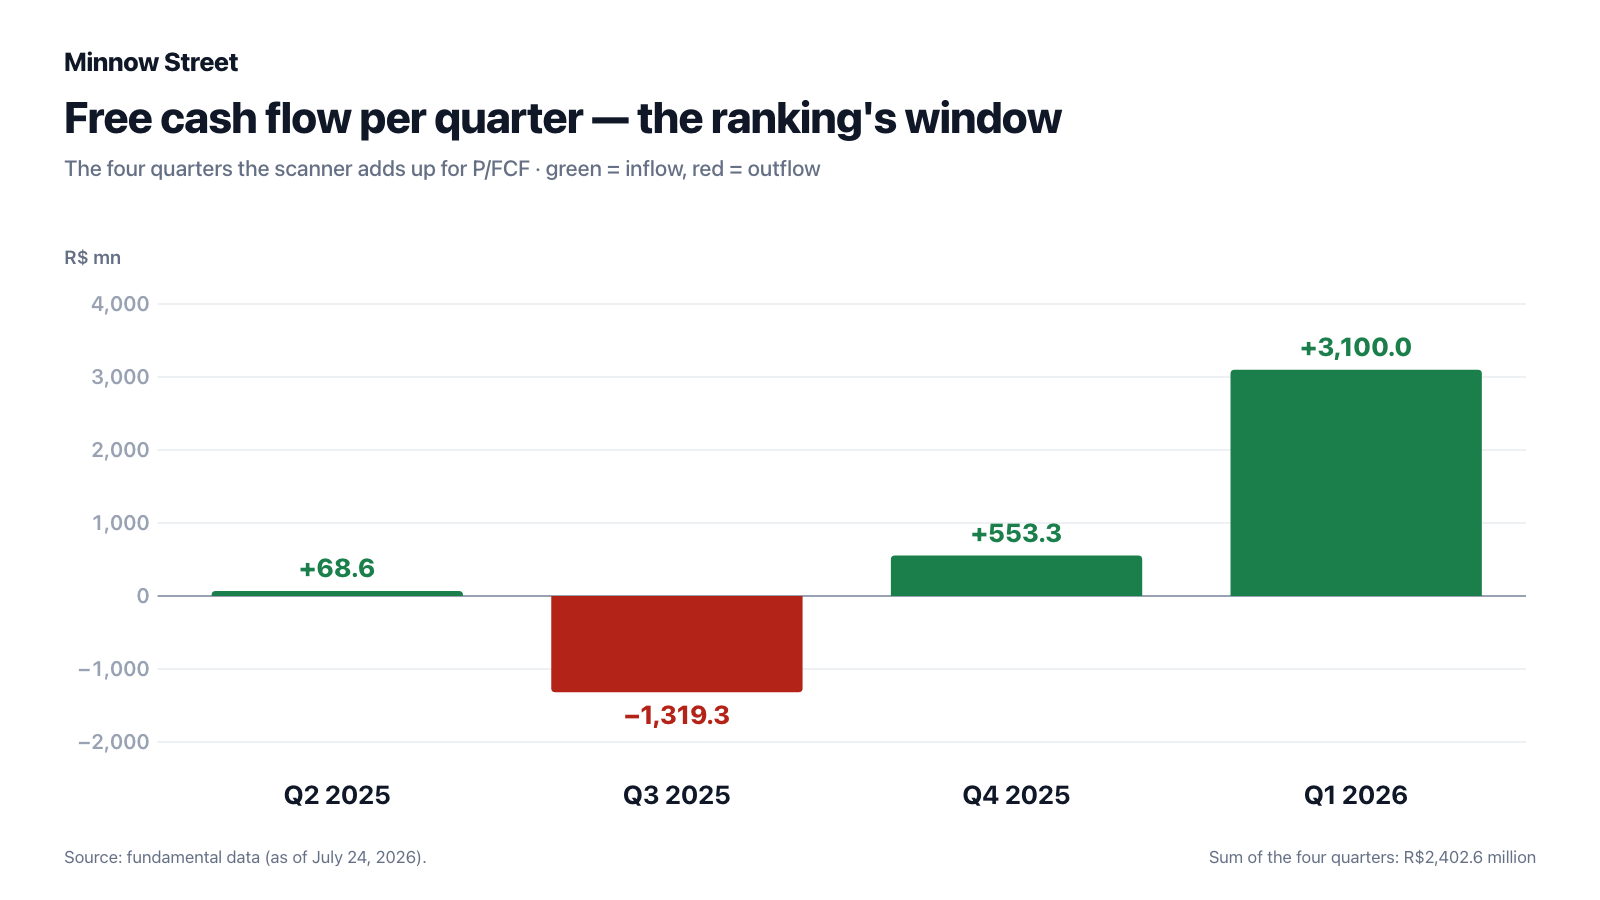
The four quarters in the window: plus R$68.6 million (Q2 2025), minus R$1,319.3 million (Q3 2025), plus R$553.3 million (Q4 2025) and plus R$3,100.0 million (Q1 2026). That sums to R$2,402.6 million — and without the last quarter the sum would be negative. The entire hook of this analysis hangs on one three-month period.
Uncomfortable truth No. 2: that one quarter is a settlement effect
Look closer at the first quarter of 2026. Operating cash inflow was R$3,343.3 million per the interim report, against R$624.3 million a year earlier. Where does the jump come from? The cash flow statement names the lines:
- Accounts receivable from card issuers: plus R$3,901.1 million. The balance shrank from R$41,275.2 million to R$37,843.3 million, releasing cash.
- Accounts payable to clients: minus R$2,645.3 million. The counter-move.
- Interest income received, net of costs: plus R$1,890.8 million.
- Interest paid: minus R$427.5 million.
Without that single receivables line, operating cash flow for the quarter would have been negative. What appears here as cash flow is the movement of a settlement book: money that travels back and forth between card issuers, StoneCo and merchants anyway. It is not earned profit; it is a snapshot of the moment the quarterly clock stops.
None of this has to be inferred — StoneCo writes it into the annual report itself, and remarkably plainly:
"Sale of receivables: the sale of receivables results in the derecognition of our Accounts Receivable from Card Issuers. As a result, when a prepayment operation is funded through the true sale of receivables, both Accounts Receivable from Card Issuers and Accounts Payable to Clients are derecognized from our balance sheet in the same amount and the combined effect to our cash flows is a positive operational cash flow equivalent to our net fees earned by providing such prepayment service."
— StoneCo Ltd., Form 20-F for fiscal 2025, Item 5.B, note on the impact of different funding sources
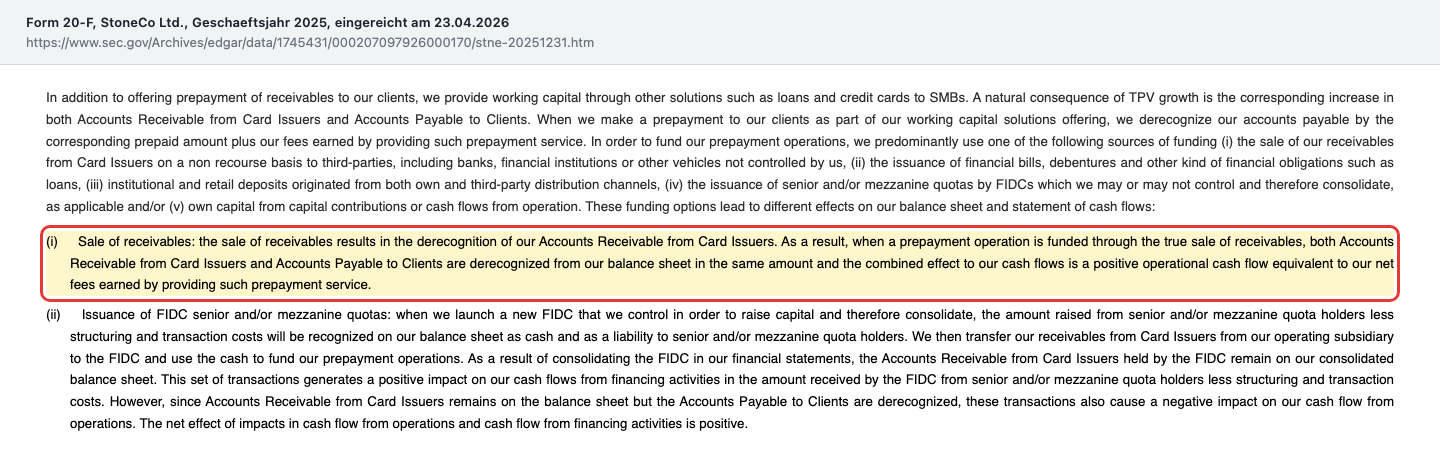
Further down the same passage sits the mirror case: if StoneCo funds prepayment from its own capital, the receivables stay on the balance sheet, the payables disappear — and operating cash flow turns negative. Same business, same margin, opposite sign in the metric.
The takeaway: for a prepayment business, operating cash flow measures the funding choice, not the earnings power. Valuing StoneCo on cash flow means valuing a treasury decision.
Uncomfortable truth No. 3: the credit book grows faster than its quality
The most exciting story at StoneCo is also the riskiest. Since 2023 the group has been rebuilding its own credit book — working capital loans and credit cards for the very merchants whose card receipts it already sees. That is a strong argument: hardly anyone knows a kiosk's turnover better than the company that settles it.
The figures as of March 31, 2026 show both sides:
- Credit portfolio: R$3,224.9 million — up 122.5 percent within twelve months
- Credit revenue in the quarter: R$297.1 million — up 186.2 percent
- Average monthly interest rate: 3.3 percent, after 2.6 percent a year earlier
- Loan loss provisions in the quarter: R$166.3 million — up 389.2 percent
- Cost of risk: 21.9 percent, after 10.2 percent
- More than 90 days past due: 6.98 percent, after 4.57 percent
- 15 to 90 days past due: 4.97 percent, after 2.61 percent
Both delinquency ratios roughly doubled or rose by half within twelve months — in a portfolio that more than doubled in size at the same time. Young loans rarely default early; when the ratio rises despite heavy dilution from new lending, that is a serious signal. Management itself cites additional defaults among larger clients and "early signs of weaker performance in newer vintages".
The annual report is equally blunt on this point:
"As of December 31, 2025, our credit portfolio amounted to R$2,836 million with provisions for expected credit losses totaling R$389.7 million, compared with a credit portfolio of R$1,207.6 million and expected credit losses of R$144.5 as of December 31, 2024."
— StoneCo Ltd., Form 20-F for fiscal 2025, Item 3.D, credit risk factor
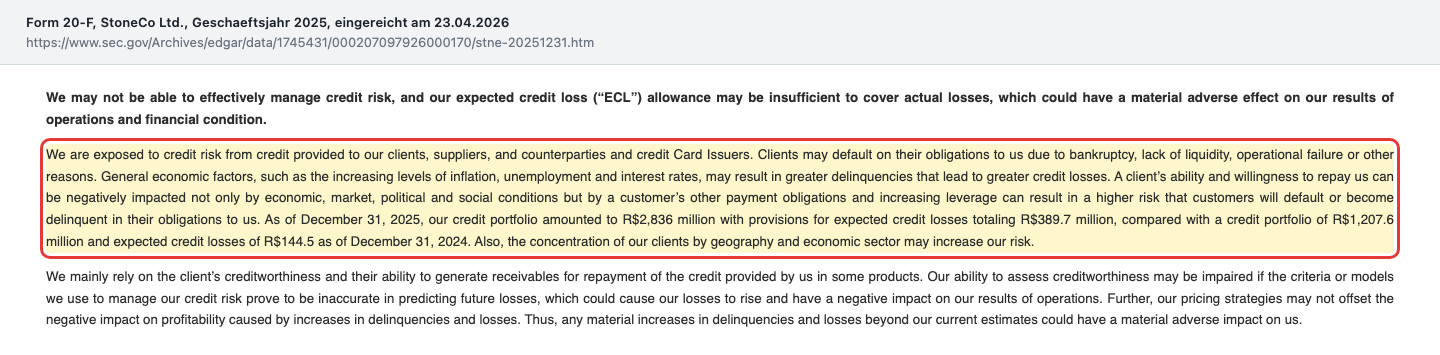
The effect is already visible in the income statement: adjusted gross margin fell from 44.4 percent in the first quarter of 2025 to 41.6 percent in the first quarter of 2026. Adjusted gross profit stagnated at R$1,487.8 million even though revenue rose 6.5 percent. The growth arrives, but it arrives at a higher price.
Uncomfortable truth No. 4: last quarter's headline number is not an operating result
Skim the interim report and you read basic earnings of R$7.17 per share, against R$1.83 a year earlier. That would be a quadrupling. Adjusted earnings for the same period, however, are R$2.19.
The difference is a one-time tax effect. Following an internal restructuring, StoneCo may amortize the goodwill from the Linx acquisition for tax purposes. Under IFRS the entire future benefit was recognized in the income statement at once:
"Income tax and social contribution was a gain of R$1,153.3 million. This can be explained by a non recurring gain of R$1,242.6 million from the recognition of Deferred Tax Assets related to the goodwill from the Linx acquisition."
— StoneCo Ltd., Form 6-K of May 14, 2026, 1Q26 earnings release

To be fair: StoneCo discloses the effect, strips it out of its adjusted figures and explains it in a dedicated table. Anyone reading only the headline has themselves to blame — but plenty of data vendors read exactly that headline. It is one reason why market data carry an earnings-per-share figure with little connection to the operating trend.
Uncomfortable truth No. 5: the priciest buyback tranche was the most recent one
Buybacks are not a side show at StoneCo but stated capital policy. Four programs have been completed since September 2023. The annual report prints the average prices:
- September 2023: 5,733,740 shares at $10.31
- November 2023: 13,202,939 shares at $13.52
- November 2024: 29,305,630 shares at $9.56
- May 2025: 21,871,991 shares at $16.34 ($357.3 million)
The most recently completed tranche was therefore by far the most expensive — some 71 percent above the average price of the preceding program. Buybacks only create value below intrinsic value; above it they redistribute from the holders who stay to the ones who sell. As a dated anchor for comparison: the closing price on July 24, 2026 was $10.76, and shareholders received a $2.53 per share extraordinary dividend on May 4, 2026.
The successor program of R$2.0 billion approved in December 2025 had not been drawn on as of December 31, 2025.
Valuation — same stock, two currencies
Start with the anchor, cleanly separated by currency. On July 24, 2026 the stock closed at $10.76. As of March 31, 2026 there were 229,177,062 Class A shares and 14,051,164 Class B shares outstanding, 243.2 million in total. That gives a market value of roughly $2.6 billion.
Now the other side, in reais: net income from continuing operations came to R$2,377.1 million in 2025. To compare the two, one side has to change currency. We take the rate StoneCo itself names — R$4.965 per U.S. dollar as of April 22, 2026 — and convert the market value into reais: about R$13.0 billion.
That produces the following, all figures in one currency:
- Price-to-earnings: roughly 5.5 (R$13.0 billion of market value against R$2,377.1 million of 2025 profit)
- Price-to-free-cash-flow: roughly 5.4 (against R$2,402.6 million over the trailing four quarters) — without answering whether that inflow recurs
- Price-to-sales: roughly 0.9 (against R$14,153.8 million of 2025 revenue)
- Price-to-book: roughly 1.1 (against R$12,282.7 million of equity as of March 31, 2026)
That is the honest order of magnitude: a single-digit price-to-earnings ratio and roughly book value. For a company that has raised revenue and profit three years running, that is not expensive. But it is also not the price tag the ranking displays.
Why does the market pay so little? There are two serious answers. The first is Brazil: the SELIC policy rate peaked at 15.0 percent on June 18, 2025 and stood at 14.75 percent at the date of the annual report on April 23, 2026. The real depreciated 21.8 percent in 2024 and appreciated 12.5 percent in 2025. Anyone accounting in dollars carries that swing without a single thing changing in the business.
The second answer is competition, and it comes from an unusual direction. The fiercest competitor is not a company but the Brazilian central bank: its free instant-payment standard Pix has become the preferred alternative to debit and prepaid cards since 2020. The annual report carries Pix as a standalone risk factor and notes that the extensions "Pix Parcelado" (installments) and "Pix Automático" (recurring payments) may put the credit card business under pressure too. Add Nubank, PagSeguro, Mercado Pago and the big banks — the filing calls the market "highly competitive" in as many words.
The professionals nonetheless take a friendly view: 14 analysts cover the stock, ten at the highest and three at the second-highest rating, one neutral. The average price target sits at roughly $16.09 (as of July 24, 2026). The currency rule applies here as well: the target is in dollars, the earnings behind it in reais, and between them sits an exchange rate no analyst steers.
To see how the same questions look at an established payment processor, the comparison is in our analysis of FIS — there the currency is uniform, but the question about the quality of cash flow is identical.
Opportunities and risks at a glance
What speaks for StoneCo
- Three consecutive years of rising revenue and profit from continuing operations: R$10,761.2 million to R$12,049.6 million to R$14,153.8 million of revenue, R$1,554.6 million to R$2,020.6 million to R$2,377.1 million of profit.
- Earnings per share growing faster than profit thanks to buybacks: R$4.96 to R$6.68 to R$8.85.
- Heavy capital returns: R$3.0 billion of repurchases in 2025 and a $2.53 per share extraordinary dividend on May 4, 2026.
- A focused business after the sale of Linx and SimplesVet — the group has reported as a single operating segment since the third quarter of 2025.
- Adjusted net cash of R$4,939.1 million as of March 31, 2026 and a return on equity of 18.6 percent in the first quarter of 2026.
- A lending business with a structural information advantage: StoneCo sees the card receipts of its own borrowers.
What speaks against it
- Free cash flow in fiscal 2025 was negative; the trailing twelve-month figure underpinning the ranking comes almost entirely from one quarter.
- Delinquency in the young credit book is rising fast: more than 90 days past due from 4.57 percent to 6.98 percent, cost of risk from 10.2 percent to 21.9 percent within twelve months.
- Adjusted gross margin fell from 44.4 percent to 41.6 percent; adjusted gross profit is flat despite revenue growth.
- Total payment volume grew only 2.7 percent in the first quarter of 2026 and card volume actually shrank 3.3 percent. The active client base fell 4.8 percent from the previous quarter.
- Pix is a free competitor operated by the central bank that no company can undercut — and it is pushing into credit card territory with installments and recurring payments.
- Currency and rate risk: the books are in reais, the shares trade in dollars. Any metric mixing the two is misleading, the ranking included.
- Two share classes: André Street holds 100 percent of the Class B shares and therefore 39.45 percent of the voting power on 7.97 percent of the equity (as of March 31, 2026).
A human conclusion
Back to the market stall in Salvador. The sign said 50 — and the question was never whether 50 is a lot or a little. The question was: 50 what?
For StoneCo the ranking says 1.1. The honest answer is roughly 5.4, as soon as both sides of the division stand in the same currency. And even that 5.4 rests on a quarter in which a settlement book drained, not on a year in which money was earned. Across full-year 2025, nothing was left after investment.
That does not make StoneCo a bad company — quite the opposite. Here a profitable business is growing with a genuine advantage over any bank: whoever settles a merchant's till knows before anyone else whether that merchant can repay a loan. StoneCo is expanding exactly that advantage, aggressively. Whether it works out will not be decided by a ranking but by one line in the next interim report: the share of loans more than 90 days past due. It last stood at 6.98 percent and has risen four quarters in a row.
Nothing in this article was hidden by the company. It was all in the filings — the currency rule on page 1, the cash flow mechanics in the management discussion, the delinquency ratios in the quarterly table. What was missing was the unit behind the number.
What you make of that is your decision. And that is exactly as it should be.
Sources
- Form 20-F for fiscal year 2025, StoneCo Ltd., CIK 0001745431, filed April 23, 2026 (Item 3.A selected financial data, Item 3.D risk factors, Item 5.B liquidity and cash flows, Item 6.D employees, Item 7.A major shareholders, Item 16E issuer purchases of equity securities)
- Form 6-K of May 14, 2026, earnings release for the first quarter of 2026 (latest periodic report) — metrics, credit tables, cash flow statement, balance sheet and the IFRS-to-adjusted reconciliation
- Form 6-K of April 14, 2026 — extraordinary dividend of $2.53 per share, roughly R$3.08 billion, paid May 4, 2026
- Form 6-K of February 27, 2026 — closing of the Linx sale after CADE clearance on February 20, 2026
- Form 6-K of January 7, 2026 — leadership change: Mateus Scherer becomes CEO from March 2026, Pedro Zinner moves to the board
- Form 6-K of December 22, 2025 — completion of the R$3 billion excess capital distribution and a new R$2 billion repurchase program
- Form 6-K of July 22, 2025 — announcement of the Linx sale to TOTVS (enterprise value R$3.05 billion plus net cash) and of SimplesVet to PetLove
- Screening and valuation data: our in-house stock scanner and fundamental data (as of July 24, 2026), including the P/FCF ranking — measured ourselves on July 27, 2026: 544 hits in the English list, 25 rows shown with the U.S. market filter, No. 20 among them at a ratio of 1.1; the list had last been computed on July 26, 2026
Journalistic analysis, not investment advice and not a solicitation to buy or sell securities. Stocks can go to zero; emerging market stocks carry additional currency and political risk. All business figures come from the SEC filings named above and are denominated in Brazilian reais, while all price and market-value figures are in U.S. dollars. The author holds no position in StoneCo Ltd. at the time of publication.
Our Bottom Line at a Glance
- Earnings power of the core business positive
- Revenue from continuing operations rose from R$10,761.2 million (2023) through R$12,049.6 million (2024) to R$14,153.8 million (2025), and net income from R$1,554.6 million to R$2,377.1 million. Total payment volume grew from R$438.3 billion to R$560.9 billion over the same period. Three consecutive years of rising revenue and rising profit are on the record (Form 20-F for 2025, Item 3.A).
- The hook and the data behind it neutral
- No. 20 in the U.S. selection of our in-house P/FCF ranking at a value of 1.1, measured ourselves on July 27, 2026 (544 hits in the English list, 25 rows shown, list computed July 26, 2026). The arithmetic is correct, but it measures a dollar market value against a real-denominated cash flow. In a single currency the ratio is roughly 5.4 — still low, but a different finding.
- Free cash flow negative
- In fiscal 2025, R$676.6 million of operating cash inflow faced R$1,188.6 million of capital expenditure; nothing was left free. In 2024 operating cash flow was clearly negative at minus R$3,621.4 million. The positive trailing twelve-month figure comes almost entirely from the first quarter of 2026, in which the accounts receivable from card issuers line alone released R$3,901.1 million (Form 20-F; Form 6-K of May 14, 2026).
- Credit quality negative
- The credit book grew 122.5 percent within twelve months to R$3,224.9 million as of March 31, 2026. Over the same period loans more than 90 days past due rose from 4.57 percent to 6.98 percent, loans 15 to 90 days past due from 2.61 percent to 4.97 percent, and the cost of risk from 10.2 percent to 21.9 percent. Management itself cites "early signs of weaker performance in newer vintages" (Form 6-K of May 14, 2026).
- Capital returns positive
- R$3.0 billion of shares were repurchased in 2025 and the share count fell by 40.3 million; over the twelve months to March 31, 2026 the figures were R$2.7 billion and 32.4 million shares. On top came an extraordinary dividend of $2.53 per share on May 4, 2026 (about R$3.08 billion). Measured against a market value of roughly $2.6 billion that is an unusually high payout rate (Form 20-F Item 16E; Form 6-K of April 14, 2026).
- Rates and currency neutral
- Brazil's SELIC policy rate peaked at 15.0 percent on June 18, 2025 and stood at 14.75 percent at the date of the annual report (April 23, 2026). High rates lift financial income, which at R$10,017.3 million was the largest revenue block in 2025, but they also raise funding costs and squeeze merchants. The real depreciated 21.8 percent in 2024 and appreciated 12.5 percent in 2025 (Form 20-F for 2025).
StoneCo is not a balance sheet problem, it is a measurement problem. The business grows, earns money and returns a lot of capital: R$14,153.8 million of revenue and R$2,377.1 million of profit from continuing operations in 2025, plus R$3.0 billion of buybacks and a $2.53 per share extraordinary dividend in May 2026. The ratio that lifts the stock to No. 20 in the P/FCF ranking, by contrast, is built from two currencies and one quarter: in a single currency it is roughly 5.4, and full-year 2025 free cash flow was negative. Anyone looking here should watch the delinquency rate of the young credit book rather than the ranking. Not investment advice.
What Our Rating Means
Open questions
The business works in principle, but one material question is open. As long as it stays open, our findings do not carry a quality verdict.
Amber stands for a healthy business with an unclear measurement. On the friendly side are three years of rising revenue and profit, adjusted net cash of R$4,939.1 million as of March 31, 2026, a return on equity of 18.6 percent in the first quarter of 2026 and capital returns that reached R$3.0 billion through buybacks in 2025 alone. Against a green rating stand facts that are equally documented: free cash flow for fiscal 2025 was negative, loans more than 90 days past due rose from 4.57 percent to 6.98 percent within twelve months, the cost of risk doubled to 21.9 percent, and adjusted gross margin fell from 44.4 percent to 41.6 percent. A red rating has no basis at all: there is no going-concern paragraph, no negative equity, no broken covenant. The decision is yours.
A journalistic assessment by our editorial team at the time of the deep dive, based on public sources — not investment advice and not a solicitation to buy or sell. Your personal circumstances (investment goals, risk capacity, taxes) cannot be taken into account. What our levels mean, how verdicts are formed, and what conflicts of interest exist →
Worth Noting
- Hook: in-house stock scanner, P/FCF ranking, U.S. selection No. 20 at a value of 1.1 — measured live on July 27, 2026, list computed July 26, 2026. The English list counted 544 hits and shows 25 rows. The lists are recomputed daily; the position is a snapshot, not a permanent state.
- Data as of: business figures from the Form 20-F for 2025 (filed April 23, 2026) and from the Form 6-K interim report for the quarter ended March 31, 2026 (filed May 14, 2026). Price and valuation data as of July 24, 2026. All business figures are in Brazilian reais, all price figures in U.S. dollars; nothing is converted except where explicitly stated.
- Do not confuse: StoneX Group Inc. (NASDAQ: SNEX) is a U.S. commodities and FX broker with no connection to StoneCo — the two sat five rows apart in the same ranking on July 27, 2026. Nor is this the former name of the same CIK, DLP Payments Holdings Ltd. (until August 29, 2018).
- Takeover check: there is no tender offer, no take-private and no merger agreement involving StoneCo. The live M&A event is a sale by StoneCo — Linx to TOTVS, closed February 27, 2026.
Frequently Asked Questions
Because the list divides market value by free cash flow over the trailing four quarters, and two things coincide. First, the market value is in U.S. dollars while the cash flow is in Brazilian reais. Second, the window includes the first quarter of 2026 with R$3,100.0 million of free cash flow — more than the previous three quarters combined. Together they produce the value of 1.1 shown on July 27, 2026.
StoneCo is a Cayman holding company with an entirely Brazilian business. Its functional and reporting currency is the Brazilian real, while the shares trade in U.S. dollars on Nasdaq. Market data therefore supply the market value in dollars and the cash flow statement in reais. Convert both sides using the R$4.965 per dollar rate as of April 22, 2026 that appears in the 20-F, and the ratio lands near 5.4 rather than 1.1.
The U.S. securities regulator, the SEC, treats StoneCo as a foreign private issuer. Such companies file an annual report on Form 20-F and report interim events on Form 6-K. A quarterly report on Form 10-Q does not apply to them. Quarterly figures therefore sit in the exhibits to the 6-K filings — for the first quarter of 2026 in the filing of May 14, 2026.
Because StoneCo prefunds card receipts. Between the moment a card is swiped and the moment the merchant is paid sit billions in accounts receivable from card issuers and accounts payable to clients. The annual report explains that the choice of funding alone decides whether the same business shows up in operating or financing cash flow. The annual figure swung from minus R$3,621.4 million in 2024 to plus R$1,647.7 million in 2023.
The sale to TOTVS closed on February 27, 2026 and brought R$3,090.4 million into the first quarter of 2026. On April 14, 2026 the board approved a one-time extraordinary dividend of $2.53 per share, paid on May 4, 2026, totaling roughly R$3.08 billion. The company states explicitly that this establishes no dividend policy.
It is the main growth engine and the largest uncertainty at once. The credit portfolio reached R$3,224.9 million as of March 31, 2026 and credit revenue R$297.1 million in the quarter. At the same time loan loss provisions rose to R$166.3 million and loans more than 90 days past due to 6.98 percent. Adjusted gross margin fell from 44.4 percent to 41.6 percent within a year.
No. Through July 27, 2026 the SEC record contains no tender offer, no merger agreement and no take-private proposal for StoneCo. The company's Form 425 filings all date from 2020 and belong to its own acquisition of Linx back then. The current business combination runs the other way: StoneCo sold Linx.
Found an error?
Did you spot a factual error, an outdated number, or a typo in this deep dive? Let us know briefly — your report goes straight to the editorial team.