Fidelity National Financial: The Vault Is Full — but the Money Belongs to Others
On paper Fidelity National Financial is one of the cheapest stocks in America: $13.9 billion of market value against $5.8 billion of free cash flow. Except most of that inflow is money belonging to policyholders and reinsurers — $888 million reached the holding company in 2025, and group cash actually shrank. We read the 2025 annual report and the quarterly report filed May 8, 2026, and sort out who owns what inside this vault.
 Thomas Mücke
Founder & Publisher
Thomas Mücke
Founder & Publisher
Chart
Interactive price chart (TradingView).
Note: pure fact-based analysis, not investment advice and not a solicitation to buy or sell. All figures without guarantee.
A full vault tells you nothing about who owns the money
Picture yourself in a bank lobby, looking through an open vault door at bundles of cash stacked to the ceiling. Impressive. And completely useless as information about how rich the bank is — because most of it belongs to the people who deposited it.
That is exactly the confusion at work with Fidelity National Financial. Our in-house stock scanner reports a price/free cash flow ratio of 2.09. Translated: the entire group costs a little over two years' worth of the money it generates. At a normal company that would be an exclamation mark.
FNF is not a normal company. It is, on one side, the largest title insurer in the United States — the firm that checks, when a house changes hands, whether the seller really owns it. And on the other side, through its subsidiary F&G, an annuity writer that collects money from savers and promises them lifetime payments in return.
That collected money shows up in cash flow. But it does not belong to shareholders; it belongs to policyholders. So we do here what such a case demands: we open the vault and go through it drawer by drawer, working out who owns what.
What this analysis covers
- What FNF sells — and to whom
- How the stock landed on our desk
- The numbers over the years
- Uncomfortable truth no. 1: 85 percent of the cash flow is other people's money
- Uncomfortable truth no. 2: $888 million reaches the holding company
- Uncomfortable truth no. 3: one business earns, the other supplies the cash flow
- Uncomfortable truth no. 4: a third of F&G now belongs to others
- Why the bankruptcy warning score says nothing here
- What the stock costs
- Opportunities and risks at a glance
- A human conclusion
- Sources
What FNF sells — and to whom
Start with the business that barely exists outside the United States: title insurance.
America has no central land register in the European sense. A buyer cannot rely on a government office to record definitively who owns a property. Instead, a title insurer searches decades of recorded documents for problems — forgotten mortgages, inheritance claims, mechanics' liens, clerical errors in old deeds. If it finds nothing, it issues a policy and takes the liability if something surfaces later.
It is an excellent business, because the premium is paid once at closing, the risk is well understood, and the work sits in the research rather than in claims. For scale: out of $5,824 million of title premiums in 2025, FNF set aside just $262 million for claims.
FNF is the leader here. Five underwriters under one roof — Fidelity National Title, Chicago Title, Commonwealth Land Title, Alamo Title and National Title of New York — held 32 percent market share through the third quarter of 2025. In 2025 the group closed 956,000 orders at an average fee per file of $3,948.
The second business is a different animal entirely. F&G Annuities & Life sells retirement products: a saver pays in a sum, F&G invests it and promises payments back, often for life. Add life insurance and pension risk transfer, where a company hands its entire pension obligation to F&G.
The 2025 sales mix: 46 percent indexed annuities, 26 percent fixed rate annuities, 15 percent pension risk transfer, 12 percent institutional funding agreements, 1 percent indexed universal life. F&G has been a separately listed company since December 2022; we took it apart in a dedicated analysis. FNF has held roughly 70 percent of it since December 31, 2025 — more on that below.
The third segment, "Corporate and Other," covers the holding company itself, a few real estate technology businesses and the eliminations between the units. It cost $153 million in 2025.
How the stock landed on our desk
We run roughly 3,500 stocks through our scanners every day. FNF came in through the P/FCF Ranking — the list of every stock with positive free cash flow and a price/free cash flow ratio of no more than 10, sorted cheapest first.
The finding, measured on July 27, 2026: 545 US stocks met the criteria. FNF sits at rank 44 with a P/FCF of 2.09 — identical on both our brands. Unlike score-based lists there is no tie here: exactly one name carries this value, so the rank is unambiguous.
The stock is nevertheless invisible on the scanner page. Only the 25 strongest hits are displayed, and rank 44 falls outside. To check it yourself, take the screener route: set the market filter to "US", sort by P/FCF and page down to rank 44. These lists are recomputed daily.
And there is something else on that list that gives the whole analysis away: F&G sits at rank 15 with a P/FCF of 0.72 — the subsidiary that is roughly 70 percent owned by FNF. The same policyholder deposits therefore generate the cash flow twice: once at the subsidiary, once in the parent's consolidated accounts. When a metric counts the same thing twice, it is worth asking what it actually measures.
A note on precision: the scanner computes with a market value of $12,143 million. At the July 24, 2026 close of $51.62 and 269,157,540 shares it is $13,894 million — which would give a P/FCF of 2.39 rather than 2.09. We use our own figure from here on.
What does that mean for you? A scanner calculates, it does not judge. It knows no difference between money a software company earns and money an annuity writer holds in custody. That difference is the entire story here.
The numbers over the years
Start with what genuinely impresses: this company went through the worst US housing downturn since the financial crisis without a single loss year and without cutting its dividend.
Total revenues rose from $11,752 million (2023) through $13,681 million (2024) to $14,445 million (2025). In the title business, pre-tax earnings climbed from $883 million through $1,096 million to $1,227 million over the same span — three years up in a row.
The core operation is picking up too: 1,230,000 orders opened (2023), 1,310,000 (2024), 1,411,000 (2025). Closed orders came in at 837,000, 879,000 and 956,000. The fee per file climbed from $3,617 to $3,948.
One detail says a lot about the market: the share of refinancings in opened orders rose from 21.1 percent (2023) through 23.9 percent to 28.5 percent (2025). That is not chance, it is interest rates. When mortgage rates fall, homeowners refinance — and need a fresh policy. Refinancings, however, carry a much lower fee per file than an actual purchase.
The bottom line looks less pretty. Group net earnings fell to $679 million in 2025 from $1,391 million. FNF shareholders were left with $602 million, or $2.21 per diluted share, after $4.65 the year before. Why, we cover in uncomfortable truths no. 3 and 4.
The first quarter of 2026 reads far more cheerfully: revenues $3,226 million after $2,729 million, pre-tax earnings $498 million after $111 million, and $243 million attributable to FNF after $83 million. The prior-year quarter, though, carried $287 million of recognized losses — part of the jump is recovery from a weak comparison.
Uncomfortable truth no. 1: 85 percent of the cash flow is other people's money
Open the first drawer. The 2025 consolidated statement of cash flows reports $5,828 million of operating cash flow. After $147 million of capital expenditure that leaves $5,681 million of "free cash flow." What is that number made of?
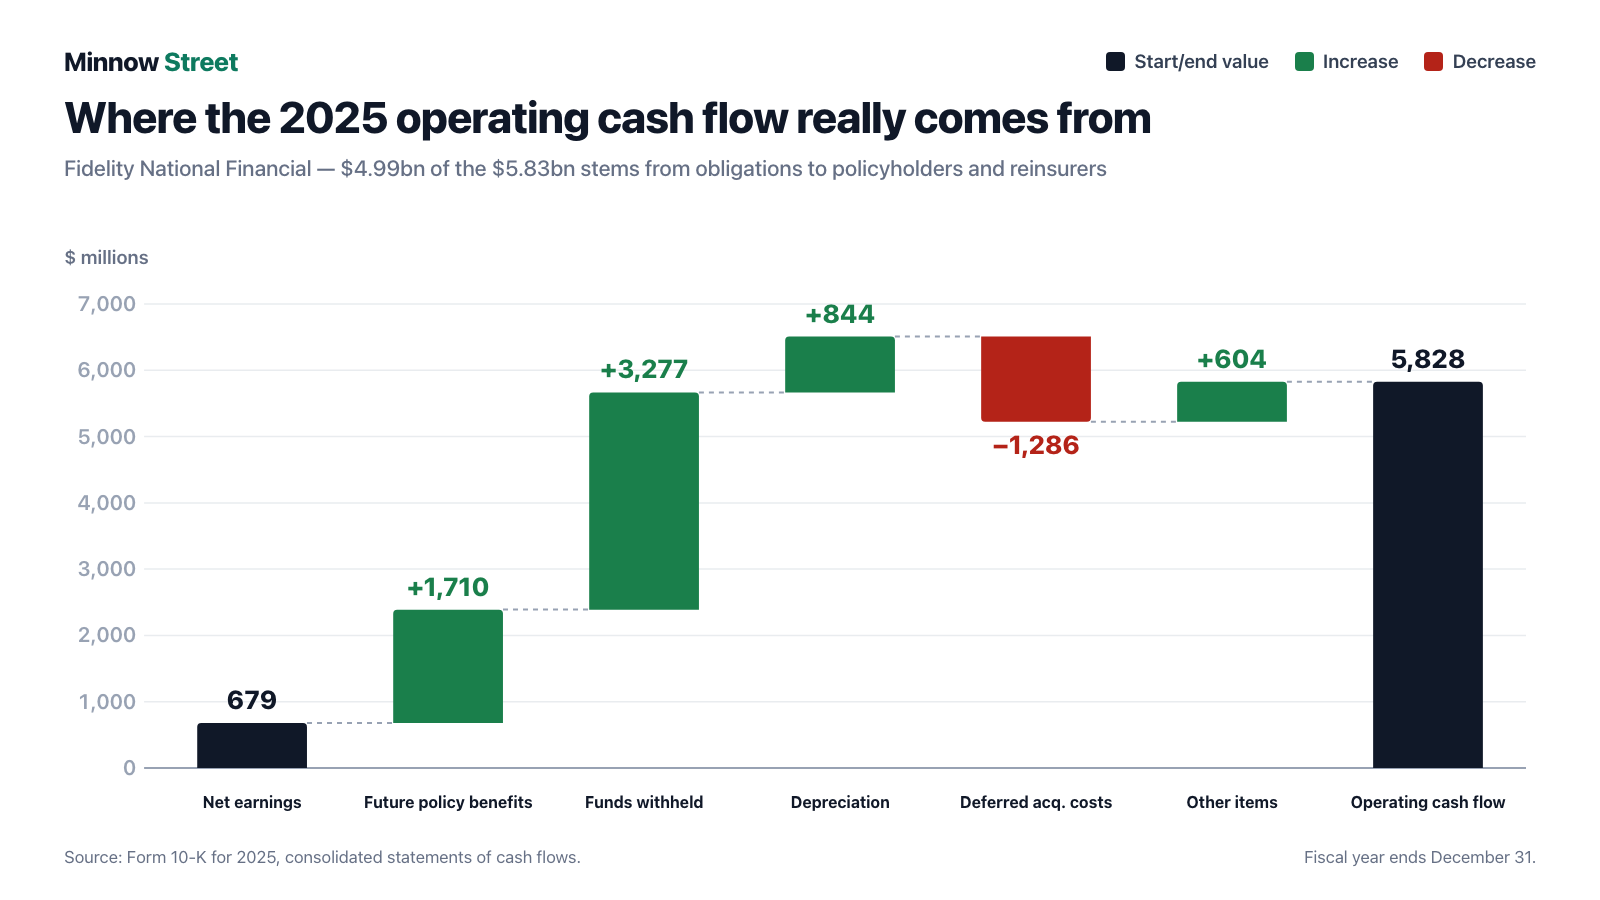
Net earnings contribute $679 million. The bulk of the rest comes from two lines:
- Change in future policy benefits: plus $1,710 million. This is the reserve for what F&G will have to pay its policyholders in future. It grows because new contracts arrive. It counts as an inflow only because the money is here today and leaves later.
- Change in funds withheld from reinsurers: plus $3,277 million. F&G cedes risk to reinsurers but keeps the associated capital on its own books. That, too, is other people's money in your account.
Together $4,987 million — 85.6 percent of the entire operating cash flow. In the first quarter of 2026 the ratio is starker still: $787 million of funds withheld plus $197 million of future policy benefits equals $984 million against $875 million of operating cash flow. That is 112 percent — without those two lines the number would be negative.
The company states the underlying rule with remarkable clarity:
"Premium and annuity deposit collections for indexed annuities, fixed rate annuities, immediate annuities and PRT without life contingency, and amounts received for funding agreements are reported in the financial statements as deposit liabilities (i.e., Contractholder funds) instead of as sales or revenues."
— Fidelity National Financial, Inc., Form 10-Q for the quarter ended March 31, 2026, note on revenue recognition
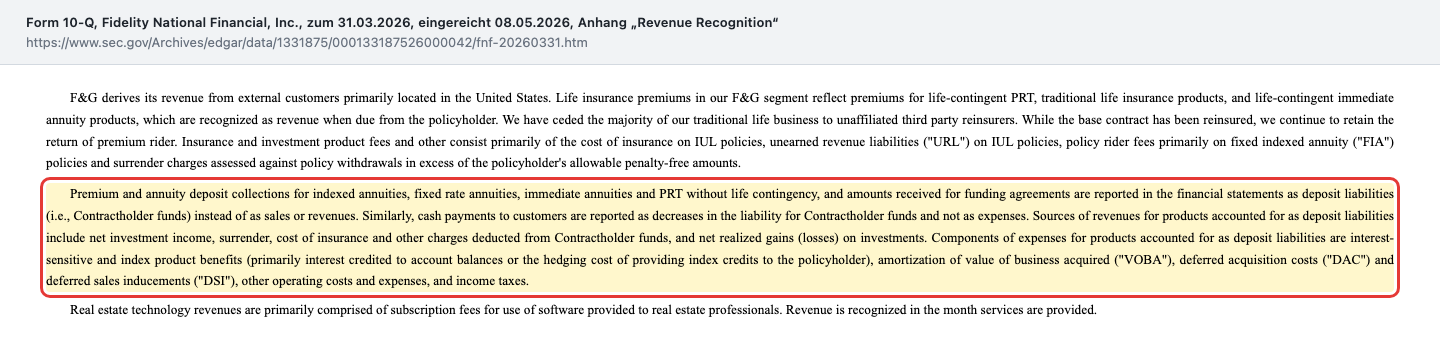
On the balance sheet those deposits sit as their own line: $62,726 million at December 31, 2025, after $56,404 million a year earlier. That is almost nine times the entire equity attributable to FNF shareholders.
And the decisive cross-check sits at the bottom of the cash flow statement: despite $5.8 billion of "cash inflow," group cash fell by $843 million in 2025, from $3,479 million to $2,636 million. The reason is one line up: $8,934 million went into investments — because policyholder money has to be invested so the annuities can be paid later.
Uncomfortable truth no. 2: $888 million reaches the holding company
If $5.8 billion is not the right number, which one is?
There is one, and it sits in the same annual report, just a long way back. Insurance groups must also file a separate parent-company statement of cash flows, in Schedule II. It shows only what actually arrives at the listed holding company — and that is precisely where dividends and buybacks are paid from.
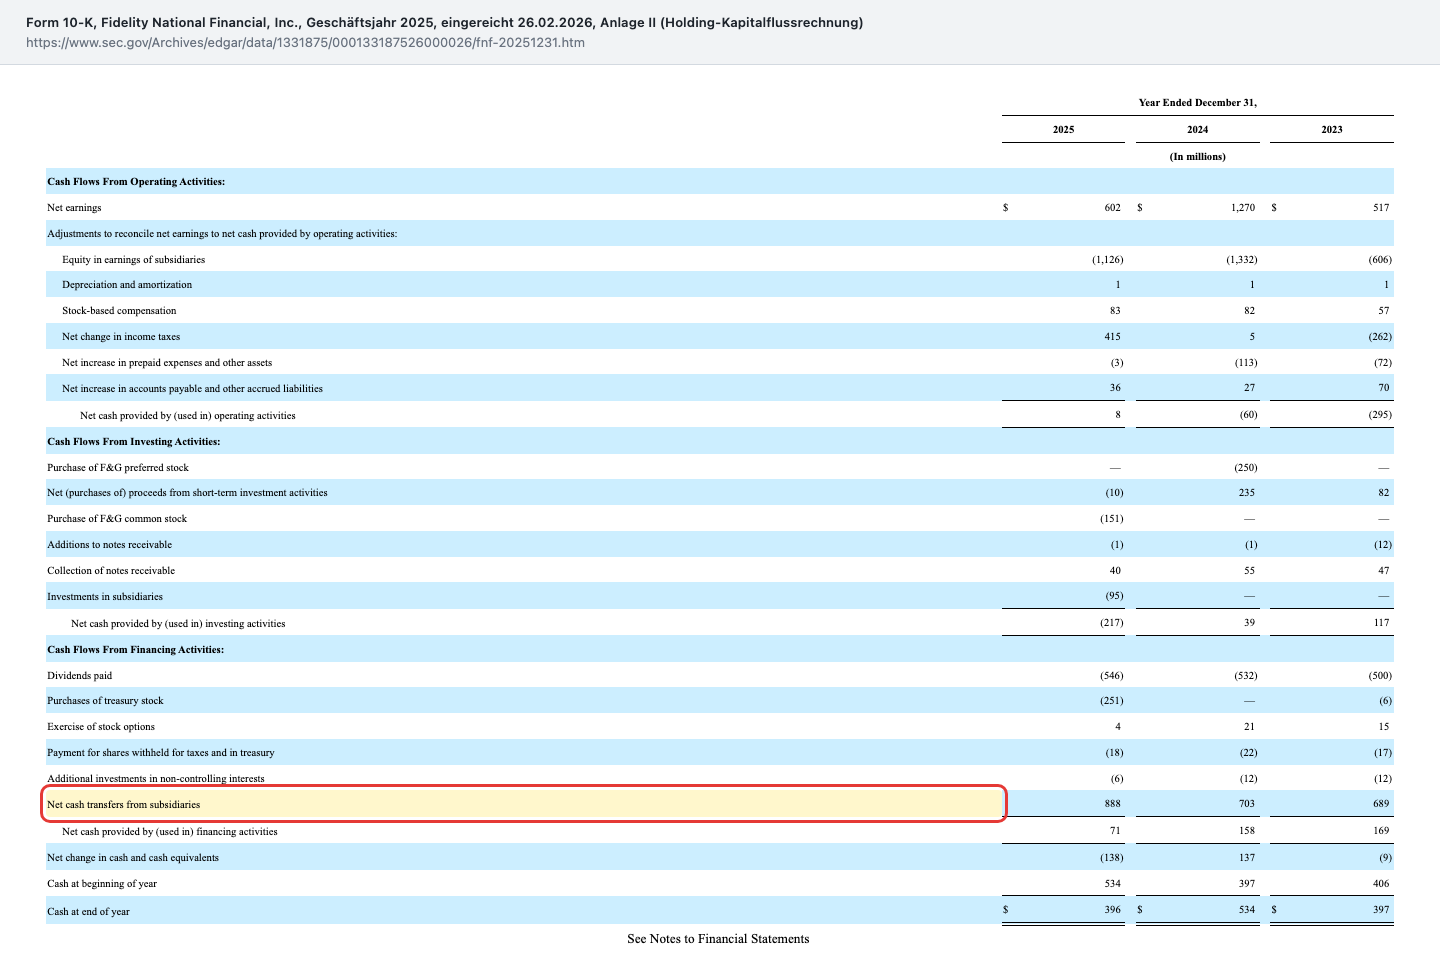
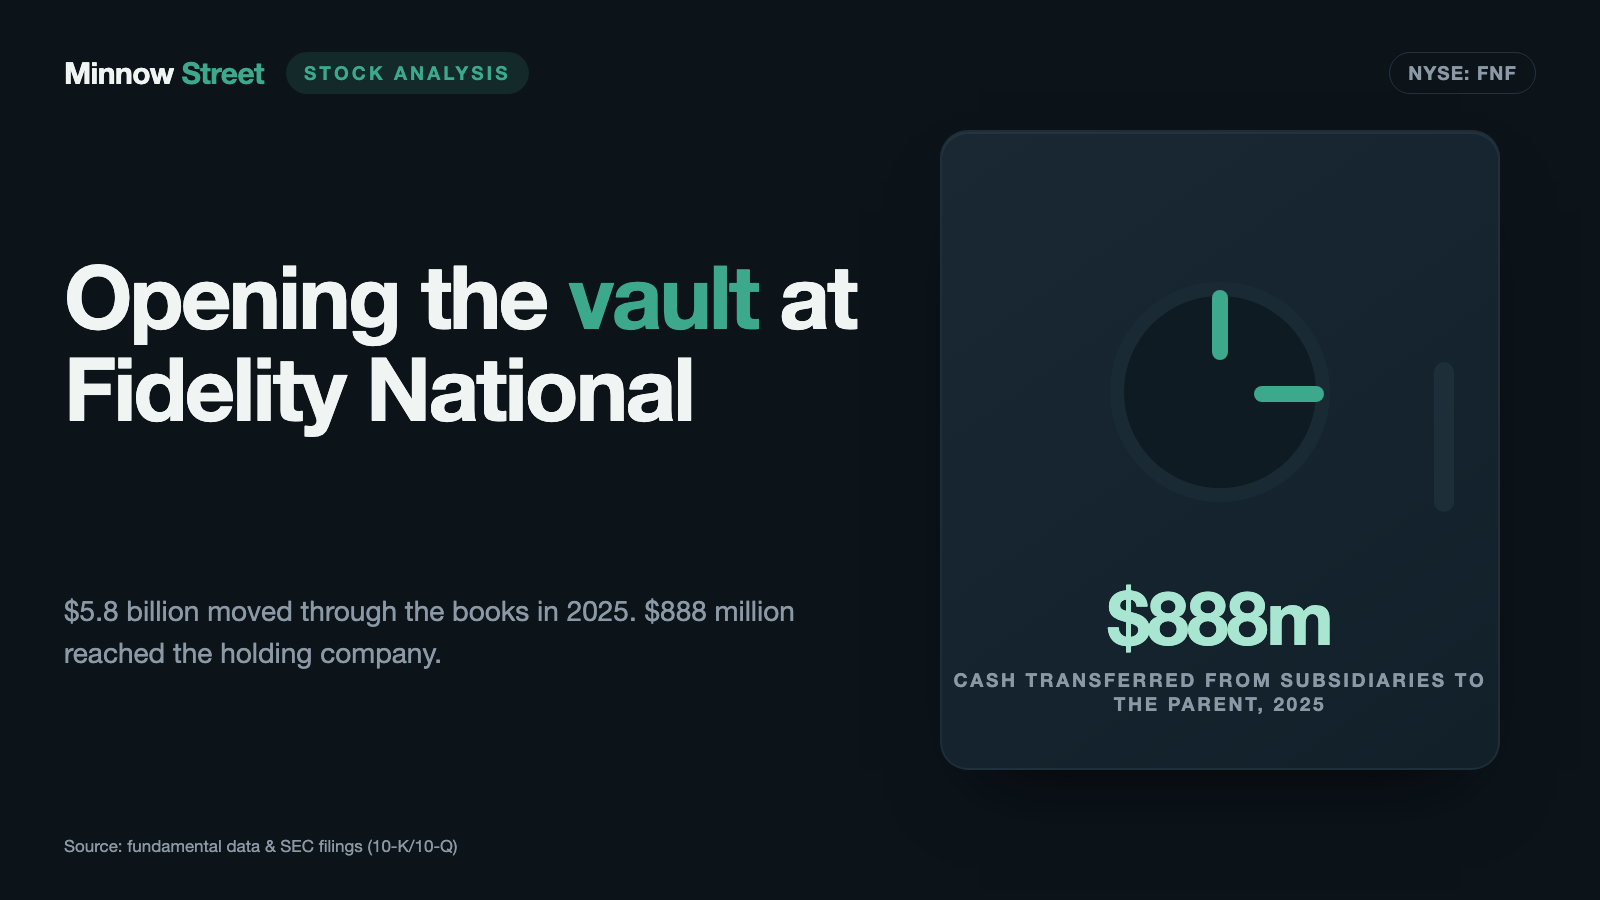
The numbers are unambiguous. Subsidiaries transferred $888 million to the parent in 2025, after $703 million (2024) and $689 million (2023). The parent's own operating cash flow was $8 million. Out went $546 million of dividends and $251 million of buybacks — $797 million, or 90 percent of the inflow. Parent cash fell from $534 million to $396 million.
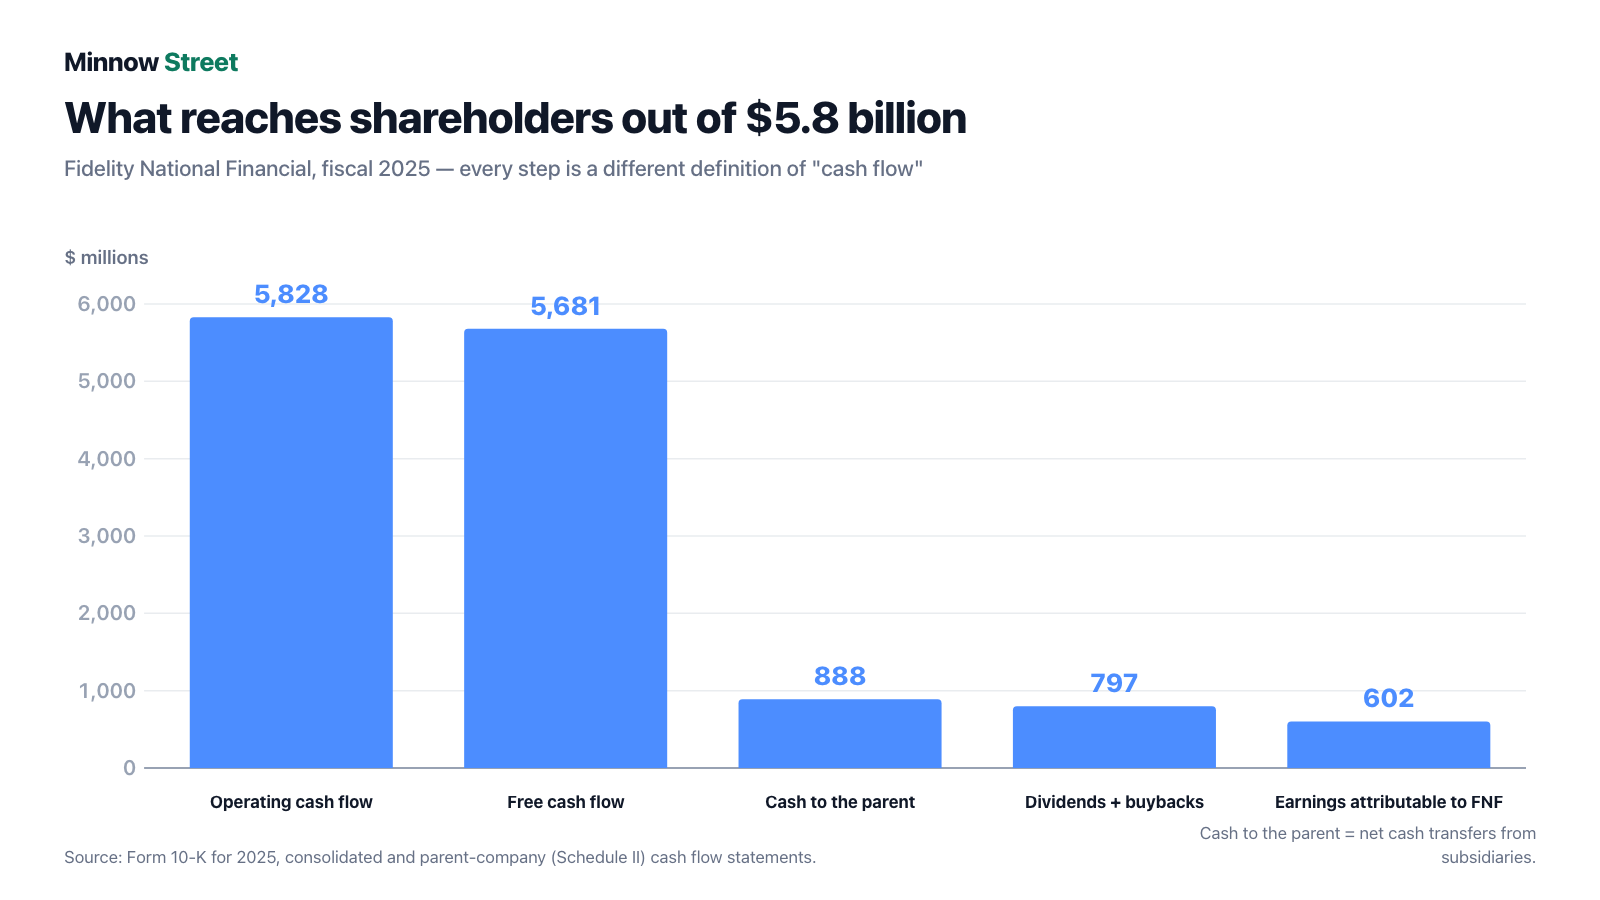
Run the price-to-cash-flow ratio on that basis: $13,894 million of market value divided by $888 million gives 15.7. Not 2.09. The difference is neither a matter of opinion nor an accounting trick — it is simply the line between policyholder money and shareholder money.
One rule worth keeping for the rest of your investing life: at any insurer or bank, consolidated cash flow is the wrong number. The right one is what reaches the holding company.
Uncomfortable truth no. 3: one business earns, the other supplies the cash flow
Here it gets interesting, because the two halves of the group do completely different things.
Fiscal 2025 looked like this:
- Title segment: revenues $8,490 million, pre-tax earnings $1,227 million.
- F&G segment: revenues $5,731 million, pre-tax earnings $323 million.
- Corporate and Other: minus $153 million.
That adds to $1,397 million pre-tax. Which means: the title business produces 88 percent of pre-tax earnings — and almost none of the cash flow that generates the scanner hit. Conversely, F&G delivers nearly all of the cash inflow and a fifth of the profit.
Over time the contrast is sharper still. F&G's pre-tax result swings hard: minus $35 million (2023), plus $778 million (2024), plus $323 million (2025). In the first quarter of 2026 it was $323 million — after minus $26 million a year earlier. The title business runs quietly by comparison: $883 million, $1,096 million, $1,227 million, and $211 million in the first quarter of 2026 after $171 million.
The swings at F&G come from investments and hedges being marked to market every quarter. For an investor that means: the quiet business is the cyclical one, and the volatile business is the predictable one. Exactly the opposite of what you would guess.
And the cyclical business hangs on precisely two variables: the number of US property transactions and the mortgage rate. In the first quarter of 2026 opened orders rose to 389,000 from 343,000, but the fee per file fell to $3,655 from $3,761. More orders, less money per order — that is the signature of refinancings.
Uncomfortable truth no. 4: a third of F&G now belongs to others
The fourth drawer is the one that halved earnings per share between 2024 and 2025.
F&G was a wholly owned subsidiary for a long time. In December 2022 FNF distributed roughly 15 percent to its own shareholders and kept 85 percent. On December 31, 2025 a further roughly 12 percent followed.
"On December 31, 2025, we completed our previously announced distribution to our shareholders, on a pro rata basis, of approximately 12% of the common stock of F&G (the "2025 F&G Distribution"). As a result of the 2025 F&G Distribution, we own approximately 70% of the common stock of F&G."
— Fidelity National Financial, Inc., Form 10-K for 2025, Item 1 Business
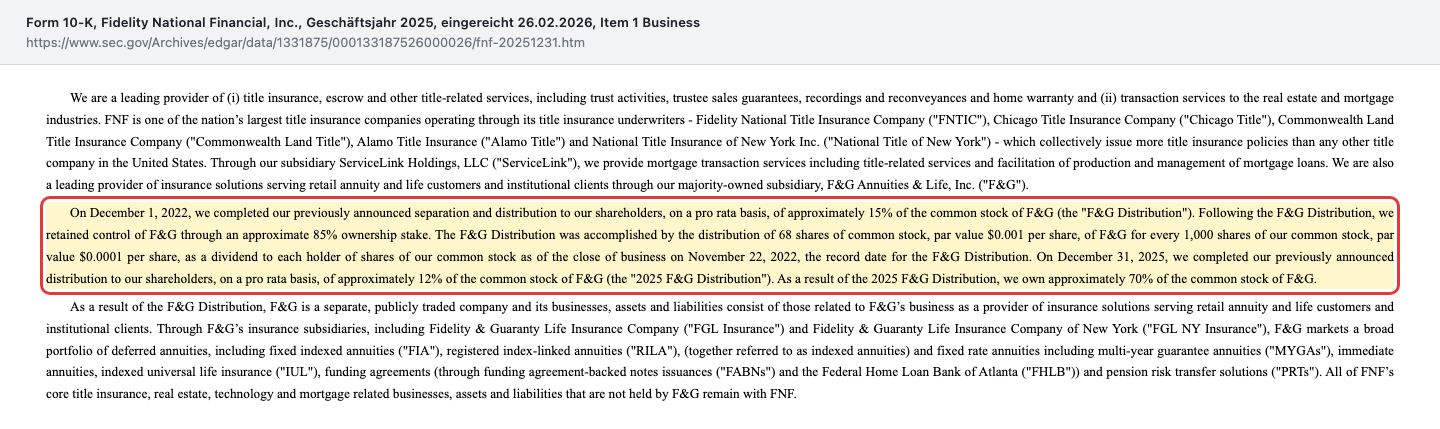
An important point: FNF still consolidates F&G in full. Revenue, cash flow and balance sheet all appear at 100 percent in the FNF numbers. Only at the very bottom of the income statement is the minority share deducted.
How much that now matters shows in the first quarter of 2026: of $321 million of group net earnings, $78 million went to minorities — 24.3 percent. In the first quarter of 2025 it was zero. On the balance sheet, the minority share of equity rose from $778 million (December 31, 2024) to $1,548 million (December 31, 2025), while equity attributable to FNF shareholders fell from $7,754 million to $7,424 million.
The distribution carried a second price, recorded in the tax note:
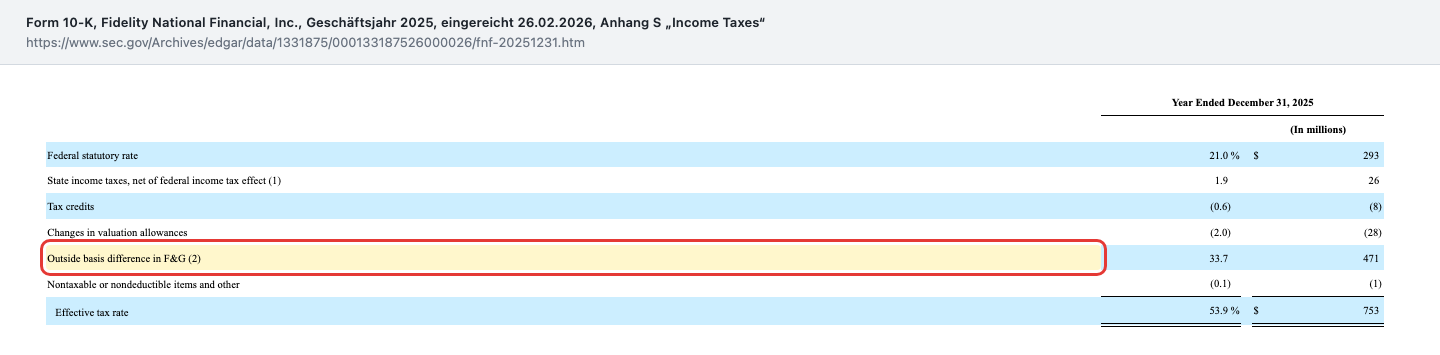
The effective tax rate jumped from 21.1 percent (2024) to 53.9 percent (2025). Tax expense rose from $367 million to $753 million — even though pre-tax earnings fell from $1,742 million to $1,397 million. $471 million of that relates purely to the tax treatment of the F&G distribution.
Those $471 million are a one-off and will not repeat. But they equal 78 percent of everything FNF shareholders were left with for the entire year. And the minority deduction is permanent.
Why the bankruptcy warning score says nothing here
A short section on method, because the point recurs at every financial company.
Our data set carries an Altman Z score of 3.78 for FNF. In the Z-double-prime variant we use, anything below 1.1 counts as the distress zone and anything above 2.6 as safe. So 3.78 reads like an all-clear.
For an insurance company that number is meaningless, for two concrete reasons:
- The formula needs a split between current and non-current assets. An insurance balance sheet has no such split — it is presented unclassified. The formula's most important building block cannot even be formed here.
- The formula penalizes large liabilities. At an insurer, large liabilities are the business model: $100,042 million of a $109,014 million balance sheet, or 91.8 percent, are obligations to policyholders, reinsurers and creditors. That is not a weakness, it is the definition of the trade.
Compute the remaining building blocks of the Z-double-prime formula from the December 31, 2025 balance sheet ratios and you land at roughly 0.36 — which on the same scale would read "acute distress." Both numbers, 3.78 and 0.36, are equally worthless. We therefore do not cite the score as evidence of safety.
What you look at instead at an insurer:
- Equity: $7,254 million was attributable to FNF shareholders at March 31, 2026, after $7,424 million at the end of 2025 and $7,754 million a year before. The decline comes from the F&G distribution and buybacks, not from losses.
- Investments: $73,195 million at December 31, 2025. Within that: $54,561 million of fixed maturity securities at fair value against $57,161 million of amortized cost. That is roughly $2,600 million of unrealized losses, created by the rise in interest rates. They only become real losses if the securities have to be sold.
- Reserves: $1,700 million for title claim losses against an annual charge of $262 million — more than six times over. $10,755 million of future policy benefits at F&G.
- Debt and coverage: $4,400 million of financial debt, of which $2,132 million sits directly at the holding company (4.50 percent notes $448 million, 3.40 percent $646 million, 2.45 percent $596 million, 3.20 percent $445 million). Interest coverage was most recently 8.33.
The same caution applies to the Piotroski score, which our data set carries at 9 of 9. In fiscal 2025 net earnings, return on assets and asset turnover all fell — so at least three of the nine criteria cannot be met. The value contradicts the accounts and is not used as evidence here.
What the stock costs
Add it up — at the July 24, 2026 close of $51.62 and 269,157,540 shares, so a market capitalization of roughly $13.89 billion.
- Price to earnings: roughly 23. On the $2.21 per diluted share from fiscal 2025. On the twelve months to March 31, 2026 it is roughly 18.
- Price to book: roughly 1.9. On $7,254 million of equity attributable to FNF shareholders at March 31, 2026, or $26.95 per share.
- Price to cash reaching the parent: roughly 15.7. The honest cash flow metric — $888 million in 2025.
- Price to free cash flow: 2.09 per the scanner, 2.39 on our own calculation. The number that triggered this analysis — and which, for the reasons above, says nothing about valuation.
- Title business alone: $1,227 million of pre-tax earnings, or roughly $920 million after an assumed 25 percent tax rate. The entire market capitalization therefore equals about 15 times the title business — with the 70 percent stake in F&G thrown in on top.
That last line is the genuinely interesting one. Buying FNF means paying about what you would pay for a solid industrial name in exchange for a market-leading regulated business — and getting an annuity writer alongside it that you have to value yourself.
On the payout: the quarterly dividend was most recently $0.52 per share (paid June 30, 2026), or $2.08 a year. That is roughly 4.0 percent, and it has not been cut in five years. It is worth knowing where it comes from, though: out of the $888 million, of which $797 million was already distributed.
The professionals' view: the consensus target price stood at $61.40 on July 26, 2026, roughly 19 percent above the July 24 close. One caveat on context: the price history is distorted by the F&G distributions of 2022 and 2025, because the stock mechanically gave up value on those dates. Comparisons with old highs mislead here. The 52-week closing range ran from $43.26 to $61.07.
Opportunities and risks at a glance
Opportunities
- Leadership in the core business: 32 percent of the US title insurance market (as of the third quarter of 2025), five underwriters of its own, a regulated trade with high barriers to entry.
- The title segment grew pre-tax earnings three years running: $883 million, $1,096 million and $1,227 million.
- Rate cuts work twice over: more home purchases and more refinancings, both of which create policies.
- A dividend yield of roughly 4.0 percent, uncut for five years.
- F&G is growing: contractholder funds rose from $56,404 million to $62,726 million in 2025; 93 percent of the $36.1 billion book of indexed and fixed rate annuities is protected by surrender charges.
- The $471 million tax charge from the F&G distribution is a one-off.
Risks
- Earnings per share halved in 2025, from $4.65 to $2.21.
- The core business depends entirely on the US housing market and mortgage rates. No transaction, no policy.
- A rising refinancing share (28.5 percent of opened orders in 2025 after 21.1 percent in 2023) alongside a falling fee per file in the first quarter of 2026 ($3,655 after $3,761).
- Roughly 30 percent of F&G has belonged to others since December 31, 2025; in the first quarter of 2026, $78 million of $321 million of group earnings went to minorities.
- $797 million was distributed in 2025 — roughly 90 percent of what reached the holding company; parent cash fell to $396 million.
- Roughly $2,600 million of unrealized losses in the fixed maturity portfolio at December 31, 2025.
- $4,035 million of unfunded capital commitments in the F&G segment at March 31, 2026 — 56 percent of equity attributable to FNF shareholders.
- F&G's result swings hard (minus $35 million, plus $778 million, plus $323 million over three years) because investments and hedges are remarked every quarter.
A human conclusion
Back to the bank lobby. The vault is open, and there really are billions inside.
Only now we have read the labels on the drawers. The largest one — $62.7 billion — belongs to F&G's policyholders. Another, $14.2 billion, belongs to reinsurers. A third of what sits in the F&G corner now belongs to minority shareholders. And in the drawer that dividends and buybacks are paid from, 2025 held exactly $888 million, of which $797 million went straight back out.
None of this is an accusation. FNF is doing nothing improper and nothing unusual — every insurance balance sheet looks like this. The company leads its market, has earned more in its core business three years running, has not cut its dividend in five years and is in decent shape on the balance sheet.
What is wrong is only the metric that brought us here. At an annuity writer, a price/free cash flow ratio of 2 describes no valuation gap; it describes a bookkeeping rule. On the measure that actually counts, the stock trades at 15.7 times — roughly what a solid, cyclical business costs.
A full vault makes a fine picture. But the question is never how much is inside. The question is whose name is on the envelopes.
What you make of it is your decision. And that is exactly how it should be.
Sources
- Form 10-K for 2025, Fidelity National Financial, Inc., filed February 26, 2026 (CIK 0001331875) — including Schedule II (parent-company cash flows) and Note S (income taxes)
- Form 10-K for 2024, filed February 28, 2025 — supplies the comparative figures for 2023
- Form 10-Q for the quarter ended March 31, 2026, filed May 8, 2026
- Form 10-Q for the quarter ended September 30, 2025, filed November 10, 2025
- Form 10-Q for the quarter ended June 30, 2025, filed August 7, 2025
- Form 10-Q for the quarter ended March 31, 2025, filed May 8, 2025
- Screener and metrics data: our in-house stock scanner (data as of July 26 to 27, 2026), including the P/FCF Ranking (US selection, 545 hits, rank 44, P/FCF 2.09, measured July 27, 2026; the page shows only the 25 strongest hits) — the lists are recomputed daily
- For the avoidance of doubt: our analysis of Fidelity National Information Services — a different company with a similar name
- Metrics, price history and analyst estimates: fundamental data, as of July 24 to 27, 2026
Journalistic analysis, not investment advice and not a solicitation to buy or sell securities. Stocks can move sharply; a total loss is possible. All figures come from the primary documents linked above and carry their own as-of date. The author holds no position in Fidelity National Financial at the time of publication.
Our Bottom Line at a Glance
- Market position in the core business positive
- FNF is the largest title insurer in the United States: 32 percent market share per industry body ALTA through the third quarter of 2025, five underwriters under one roof, 956,000 orders closed in 2025 after 879,000 (2024) and 837,000 (2023). Title segment pre-tax earnings rose to $1,227 million in 2025 after $1,096 million and $883 million. Title insurance is a regulated business with high barriers to entry.
- Quality of the cash flow negative
- The reported operating cash flow of $5,828 million (2025) is 85.6 percent other people's money: $1,710 million from the increase in future policy benefits and $3,277 million from funds withheld from reinsurers. $888 million reached the holding company, and group cash fell by $843 million in 2025 to $2,636 million. A price/free cash flow ratio of 2.09 does not describe that situation.
- Cyclicality of the title business neutral
- No property transaction, no policy. The refinancing share of opened orders rose from 21.1 percent (2023) to 28.5 percent (2025) — a rate signal, and refinancings carry a lower fee per file. Orders did grow in the first quarter of 2026 (389,000 opened after 343,000), but the fee per file fell to $3,655 from $3,761 a year earlier.
- Balance sheet and substance neutral
- At March 31, 2026, equity attributable to FNF shareholders was $7,254 million, after $7,424 million at year-end. Investments $73,195 million, reserve for title claim losses $1,700 million against a $262 million annual charge, interest coverage 8.33, financial debt $4,400 million. Solid, but without excess cushion: the fixed maturity portfolio carried roughly $2,600 million of unrealized losses at December 31, 2025 ($54,561 million fair value against $57,161 million amortized cost).
- What belongs to shareholders negative
- Of $679 million of group net earnings in 2025, $602 million was attributable to FNF shareholders — $2.21 per diluted share after $4.65 the year before. The causes: a 53.9 percent tax rate including $471 million from the company's own F&G distribution, and a weaker F&G result. Since December 31, 2025 roughly 30 percent of F&G belongs to others; in the first quarter of 2026, $78 million of $321 million went to minorities, after zero a year earlier.
- Valuation and distribution neutral
- At $51.62 (July 24, 2026) and 269,157,540 shares, market capitalization is roughly $13.89 billion: 23 times 2025 earnings, 18 times the twelve months to March 31, 2026, 1.9 times book value and 15.7 times the cash that reached the parent. The $2.08 annual dividend yields roughly 4.0 percent; together with buybacks, however, $797 million of the $888 million that reached the parent was paid out in 2025.
Fidelity National Financial is two companies in one: the largest title insurer in the United States with 32 percent market share and $1,227 million of segment pre-tax earnings — and an annuity writer that contributed only $323 million in 2025 while generating almost all of the cash flow. That is exactly what the scanner hook hangs on: a price/free cash flow ratio of 2.09 arises because policyholder deposits and funds withheld from reinsurers count as cash inflow. $888 million reached the holding company, $797 million was paid out, and group cash fell by $843 million. The business is real and market-leading; the metric is not. Not investment advice.
What Our Rating Means
Open questions
The business works in principle, but one material question is open. As long as it stays open, our findings do not carry a quality verdict.
The company has real substance and leads its market: 32 percent of the US title insurance market, $1,227 million of segment pre-tax earnings in title, $73,195 million of investments, $7,254 million of equity attributable to FNF shareholders, interest coverage of 8.33 and a dividend that has not been cut in five years. There is no sign of substance risk — hence no red. Too much is missing for green: earnings per share halved in 2025 from $4.65 to $2.21, the effective tax rate was 53.9 percent, equity attributable to shareholders fell from $7,754 million to $7,424 million, and $797 million was distributed — roughly 90 percent of everything that reached the holding company. Add a core business tied entirely to the US housing market and mortgage rates, and an annuity business of which roughly 30 percent has belonged to others since December 31, 2025. The decision is yours.
A journalistic assessment by our editorial team at the time of the deep dive, based on public sources — not investment advice and not a solicitation to buy or sell. Your personal circumstances (investment goals, risk capacity, taxes) cannot be taken into account. What our levels mean, how verdicts are formed, and what conflicts of interest exist →
Worth Noting
- Hook: our in-house stock scanner "P/FCF Ranking", rank 44 of 545 US hits, P/FCF 2.09, measured identically on both brands on July 27, 2026 (list computed July 27, 2026). No tie — exactly one name carries this value, so the rank is unambiguous. The scanner page shows only the 25 strongest hits; FNF is not visible there, and the route runs through the screener with the market filter set to the US and sorting by P/FCF. The lists are recomputed daily.
- Double counting inside the ranking: subsidiary F&G Annuities & Life, roughly 70 percent owned, sits at rank 15 on the same list with a P/FCF of 0.72. The same policyholder deposits generate the cash flow twice — once at the subsidiary, once in the parent's consolidated accounts.
- Altman Z deliberately not used as a safety argument: the data set carries 3.78; the Z-double-prime variant (thresholds 1.1 and 2.6) computed from the December 31, 2025 balance sheet ratios gives roughly 0.36. Neither figure means anything for an insurer — the formula was built for industrial companies, an insurance balance sheet has no current/non-current split and is 91.8 percent liabilities. The argument is made instead with equity, investments, reserves and interest coverage.
- Piotroski contradicts the filings: the data set carries 9 of 9. In fiscal 2025, however, net earnings ($679m after $1,391m), return on assets (0.62 percent after 1.46) and asset turnover (0.133 after 0.144) all fell — at least three of the nine criteria cannot be met. The value is therefore not cited as evidence.
- Data-date deviation on market capitalization: the scanner computes the P/FCF of 2.09 on a market value of $12,143 million; at the July 24, 2026 close of $51.62 and 269,157,540 shares it is $13,894 million, which would give a P/FCF of 2.39. The article uses our own calculation and labels the scanner value as such. Likewise: the four quarterly values in the data set sum to $5,815 million of free cash flow, while the annual report for calendar 2025 shows $5,681 million ($5,828 million operating less $147 million of capital expenditure).
- Takeover and delisting check: FNF common stock has been continuously listed on the NYSE. The Form 25-NSE of November 20, 2017 and the Form 15-12B of January 2, 2018 relate to a different class of securities separated at the time — the FNFV group split-off into Cannae Holdings (merger proxy DEFM14A of October 19, 2017) — not to the common stock. No SC 14D9, no pending DEFM14A.
- Data as of: 10-K for 2025 filed 2026-02-26, 10-K for 2024 filed 2025-02-28, 10-Q for the quarter ended 2026-03-31 filed 2026-05-08, 10-Q reports for 2025-09-30, 2025-06-30 and 2025-03-31, current reports 8-K dated 2026-05-12 and 2026-06-11; metrics and price history July 24 to 27, 2026.
- Possible confusion: Fidelity National Financial (FNF) is not Fidelity National Information Services (FIS) and not the asset manager Fidelity Investments. The former corporate name Fidelity National Title Group still appears in older registers.
- The traffic light in this analysis judges the company, not the entry point. A scanner rank is an invitation to research, not a buy signal.
Frequently Asked Questions
Two very different things. First, title insurance: when a US property changes hands, FNF checks whether the seller really owns it and insures the answer. With 32 percent market share it is the number one in the country. Second, the group holds roughly 70 percent of F&G Annuities & Life, a provider of annuities and life insurance. Total 2025 revenues: $14,445 million.
Because the formula divides market value by free cash flow, and cash flow at an annuity writer is inflated. Of $5,828 million of 2025 operating cash flow, $4,987 million — 85.6 percent — comes from the increase in future policy benefits and in funds withheld from reinsurers. That is money owed to policyholders and reinsurers, not a distributable surplus.
The parent company statement of cash flows in Schedule II of the annual report gives the figure: $888 million moved from the subsidiaries to the holding company in 2025, after $703 million in 2024 and $689 million in 2023. Out of that came $546 million of dividends and $251 million of buybacks. Measured against that number the stock trades at 15.7 times, not 2.1 times.
Nothing reliable. The bankruptcy warning score was built for industrial companies and assumes a balance sheet that splits into current and non-current. An insurance balance sheet does not, and it is 91.8 percent liabilities by construction. Our data set carries 3.78; the balance sheet ratios under the Z-double-prime variant give roughly 0.36. Neither number means anything for this business model.
By equity, investments and reserves. At March 31, 2026, equity attributable to FNF shareholders was $7,254 million. Total investments stood at $73,195 million at December 31, 2025, the reserve for title claim losses at $1,700 million against an annual charge of $262 million, and interest coverage at 8.33. Financial debt: $4,400 million, of which $2,132 million sits at the holding company itself.
The title business. It delivered $1,227 million of pre-tax earnings in 2025, the F&G segment only $323 million, Corporate and Other minus $153 million. The cash flow, by contrast, comes almost entirely from F&G. Buying FNF means buying a cyclical real estate business that supplies the profit and an annuity business that fills the balance sheet.
Completely. No purchase or refinancing, no policy. Closed orders rose to 956,000 in 2025 from 879,000 (2024) and 837,000 (2023) — still well below the boom years. The rate effect is visible too: refinancing rose from 21.1 percent of opened orders in 2023 to 28.5 percent in 2025. Refinancings carry a much lower fee per file than purchase transactions.
From $4.65 to $2.21, for two reasons. First, an effective tax rate of 53.9 percent instead of 21.1 percent: $471 million alone related to the tax treatment of the company's own F&G distribution on December 31, 2025. Second, a weaker F&G result, $323 million instead of $778 million pre-tax. The title business itself grew in the same year.
Found an error?
Did you spot a factual error, an outdated number, or a typo in this deep dive? Let us know briefly — your report goes straight to the editorial team.