OneMain Holdings: $3.1 Billion of Free Cash Flow — and a $29 Million Outflow
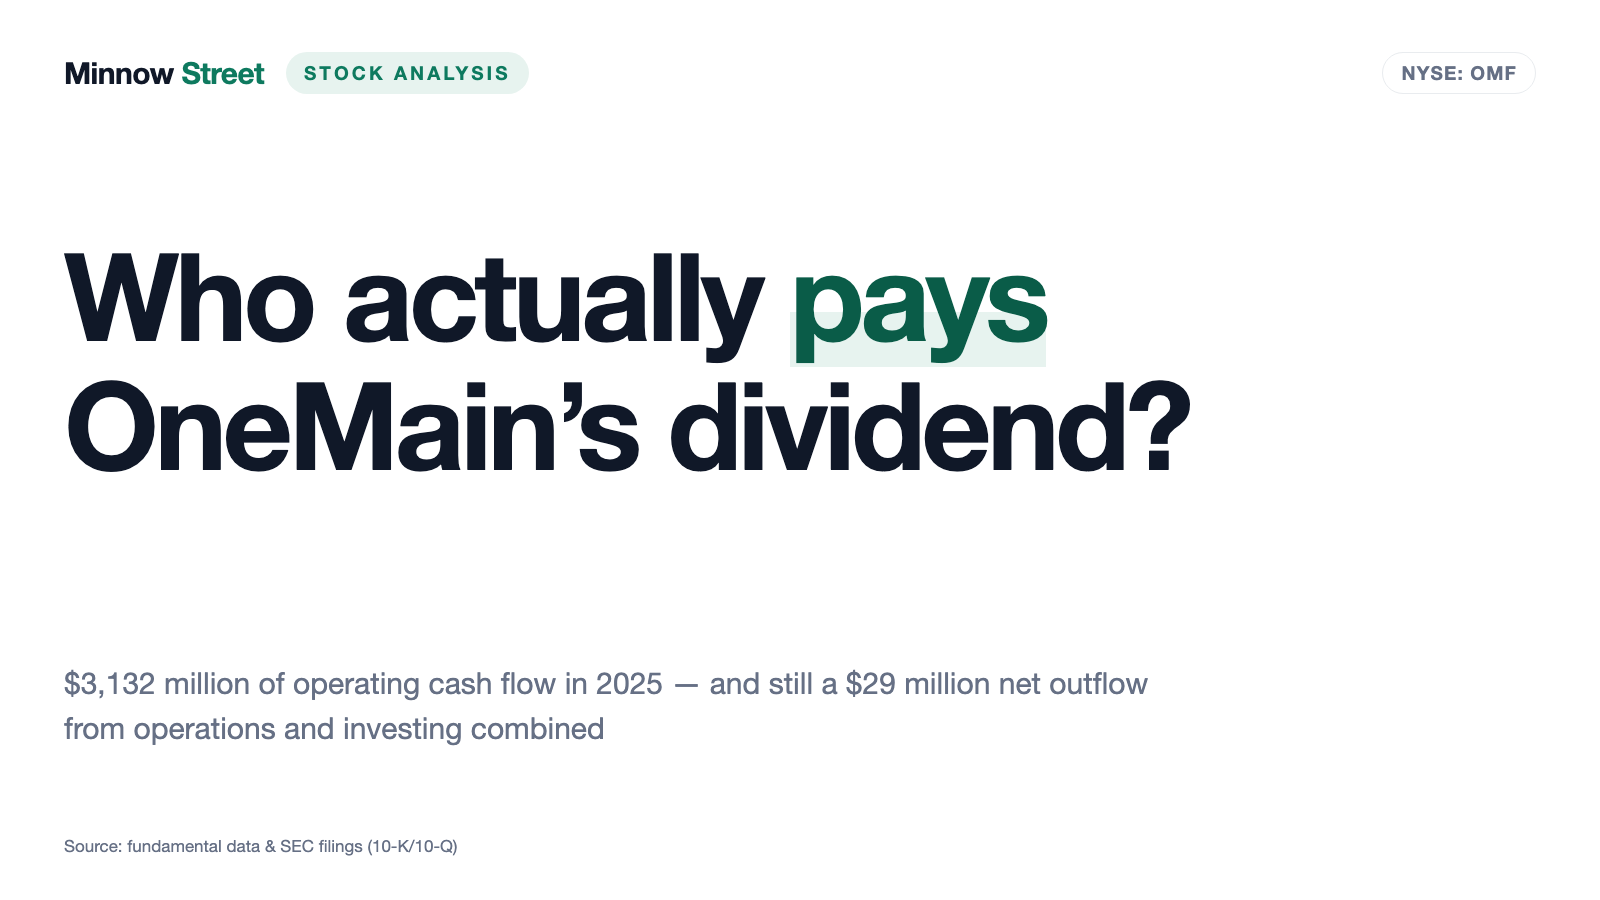
A price-to-free-cash-flow ratio of 2.17 looks like a gift: the entire market value earned back in a little over two years. OneMain Holdings, the largest U.S. installment lender to nonprime borrowers, did report $3,132 million of operating cash flow for 2025. Almost two thirds of that figure, however, is the add-back of a $1,997 million loan loss provision — money that never moved. Add the loan book the company has to keep funding and the annual report shows a net outflow of $29 million. In the same year, $499 million of dividends and $141 million of buybacks stood against $1,148 million of net new borrowings. Not investment advice — just the question of which cash box the dividend actually comes from.
 Thomas Mücke
Founder & Publisher
Thomas Mücke
Founder & Publisher
Chart
Interactive price chart (TradingView).
Note: pure fact-based analysis, not investment advice and not a solicitation to buy or sell. All figures without guarantee.
There is an investor trap that strikes exactly where we feel safest: at the money landing in the account. Call it the payout trap. It works like this. As long as a company only promises profits, we check the arithmetic with suspicion. The moment it actually wires money — quarter after quarter, on time, visible on the statement — we stop asking which cash box the money came out of. That is precisely where OneMain Holdings, Inc. (NYSE: OMF) landed on our desk: at a price-to-free-cash-flow ratio of 2.17 and with a dividend that has been paid reliably for years. So let us make a deal. We are not going to celebrate the transfer, we are going to trace it back. The source is the filings OneMain submits to the U.S. securities regulator, the SEC — the annual report (10-K) for 2025, the quarterly report (10-Q) for March 31, 2026 and the current report (Form 8-K) of June 22, 2026. Those documents are honest under penalty of law. And they describe a lender whose cash inflow consists largely of a bookkeeping entry that was never cash. What you make of that is up to you.
Contents
- What OneMain Holdings actually does
- Where the stock landed on our desk — and what a P/FCF of 2.17 measures at a lender
- The numbers over the years — given their due
- What the filings say — the uncomfortable truths
- Valuation: at a lender, the charge-off rate decides
- Opportunities and risks at a glance
- A human conclusion
- Sources
What OneMain Holdings actually does
OneMain is the largest U.S. lender of personal installment loans to nonprime borrowers — working households that fail a mainstream bank’s credit screen because their score is too low, their file too thin or their income too irregular. The annual report states the ambition plainly: to be the “lender of choice for nonprime consumers.” The business is not purely digital. It runs on branches: more than 1,300 locations in 44 states, supported by central servicing facilities in South Carolina, Arizona, Texas, Minnesota and Utah. At December 31, 2025 the company employed approximately 9,300 people.
The core product is the installment loan: fixed rate, fixed term of generally three to six years, level monthly payment. At December 31, 2025 OneMain held roughly 2.4 million such loans totaling $21.43 billion, of which 53 percent were secured by titled property — usually the borrower’s car. A year earlier it was $20.83 billion at a 50 percent secured share. Two younger building blocks sit alongside: auto finance written at dealerships (roughly 148,000 loans totaling $2.5 billion at December 31, 2025, up from 127,000 loans totaling $2.1 billion) and the BrightWay credit card (1.08 million open accounts totaling $936 million, up from 783,000 accounts totaling $643 million). On top of that OneMain sells optional insurance products — credit life, disability and property cover — through its own insurance subsidiaries.
How does OneMain earn its money? On the interest spread. In fiscal 2025, $5,455 million of interest income met $1,272 million of interest expense, leaving net interest income of $4,183 million. Another $720 million of other revenues came mainly from insurance, investments and sales of finance receivables. The rate a OneMain borrower pays is correspondingly high: the yield on consumer loans ran at 22.60 percent in the first quarter of 2026.
All of it is funded in the capital markets, to a large extent through securitization. Securitization means bundling loan receivables into a separate legal vehicle and selling bonds backed by that bundle. For the lender it is cheap money, because the bonds are collateralized. For the shareholder it means a substantial part of the loan book is no longer freely available — more on that below. At March 31, 2026, $12.7 billion of gross consumer loan receivables were pledged as collateral, and long-term debt stood at $22,396 million.
One word on the history, because the name can mislead. The listed company was called Springleaf Holdings, Inc. until November 9, 2015; the Springleaf retirement plan still carries the old name. The initial public offering dates to October 16, 2013. The operating subsidiary that issues the debt is OneMain Finance Corporation, which reports inside the same 10-K — which is why some figures appear twice, once for OMH and once for OMFC.
Where the stock landed on our desk — and what a P/FCF of 2.17 measures at a lender
The hook is a snapshot, not a permanent state. Measured on July 27, 2026 — the underlying scanner run is dated July 26, 2026 — OneMain Holdings sits at rank 46 of our in-house P/FCF ranking with the U.S. market filter, at a price-to-free-cash-flow ratio of 2.17. And here is the honest caveat right away: you will not find OneMain on the scanner page itself. The list shows only the 25 strongest hits, and rank 46 sits outside them. In total, 544 stocks passed the ranking’s criteria that day. To see the row, use the screener, sort by price-to-free-cash-flow ascending and filter for the U.S. market — OneMain then appears in row 46. The lists are recalculated daily, so tomorrow’s rank and hit count will differ from today’s.
What does the ranking measure? It divides market value by free cash flow over the trailing twelve months — operating cash flow less capital expenditure. The underlying question is: how many years would the company need to keep going to earn its own market value? At 2.17 that would be a little over two years. For comparison, a solid industrial company sits closer to 15 or 25. A reading of 2 practically shouts bargain.
This is exactly where you have to slow down. At an installment lender the actual business does not appear in the operating section of the cash flow statement. When OneMain disburses a new loan, accounting treats it not as an operating expense but as an investment — the outflow lands in investing activities. When a borrower repays principal, the money returns the same way. What remains in the operating section is essentially net interest income, before losses are deducted. Because the loan loss provision is an accrual rather than a cash payment, it is added straight back. The annual report spells it out:
“Net cash provided by operations of $3.1 billion for the year ended December 31, 2025 reflected net income of $783 million, the impact of non-cash items including provision for finance receivable losses of $2.0 billion, and an unfavorable change in working capital of $13 million.”
— OneMain Holdings, Inc., SEC annual report 10-K for 2025, Item 7 MD&A, “Liquidity”

Translated into everyday terms: picture a landlord who bills $100,000 of rent and knows that $60,000 will never arrive because several tenants cannot pay. On the tax return he may book the $60,000 as an expense, and his profit falls. In his cash statement the same amount is added straight back, because it was never paid out. The bottom line then shows a large number suggesting a lot of money came in. It is not in the account. Remember the sentence: at a lender, free cash flow measures the interest margin before losses, not what is left over. We saw the same effect at Oportun Financial, with different accounting mechanics — there the loan book is carried at fair value, here at amortized cost with an allowance. The result is identical: at lenders this metric needs context, not applause.
So what is the number worth? It is a signal, not a verdict. A reading of 2.17 says that this business earns a very wide interest margin relative to its market value. That is true and relevant. It does not say that the company could distribute its own market value to shareholders in a little over two years. How far apart those two statements are is what the next calculation shows.
The numbers over the years — given their due
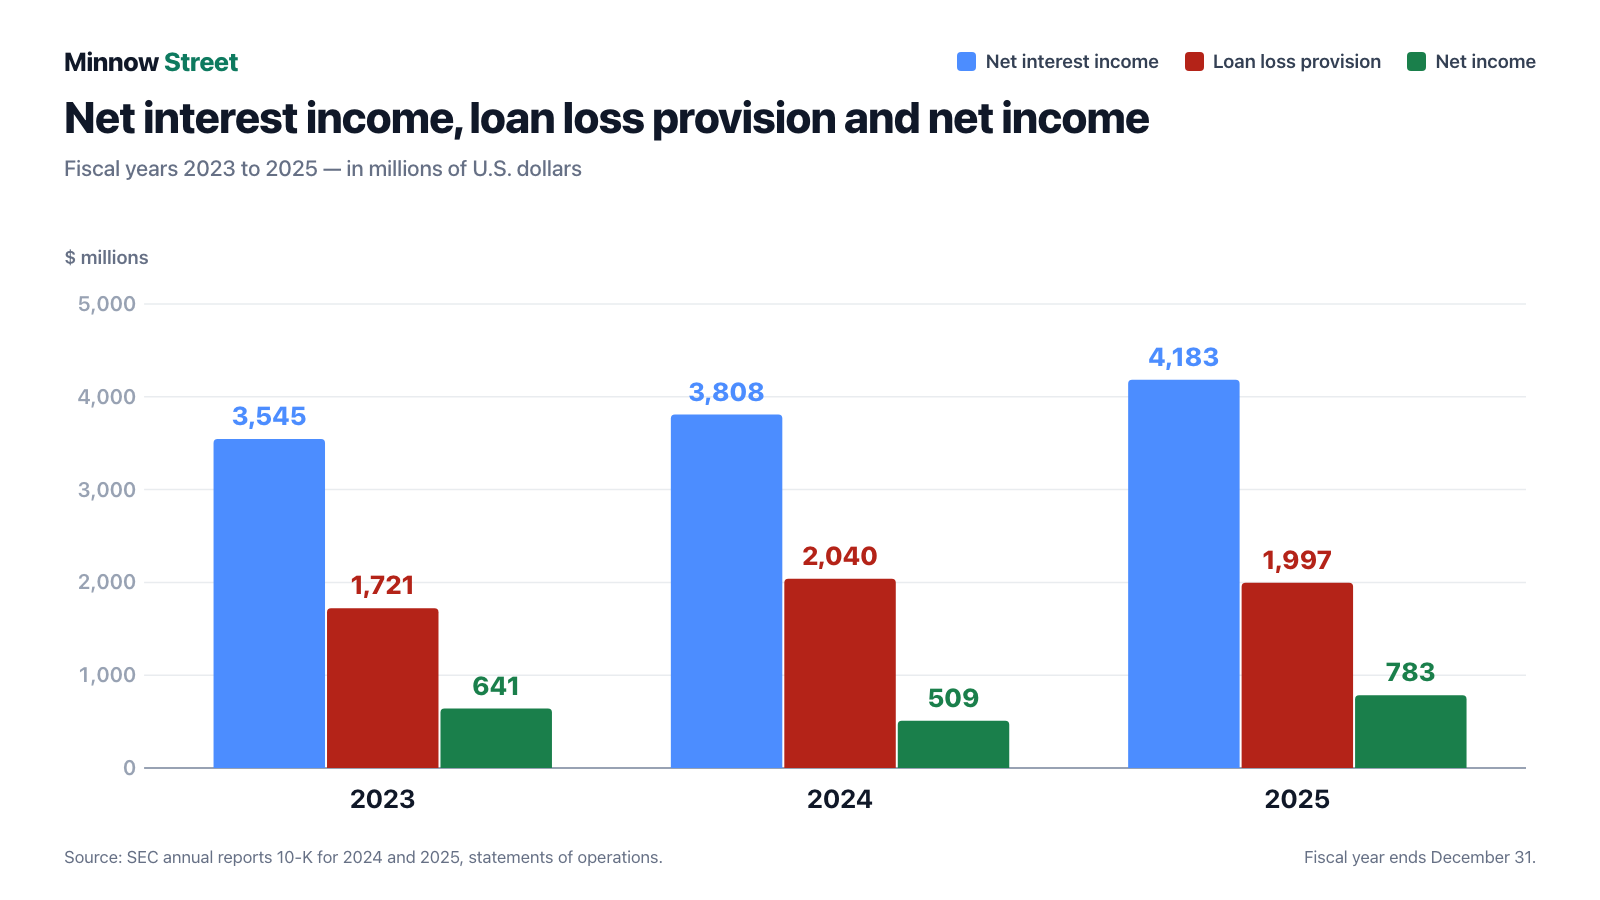
Start with what genuinely impresses. OneMain grows, and it has done so steadily. Net interest income rose from $3,545 million in 2023 through $3,808 million in 2024 to $4,183 million in 2025 — up 18 percent in two years. Net income dipped in 2024 ($509 million after $641 million) and jumped in 2025 to $783 million, the best result since 2022. Diluted earnings per share were $5.32 (2023), $4.24 (2024) and $6.56 (2025). The first quarter of 2026 continued the trend: $226 million of net income against $213 million a year earlier, $1.93 per share after $1.78.
Shareholders did well over the same stretch. The annual report includes its own stock performance table, and it is a clean, dated anchor: $100 invested on December 31, 2020 with dividends reinvested had become $236.43 by December 31, 2025. That is more than a doubling in five years, disclosed by the company itself. The dividend runs at $1.05 per share per quarter; the most recent one was declared on May 1, 2026 and paid on May 15, 2026. Across 2025 that added up to $499 million paid to shareholders, plus $141 million of share buybacks.
And the buybacks are real, not merely authorized. Shares outstanding fell from 119,360,509 (December 31, 2024) to 117,196,792 (December 31, 2025) and on to 115,627,261 at March 31, 2026 — 1,901,698 shares were retired in the first quarter of 2026 alone. On October 23, 2025 the board approved a new $1.0 billion repurchase program running to December 31, 2028. For a shareholder that means the slice of the pie gets bigger, not smaller — the opposite of dilution.
So much for the good news. Now the other side.
What the filings say — the uncomfortable truths
Uncomfortable truth no. 1: almost two thirds of the “free cash flow” is an add-back
Break down the $3,132 million of operating cash flow reported for 2025. Net income contributed $783 million. By far the largest single item, however, is the $1,997 million loan loss provision, added back because it cost no cash. That is roughly 64 percent of the entire operating inflow. Depreciation and amortization of $287 million and a handful of smaller items make up the rest.
The provision is not a fantasy number, though — it stands for loans that genuinely default. In fiscal 2025 OneMain charged off $2,190 million and recovered $353 million, so $1,837 million of loans were lost on a net basis. That money is really gone. It does not show up as an outflow in the cash flow statement only because it never came back: the principal collections that would have arrived are simply missing from investing activities. Adjust free cash flow for actual net charge-offs and you land near $1.3 billion. A price-to-free-cash-flow ratio of 2.17 then turns into something on the order of 5. Still not expensive — but an entirely different proposition.
Uncomfortable truth no. 2: operations and investing together cost money in 2025
The second step is the decisive one, and OneMain takes it in the annual report itself. Subtract what went into the loan book from the $3,132 million of operating cash flow and there is no surplus left — there is a minus:
“During the year ended December 31, 2025, OMH generated net income of $783 million. OMH’s net cash outflow from operating and investing activities totaled $29 million for the year ended December 31, 2025.”
— OneMain Holdings, Inc., SEC annual report 10-K for 2025, Item 7 MD&A, “Liquidity”

The cash flow statement shows how that comes about: $4,245 million flowed into new loans on a net basis and $1,096 million came back from sales of finance receivables; together with securities purchases and other items this produced an investing outflow of $3,161 million. Take $3,161 million from $3,132 million and you get minus $29 million.
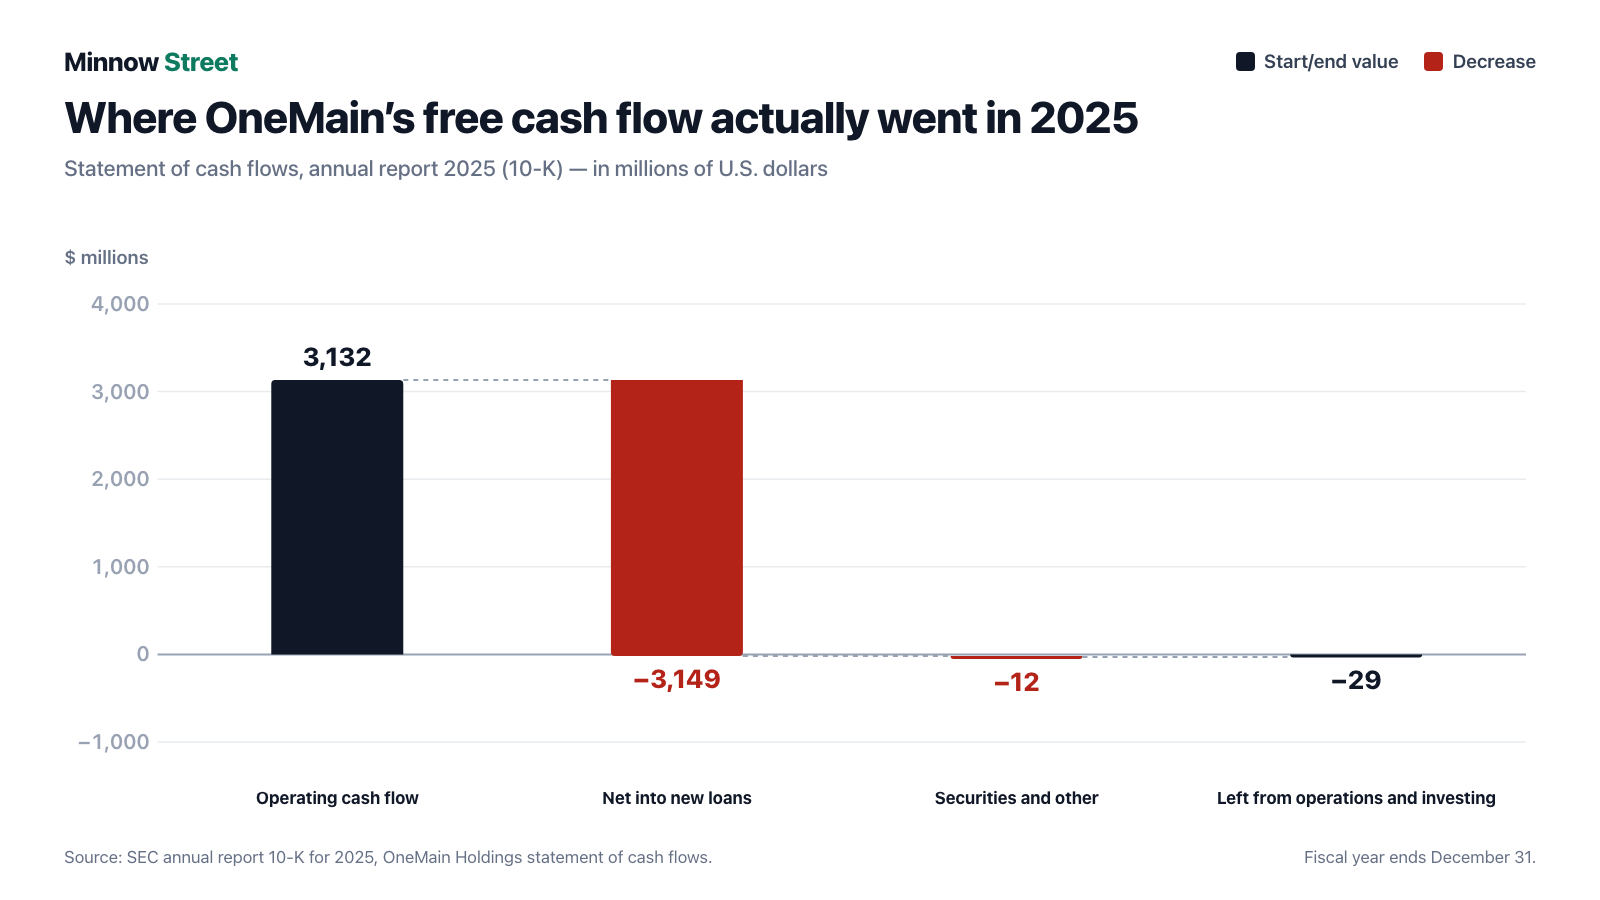
So where did the $499 million of dividends and $141 million of buybacks come from? From financing activities. In 2025 OneMain issued $7,972 million of debt and repaid $6,824 million — $1,148 million of net new borrowings. This is neither distress nor scandal: a growing lender funds a growing loan book in the capital markets, that is how the model works. But it is the honest answer to the question of which cash box the distribution comes out of. It does not come from a surplus thrown off by operations and investing — in 2025 there was none.
In fairness: the growth is voluntary. If OneMain simply stopped expanding its loan book, principal collections would exceed new originations and cash would pile up. That is exactly why the company is not comparable to a manufacturer that must replace machinery. Originating loans is closer to growth capital expenditure: deferrable, at the price of ending the growth. Buying OMF therefore means betting that the interest margin on an expanding book keeps beating the losses.
Uncomfortable truth no. 3: charge-offs are rising again — and the reserve is shrinking
The key metric at an installment lender is the net charge-off ratio: the share of the loan book written off during the year, measured against the average balance. At OneMain it was 7.48 percent in 2023, 8.12 percent in 2024 and 7.65 percent in 2025. The 2025 decline looked like relief. In the first quarter of 2026 the ratio rose again — to 8.41 percent after 8.16 percent a year earlier. The quarterly report names the reason:
“Provision for finance receivable losses increased $9 million or 2% in the three months ended March 31, 2026 when compared to the same period in 2025 due to growth in receivables and higher net charge-offs.”
— OneMain Holdings, Inc., SEC quarterly report 10-Q for March 31, 2026, Item 2 MD&A

The cushion is where it gets interesting. The allowance — money set aside for expected losses — fell in the first quarter of 2026 from $2,865 million to $2,819 million. The reason: the provision booked ($465 million) was smaller than actual net charge-offs ($511 million). Measured against quarterly net income of $226 million, that $46 million difference is not a footnote. In fairness: the allowance ratio held essentially flat at 11.53 percent (December 31, 2025: 11.54 percent) because the loan book grew at the same time. The cushion did not get thinner — it simply failed to grow with the book.
For exactly this question OneMain publishes its own metric, “pretax capital generation”: it takes adjusted pretax income, adds back the provision and deducts actual net charge-offs instead. In the first quarter of 2026 it came to $258 million — exactly the same as a year earlier, while reported net income rose 6.1 percent. That is a detail worth knowing before turning an earnings jump into a turning point.
Uncomfortable truth no. 4: more than half of the loan book is pledged
Securitization funding is cheap, but it has a price: pledged receivables are no longer freely available if things go wrong. The quarterly report quantifies it:
“At March 31, 2026, we had $12.7 billion of consumer loan gross finance receivables pledged as collateral for our securitizations, revolving conduit facilities, and private secured term funding facility.”
— OneMain Holdings, Inc., SEC quarterly report 10-Q for March 31, 2026, Item 2 MD&A, “Securitizations”

Against a loan book of $24,447 million (March 31, 2026) that is more than half. On the other side of the ledger sits a reassuring figure from the same filings: at December 31, 2025 OneMain held $11.8 billion of unencumbered receivables against scheduled principal and interest payments of $1.1 billion on unsecured debt for 2026. Coverage is comfortable. What matters is the structure: a lender with $3,401 million of equity against $27,388 million of total assets runs an equity ratio of 12.4 percent. If losses run higher than expected, they eat capital rather than margin — and quickly. How fast charged-off receivables turn into someone else’s business model is something we described at Encore Capital: its raw material is precisely what defaults at lenders like OneMain.
Valuation: at a lender, the charge-off rate decides
How expensive is OMF? Soberly assessed: not expensive. At a price-to-earnings ratio of roughly 8.9 on the trailing twelve months and roughly 8.0 on the current-year estimate, the market pays less than nine times annual earnings (data as of July 27, 2026). The price-to-book ratio is about 2.05, with book value a little above $29 per share. The market value of roughly $6.9 billion can be cross-checked: 115,533,440 shares outstanding as of the April 20, 2026 record date (from the current report of June 22, 2026) times a price in the neighborhood of $60 produces exactly that magnitude.
A price-to-book ratio above 2 is no bargain for a lender — banks often trade below 1. What is being paid for here is the return on equity, most recently around 24 percent. As long as the business earns a quarter of its equity each year, twice book is defensible. The decisive question is therefore not “how low is the P/E?” but: will the charge-off rate hold? A one percentage point increase on a loan book of roughly $24.4 billion costs about $244 million a year — against annual net income of $783 million that is nearly a third. That is where the leverage in this stock sits, in both directions.
Professional opinion leans friendly: 16 analyst votes break down into 8 strong buy, 3 buy and 5 hold, with no sell rating at all; the average price target is roughly $68 (data as of July 27, 2026). Consensus figures are not an argument but a mood reading — they show what is already priced in. More notable is what does not fit the usual templates. The Altman Z-score, a popular bankruptcy indicator for manufacturers, produces no meaningful reading at a lender, because receivables from customers replace fixed assets. Enterprise value and price-to-sales mislead for the same reason: at a lender, debt is raw material rather than risk in the ordinary sense.
And the dividend? At $1.05 per quarter and a price around $60, the yield is roughly 7 percent (data as of July 27, 2026). Measured against earnings it is covered: $4.20 of annual dividends against $6.56 of diluted earnings per share in 2025 is a payout ratio of a little over 60 percent. It is simply not covered by the cash left after the loan book — which, as shown, was negative in 2025.
Opportunities and risks at a glance
What speaks for OneMain Holdings:
- A core business that has grown and earned for years: net interest income of $3,545 million, $3,808 million and $4,183 million (2023 to 2025), net income of $783 million in 2025 and $226 million in the first quarter of 2026 after $213 million.
- Market leadership with a real moat: more than 1,300 branches in 44 states and approximately 9,300 employees — a distribution and collections apparatus a digital-only lender cannot rebuild in a few years; 53 percent of the loan book is secured.
- Shareholder-friendly capital allocation with substance: $499 million of dividends and $141 million of buybacks in 2025, share count cut from 119.4 million to 115.6 million (December 31, 2024 to March 31, 2026), a new $1.0 billion repurchase program running to the end of 2028.
- Documented total return: $100 invested on December 31, 2020 with dividends reinvested had become $236.43 by December 31, 2025 — a figure from the annual report itself.
- Solid funding position: $11.8 billion of unencumbered receivables at December 31, 2025 against $1.1 billion of scheduled principal and interest payments for 2026, plus $5.9 billion of undrawn conduit capacity at March 31, 2026.
What speaks against it:
- The headline metric does not hold: of the $3,132 million of operating cash flow in 2025, $1,997 million is the add-back of the loan loss provision; operations and investing combined produced a $29 million outflow according to the annual report.
- Distributions funded from the capital markets rather than surplus: $640 million of dividends and buybacks in 2025 stood against $1,148 million of net new borrowings.
- Credit quality turning again: a net charge-off ratio of 8.41 percent in the first quarter of 2026 after 8.16 percent a year earlier; actual net charge-offs of $511 million exceeded the $465 million provision and the allowance fell from $2,865 million to $2,819 million.
- High leverage: $3,401 million of equity against $27,388 million of total assets is a 12.4 percent equity ratio; one extra percentage point of charge-offs costs roughly $244 million a year.
- Concentration inside the growth: credit card receivables rose from $330 million (December 31, 2023) to $983 million (March 31, 2026) at an allowance ratio of 21.54 percent against 11.11 percent on consumer loans. On top of that, $12.7 billion of receivables are pledged.
A human conclusion
Back to the payout trap. Its point is not that OneMain’s dividend is unsafe — it is covered by earnings, the payout ratio sits a little above 60 percent, and the business earns real money year after year. Its point is that a punctual transfer spares us the question you have to ask at a lender: what does this actually live on? The answer is in the filings and it is less comfortable than the metric on the screen. OneMain earns a very wide interest margin on loans to people who cannot borrow elsewhere. About half of that margin goes to losses. What survives that is largely plowed straight back into the loan book so the business keeps growing. And what is paid out to you sat, in a year like 2025, right next to freshly issued debt.
That is not an accusation — it is the mechanics of every growing lender, and it is fully disclosed. But it changes the question you have to answer. It is not “isn’t a P/FCF of 2.17 dirt cheap?” It is: do you trust this company to keep losing around eight percent of its book a year — and what happens to your dividend if it becomes ten? Answer that and you have a thesis. Look only at the payout and you had a feeling. What you make of it is your decision. And that is exactly as it should be.
Sources
Every original document used in this analysis — read them yourself:
- OneMain Holdings, Inc. — SEC annual report 10-K for 2025 (filed February 6, 2026)
- OneMain Holdings, Inc. — SEC annual report 10-K for 2024 (filed February 7, 2025)
- OneMain Holdings, Inc. — SEC quarterly report 10-Q for March 31, 2026 (filed May 1, 2026)
- OneMain Holdings, Inc. — SEC quarterly report 10-Q for September 30, 2025 (filed October 31, 2025)
- OneMain Holdings, Inc. — SEC current report 8-K of June 22, 2026 (annual meeting of June 16, 2026)
- U.S. Securities and Exchange Commission — full filing history for CIK 0001584207 (EDGAR)
- Valuation metrics and analyst votes: source fundamental data & SEC filings (annual and quarterly reports, 10-K/10-Q), data as of July 27, 2026
Disclaimer: This article is journalistic analysis of publicly available corporate filings. It is not investment advice and not a solicitation to buy or sell securities. Share prices can move sharply; a total loss of invested capital is possible. All figures come from the sources named above and carry the reporting date stated there; valuation metrics change with the share price. The author holds no position in OneMain Holdings, Inc. at the time of publication.
Our Bottom Line at a Glance
- Core business positive
- Market leader in installment lending to nonprime borrowers: more than 1,300 branches in 44 states, approximately 9,300 employees, 2.4 million personal loans totaling $21.43 billion, 53 percent of them secured (December 31, 2025). Net interest income rose from $3,545 million (2023) through $3,808 million (2024) to $4,183 million (2025), and the yield on consumer loans ran at 22.60 percent in the first quarter of 2026.
- Earnings power positive
- Net income recovered to $783 million in 2025 after $509 million (2024) and $641 million (2023); $6.56 diluted per share. The first quarter of 2026 followed with $226 million after $213 million a year earlier. Return on equity most recently ran at about 24 percent (data as of July 27, 2026).
- Validity of the hook negative
- The price-to-free-cash-flow ratio of 2.17 (measured July 27, 2026, scanner run of July 26, 2026) measures the interest margin before losses at an installment lender. Of the $3,132 million of operating cash flow in 2025, $1,997 million is the add-back of the loan loss provision. The annual report itself reports a $29 million net outflow from operating and investing activities combined. Adjusted for actual net charge-offs of $1,837 million, the ratio lands on the order of 5.
- Credit quality negative
- The net charge-off ratio rose to 8.41 percent in the first quarter of 2026 after 8.16 percent a year earlier (full years 7.48 / 8.12 / 7.65 percent for 2023 to 2025). Actual net charge-offs of $511 million exceeded the $465 million provision, and the allowance fell from $2,865 million to $2,819 million. The company’s own pretax capital generation metric stagnated at $258 million while reported net income rose 6.1 percent.
- Balance sheet and funding neutral
- The equity ratio is 12.4 percent ($3,401 million of $27,388 million at December 31, 2025), and $12.7 billion of consumer loan receivables are pledged (March 31, 2026). Against that sit $11.8 billion of unencumbered receivables versus $1.1 billion of scheduled principal and interest payments for 2026, plus $5.9 billion of undrawn conduit capacity. Dividends ($499 million) and buybacks ($141 million) stood against $1,148 million of net new borrowings in 2025.
- Shareholder returns positive
- Shares outstanding fell from 119,360,509 (December 31, 2024) through 117,196,792 (December 31, 2025) to 115,627,261 (March 31, 2026); a new $1.0 billion repurchase program running to December 31, 2028 was authorized on October 23, 2025. The quarterly dividend is $1.05 per share and the payout ratio a little over 60 percent of 2025 diluted earnings. $100 invested on December 31, 2020 with dividends reinvested had become $236.43 by December 31, 2025 (figure from the annual report).
OneMain Holdings is a profitable market leader with a headline metric that measures something other than its name suggests. Of $3,132 million of operating cash flow in 2025, $1,997 million is the add-back of the loan loss provision; operations and investing combined produced a $29 million outflow according to the annual report. Dividends and buybacks totaling $640 million stood against $1,148 million of net new borrowings. Against that sits a real, growing business: $4,183 million of net interest income, $783 million of net income, more than 1,300 branches, a share count reduced by almost 4 million and a payout ratio a little over 60 percent. The leverage sits entirely in the charge-off rate, which climbed to 8.41 percent in the first quarter of 2026. Not investment advice.
What Our Rating Means
Open questions
The business works in principle, but one material question is open. As long as it stays open, our findings do not carry a quality verdict.
Yellow here stands for valuation and cycle risk, not a threat to substance. Against red: $783 million of net income in 2025, $226 million in the first quarter of 2026, $11.8 billion of unencumbered receivables against $1.1 billion of scheduled payments for 2026, a dividend covered by earnings and a falling share count. Against green, equally documented: the net charge-off ratio rose to 8.41 percent in the first quarter of 2026, the allowance fell from $2,865 million to $2,819 million because losses exceeded the provision, the equity ratio is 12.4 percent, and operations and investing together produced a $29 million net outflow in 2025.
A journalistic assessment by our editorial team at the time of the deep dive, based on public sources — not investment advice and not a solicitation to buy or sell. Your personal circumstances (investment goals, risk capacity, taxes) cannot be taken into account. What our levels mean, how verdicts are formed, and what conflicts of interest exist →
Worth Noting
- Hook: rank 46 in our in-house P/FCF ranking with the U.S. market filter at a price-to-free-cash-flow ratio of 2.17. The scanner page shows only the 25 strongest hits — OneMain is not among them; 544 stocks passed the criteria in total. Measured July 27, 2026, underlying scanner run of July 26, 2026; the lists are recalculated daily.
- Data basis: annual report 10-K for 2025 (filed February 6, 2026), quarterly report 10-Q for March 31, 2026 (filed May 1, 2026), current report 8-K of June 22, 2026; valuation metrics and analyst votes as of July 27, 2026.
- Risk of confusion: the listed company was named Springleaf Holdings, Inc. until November 9, 2015; the subsidiary OneMain Finance Corporation (OMFC) reports inside the same 10-K, which is why some figures appear twice and differ slightly (2025 net income: $783 million for OMH, $782 million for OMFC).
- Meaningless at a lender: Altman Z-score, enterprise value and price-to-sales. The balance sheet consists almost entirely of receivables from customers, and debt is the raw material of the business.
Frequently Asked Questions
OneMain Holdings is the largest U.S. provider of personal installment loans to nonprime borrowers. It offers secured and unsecured installment loans with level payments, auto finance through dealerships, the BrightWay credit card and optional insurance products. At December 31, 2025 it operated more than 1,300 branches in 44 states with approximately 9,300 employees and held roughly 2.4 million personal loans totaling $21.43 billion.
Because operating cash flow for 2025 was $3,132 million while the market value is only about $6.9 billion. At an installment lender, though, the metric measures the interest margin before losses: the $1,997 million loan loss provision is added back as a non-cash item, and both originations and principal collections run through investing activities. Adjusted for actual net charge-offs of $1,837 million, the ratio lands on the order of 5.
No. Measured on July 27, 2026, OneMain sits at rank 46 of the U.S. selection sorted by price-to-free-cash-flow, but the scanner page displays only the 25 strongest hits. In total, 544 stocks passed the ranking criteria that day. The row becomes visible through the screener, sorted by price-to-free-cash-flow ascending with the U.S. market filter.
Out of earnings — but not out of a cash surplus. In 2025, $499 million of dividends and $141 million of buybacks flowed out. In the same year, operating and investing activities together produced a $29 million outflow according to the annual report, while net new borrowings came to $1,148 million. Against diluted earnings per share of $6.56, the payout ratio is a little over 60 percent.
The net charge-off ratio was 7.48 percent in 2023, 8.12 percent in 2024 and 7.65 percent in 2025 of the average loan balance. In the first quarter of 2026 it rose to 8.41 percent after 8.16 percent a year earlier. In dollars, $2,190 million was charged off in 2025 and $353 million recovered, leaving $1,837 million of net losses.
No. Since 2024 the filing history with the U.S. securities regulator, the SEC, contains no merger registration statement (Form S-4), no merger proxy and no tender offer (SC TO or SC 14D9). There is no delisting notice (Form 25) or deregistration (Form 15) either; the stock trades on the New York Stock Exchange. The last name change was the renaming from Springleaf Holdings, Inc. to OneMain Holdings, Inc. on November 9, 2015.
No. The Altman Z-score was built for manufacturers and relates current assets, fixed assets and sales to total assets. At a lender the balance sheet consists almost entirely of receivables from customers, and debt is raw material rather than a warning sign. The meaningful figures are the net charge-off ratio (8.41 percent in the first quarter of 2026), the allowance ratio (11.53 percent) and the equity ratio (12.4 percent at December 31, 2025).
Found an error?
Did you spot a factual error, an outdated number, or a typo in this deep dive? Let us know briefly — your report goes straight to the editorial team.