StoneX Stock: $132 Billion in Revenue Is an Optical Illusion — the Doubled Profit Is Not
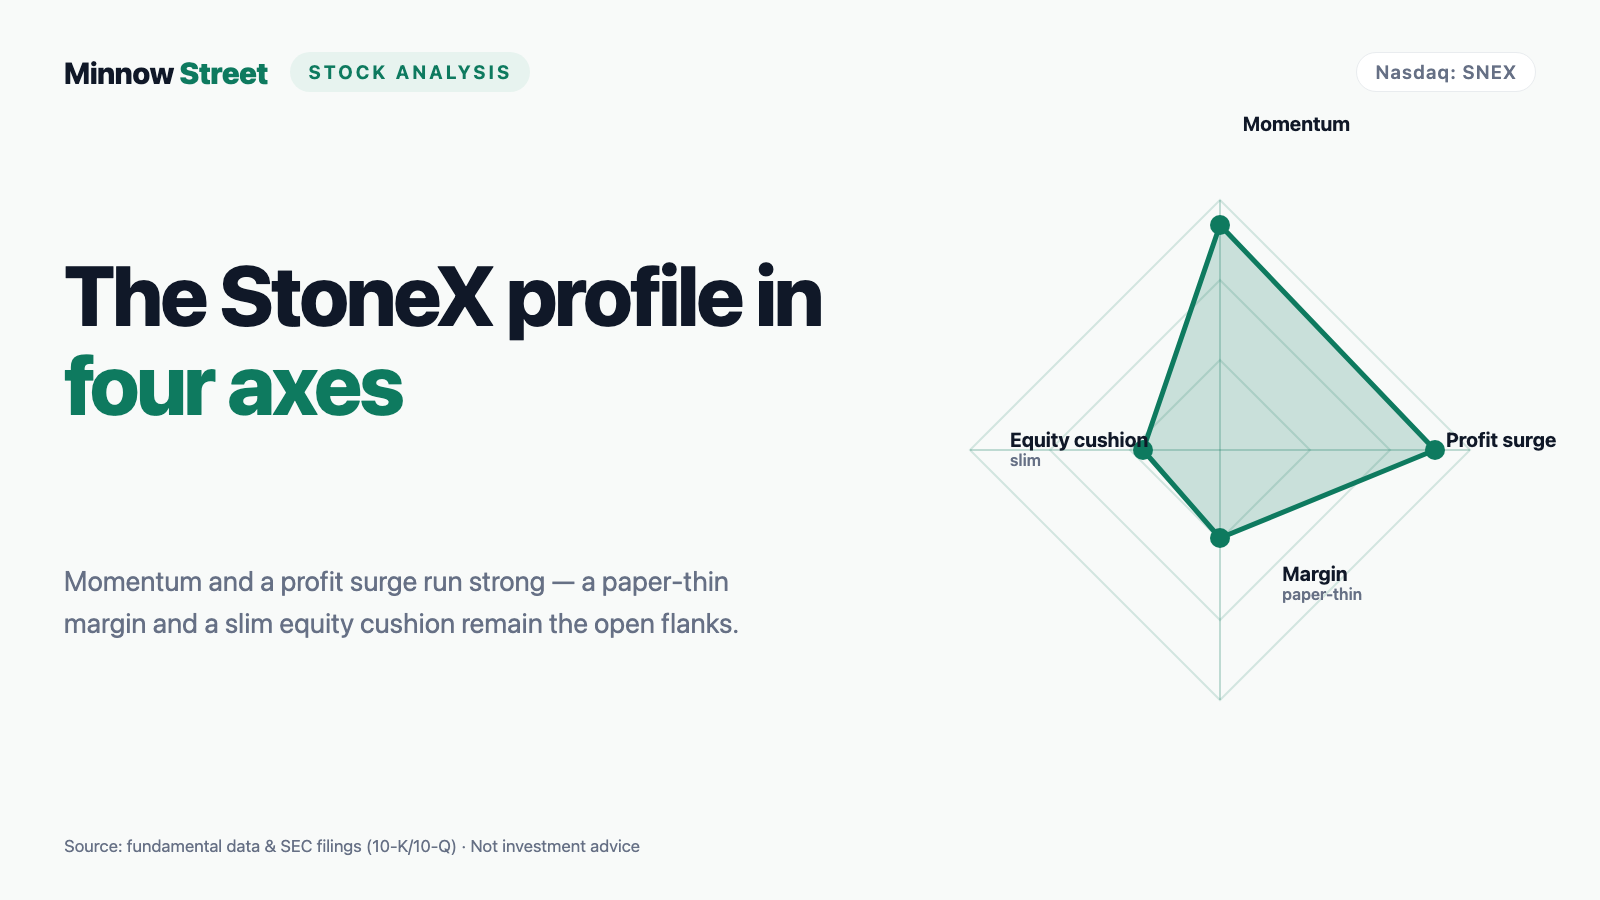
StoneX clears and brokers trades across more than 40 derivatives exchanges — and lights up 24 filters in our in-house stock scanner, led by stage-2 momentum (scanner run of July 17, 2026; metrics data as of July 10, 2026). We read the annual reports (10-K) for fiscal years 2024 and 2025 and the quarterly report (10-Q) as of March 31, 2026: "revenues" of $132.4 billion of which $128.3 billion flow right back out, an interest engine running on client money, a half-year profit above the entire prior year, a billion-dollar acquisition — and bad debts that jumped a hundredfold in the latest quarter. Not investment advice — just a field guide to a balance sheet that looks bigger than it is.
 Thomas Mücke
Founder & Publisher
Thomas Mücke
Founder & Publisher
Chart
Interactive price chart (TradingView).
Note: pure fact-based analysis, not investment advice and not a solicitation to buy or sell. All figures without guarantee.
There is an investor trap that catches the diligent ones in particular: the anchor trap. It works like this: the first number you see drops an anchor in your head — and everything that follows gets measured against that anchor instead of against reality. Hardly any stock sets this trap as perfectly in the summer of 2026 as StoneX Group Inc. (Nasdaq: SNEX). A glance at the screener shows a price-to-sales ratio of 0.07 — a $10.9 billion company that supposedly costs 0.07 times its revenue. The anchor says: bargain of the decade. At the same time, the stock sits near its high after gaining 136 percent in twelve months and fills the momentum columns of our in-house stock scanner (scanner run of July 17, 2026). Dirt cheap and red hot — that combination does not really exist. So let's make a deal: before the anchor takes hold, we read together what the company itself reported, under penalty of law, to the U.S. securities regulator, the SEC — the annual reports (10-K) for fiscal years 2024 and 2025 and the quarterly report (10-Q) as of March 31, 2026. And this one explains, right in its opening pages, why the most tempting number in the shop window is an optical illusion. In the end, you decide for yourself.
What StoneX actually does — and for whom
StoneX is something like the wholesale market hall of the financial world: not the power plant, not the factory, but the hall where others trade — earning a few cents on every handshake. Per the annual report (10-K) for fiscal year 2025, the group connects its clients to over 40 derivatives exchanges, 180 foreign exchange markets and more than 18,000 over-the-counter markets. Concretely, StoneX executes buy and sell orders (brokerage), settles them and guarantees their performance (clearing), quotes its own bid and ask prices (market making), moves cross-border payments into emerging markets (payments) — and, on top of that, trades real, physical commodities: grain, energy, precious metals, own warehouses included. Four segments sort the business by client type: Commercial (agricultural, energy and metals firms hedging their price risks), Institutional (banks, funds, broker-dealers), Self-Directed/Retail (individual investors, including forex and precious metals trading) and Payments. The roots go back to Saul Stone in 1924; until June 2020 the company traded as INTL FCStone (before that, International Assets Holding). Today it sits at 230 Park Avenue in New York, employs more than 5,400 people and is led by CEO Philip A. Smith. One calendar quirk belongs right at the start: the fiscal year ends September 30 — "fiscal year 2025" here means October 2024 through September 2025. Which brings us to the central tension of this analysis, and it runs through every chapter: the profits are real, growing fast and just delivered a record half-year — but the reported revenue is an optical illusion, the margin on it is paper-thin, and the business model lives on interest earned on other people's money and on the trust that clients pay their bills. How a business with giant revenues and a mini margin works is something we dissected at the fuel distributor Global Partners — and what happens when a financial firm underestimates its clients' credit risk, at Affirm.
Where the stock shows up in our scanner
Every day we run about 3,500 stocks through our scanners. StoneX reached the research list through the momentum run of July 17, 2026 — with 24 hits, one of the broadest confluences of the summer (metrics data as of July 10, 2026). The trend filters are almost fully lit: a Stan Weinstein stage-2 uptrend (price above a rising 200-day average), stage-2 leaders, RS leaders ≥90 (the stock beats 90 percent of the market; its RS rating stands at 95), RS new highs, near 52-week high, the Mark Minervini trend criteria and EPS acceleration (earnings per share growing faster quarter after quarter). Behind that stand plus 48 percent in three months, plus 77 percent in six and roughly plus 136 percent over twelve months. To replicate it yourself: open the StoneX stock page or browse the stage-2 scanner. What is remarkable this time is the fundamental lens of the very same scanner: a fundamental grade of B, a Piotroski F-score of 6 of 9 (a nine-point test of the direction of the books — 6 means more metrics improving than deteriorating), a trailing price-to-earnings ratio around 24 — and that price-to-sales ratio of 0.07 that flushes StoneX to the top of the scanner's cheapness rankings. This is exactly where the real story begins. Remember the principle: a number that looks too good to be true is usually not information — it is a question nobody has asked yet.
The numbers over the years — honestly appraised
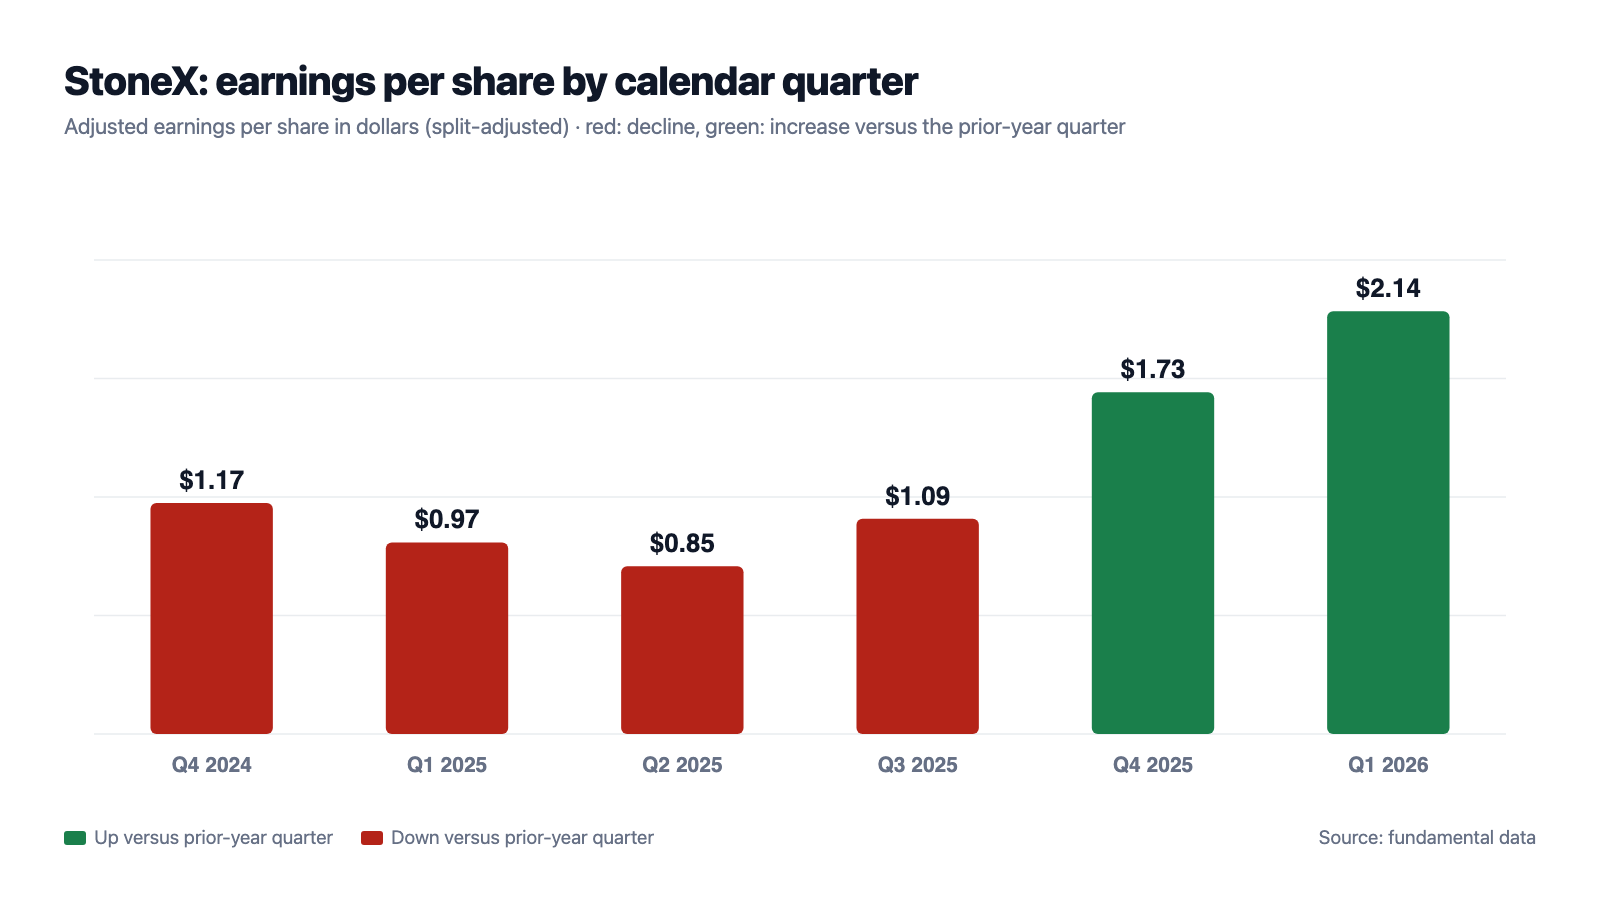
First, what genuinely impresses — and that is plenty. StoneX does not just make money, it makes more and more money: $238.5 million in net income in fiscal year 2023, $260.8 million in fiscal year 2024, $305.9 million in fiscal year 2025 — with a return on equity of 15.6 percent most recently. Operating revenues (more in a moment on why we use this figure and not "revenue") grew over the same span from $2,914.1 million through $3,436.2 million to $4,126.9 million — plus 20 percent in fiscal year 2025 alone. Then the current fiscal year 2026 arrived and hit the turbo: in the first half (October 2025 through March 2026), operating revenues jumped 58 percent to $3,005.0 million and net income doubled to $313.3 million — more than in the entire fiscal year 2025. The January-through-March 2026 quarter alone: operating revenues up 64 percent to $1,566.8 million, net income up 143 percent to $174.3 million, diluted earnings per share up from $0.94 to $2.07. Part of that is store-bought — R.J. O'Brien, acquired on July 31, 2025, contributed $213.5 million of the quarter's operating revenues — but even without the deal, growth would be double-digit. The board celebrated in its own way: with the second 3-for-2 stock split within twelve months (March 21, 2025 and March 20, 2026, each executed as a stock dividend). If you read only this paragraph, the 24 scanner hits make immediate sense. Now look at what the same filings say about "revenue":
What the filings say — the uncomfortable truths
Uncomfortable truth no. 1: The $132 billion revenue line is a flow-through pipe — management says so itself
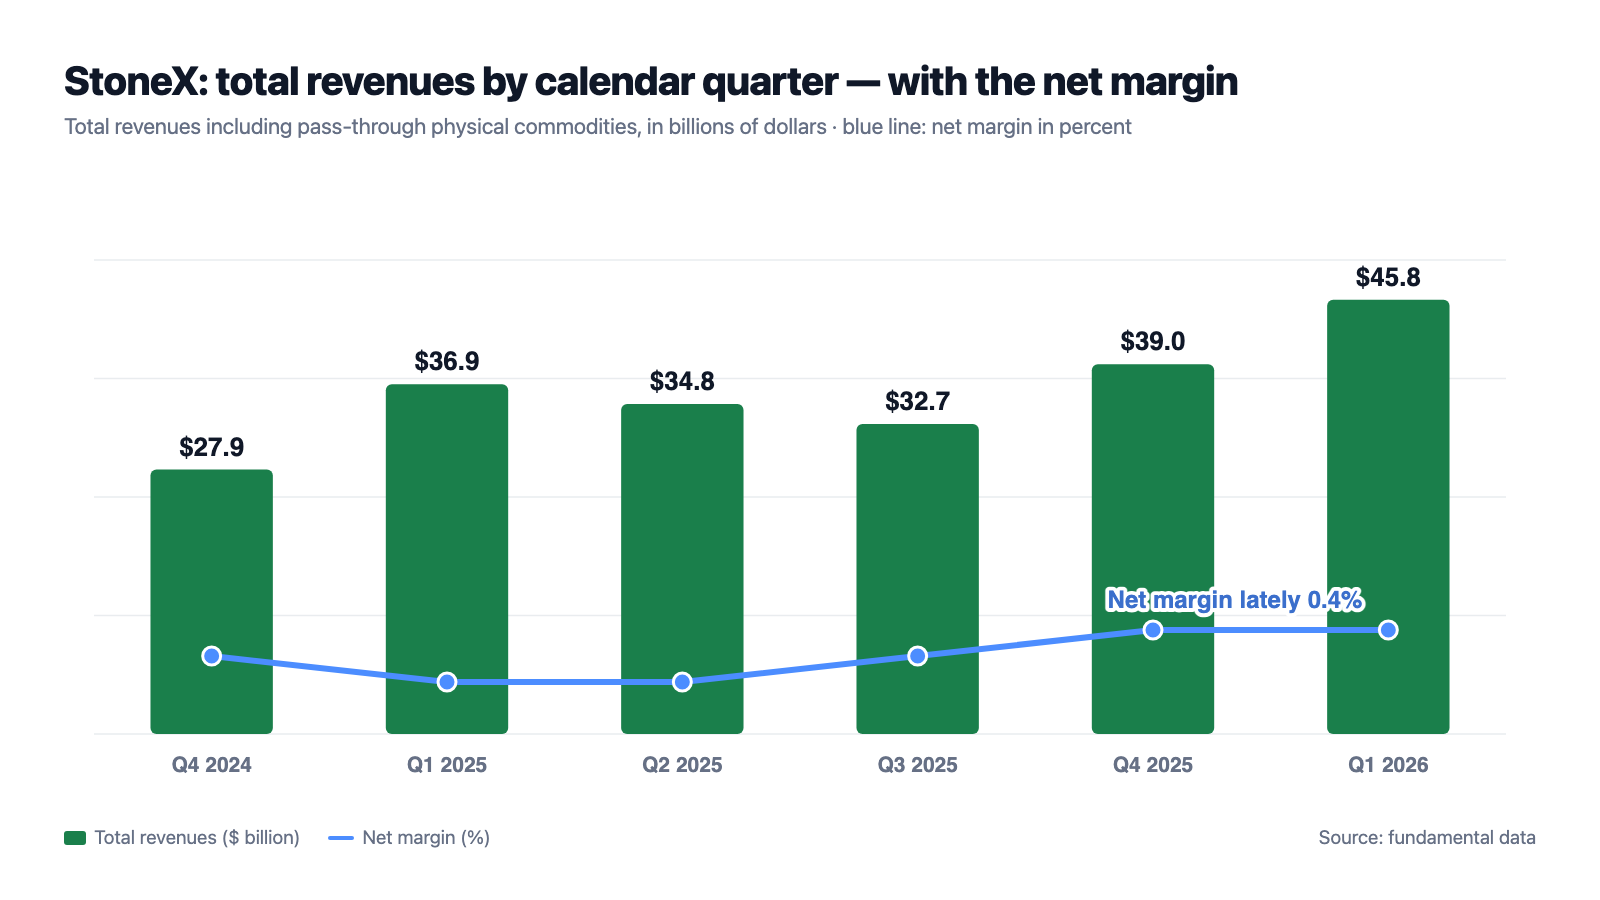
In fiscal year 2025, StoneX reported $132,378.2 million in total revenues — $132.4 billion, more than most household-name industrial giants. But $128,462.6 million of that was "sales of physical commodities" — physical goods sold, matched by $128,251.3 million in cost of those goods: gold, grain or gasoil gets bought, passed along, sold — and the full merchandise value runs gross through the revenue line. That is neither a trick nor a scandal; it is the accounting treatment for the physical business. What matters is that the company frames it exactly that way itself:
"Our total revenues, as reported, combine gross revenues for the physical commodities business and net revenues for all other businesses. Management believes that operating revenues, which deduct the cost of sales of physical commodities from total revenues, is a more useful financial measure with which to assess our results of operations."
— StoneX Group Inc., SEC annual report 10-K for fiscal year 2025, Item 7 "Management's Discussion and Analysis"

So let's re-set the anchor from the opening: the meaningful revenue base is the $4,126.9 million in operating revenues — and on that basis, StoneX costs not 0.07 times but roughly 2.7 times its revenues. The bargain of the decade turns into a normally valued financial stock. The same illusion sits inside the margin: measured against total revenues, StoneX nets 0.2 to 0.4 percent — measured against operating revenues, a respectable 7.4 percent (fiscal year 2025). Remember the image: StoneX operates a toll booth, not a trucking fleet — the billions rolling through the gate belong to its clients; only the toll belongs to StoneX.
Uncomfortable truth no. 2: A substantial profit driver is interest on other people's money — and the Fed holds the dial
What does the toll booth live on? Commissions and spreads — but to a striking degree also on something that has nothing to do with trading at all: interest on client money. Whoever trades through a futures broker posts collateral; those billions sit with StoneX and are invested at interest. In fiscal year 2025, interest income added up to $1,734.3 million — on a gross basis roughly 42 percent of operating revenues (part of it is passed back out as interest expense, for instance in securities financing). The R.J. O'Brien acquisition made this engine bigger still: per the quarterly report it brought $6.4 billion in additional average client equity — average client balances rose 110 percent in the January-through-March 2026 quarter. What happens when the Federal Reserve cuts rates is described in the risk factors with disarming directness:
"Low short-term interest rates negatively impact our profitability. We earn interest and fee income on client balances left on deposit with us. We have generated significant interest-related revenue in both the current and prior periods and a decline in short-term interest rates or a decline in the amount of client funds on deposit may have a material adverse effect on our profitability in the future."
— StoneX Group Inc., SEC annual report 10-K for fiscal year 2025, Item 1A "Risk Factors"

To be fair: the same report describes countermeasures — StoneX hedges part of its interest result with interest rate swaps, and in the latest quarter, interest and fee income earned on client balances grew by $54.8 million despite lower policy rates, because the acquired RJO billions more than offset the rate decline. But the mechanics remain: a noticeable share of the profit hangs on a dial that is turned in Washington — and the growth story in client balances is partly a shopping story.
Uncomfortable truth no. 3: Bad debts jumped a hundredfold in the latest quarter — from $0.1 million to $12.4 million
Whoever guarantees trades is on the hook when a client fails to pay. That is the base risk of every clearing firm, and most of the time it is invisible: in the January-through-March 2025 quarter, StoneX booked a mere $0.1 million in bad debts. One year later, the same line looked like this:
"During the three months ended March 31, 2026, we recorded bad debts, net of recoveries of $12.4 million, principally related to bad debt expense from client receivables in the Global Metals and Supply & Trading businesses of our Commercial segment of $8.0 million and $2.1 million, respectively, as well as from client trading deficits in our Institutional, Self-Directed/Retail, and Commercial segments of $1.5 million, $0.5 million, and $0.4 million, respectively, which were partially offset by recoveries of $0.1 million."
— StoneX Group Inc., SEC quarterly report 10-Q as of March 31, 2026, Item 2 "Management's Discussion and Analysis"
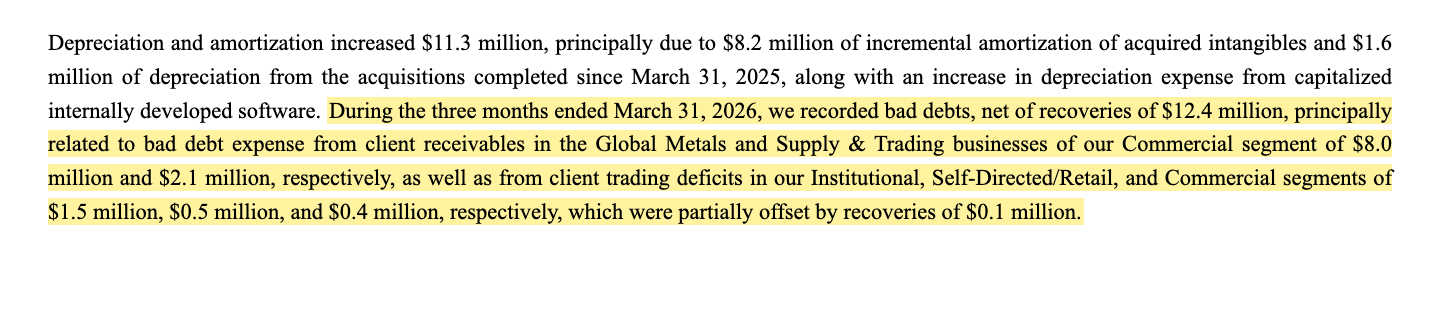
Context without alarmism: $12.4 million against $174.3 million in quarterly net income is absorbable — a scratch, not a leak. But the scratch shows where the planks are thin. The risk factors section lists at length what can go wrong: clients missing margin calls, counterparties failing, clearing members whose default gets mutualized across everyone else — "We are exposed to counterparty credit risk whereby the failure by persons with whom we do business to meet their financial obligations could adversely affect our business" (10-K for fiscal year 2025, Item 1A). And this is where the structural engineering comes in: StoneX moves a $53.6 billion balance sheet on roughly $2.7 billion of equity (March 31, 2026) — an equity ratio of about 5 percent. For a brokerage group whose balance sheet largely consists of client balances and collateralized securities transactions, that is industry-standard, and segregated client funds are not StoneX's property. But translated it also means: the safety net under the $53 billion high-wire act is about 5 percent thick — this business model forgives many small mistakes and not one big one.
Uncomfortable truth no. 4: Growth is partly store-bought — paid for with new debt and new shares
StoneX is a serial acquirer: in fiscal year 2025 alone, the group closed five acquisitions that together added $238.0 million of new goodwill to the balance sheet — among them the investment bank Benchmark and, above all, the largest deal in company history:
"On July 31, 2025, we completed our acquisition RTS Investor Corp., which was the parent company for the R.J. O'Brien global business (‘RJO'), including R.J. O'Brien & Associates, LLC, the oldest futures brokerage in the U.S., and selected affiliates. The purchase price consideration was paid in a combination of cash of approximately $651.9 million and the issuance of 3,085,554 shares of the Company's common stock, which were reissued from treasury stock. At closing, we assumed approximately $125.7 million of RJO debt related to a RJO subordinated debt facility."
— StoneX Group Inc., SEC annual report 10-K for fiscal year 2025, Item 7 "Recent Events"
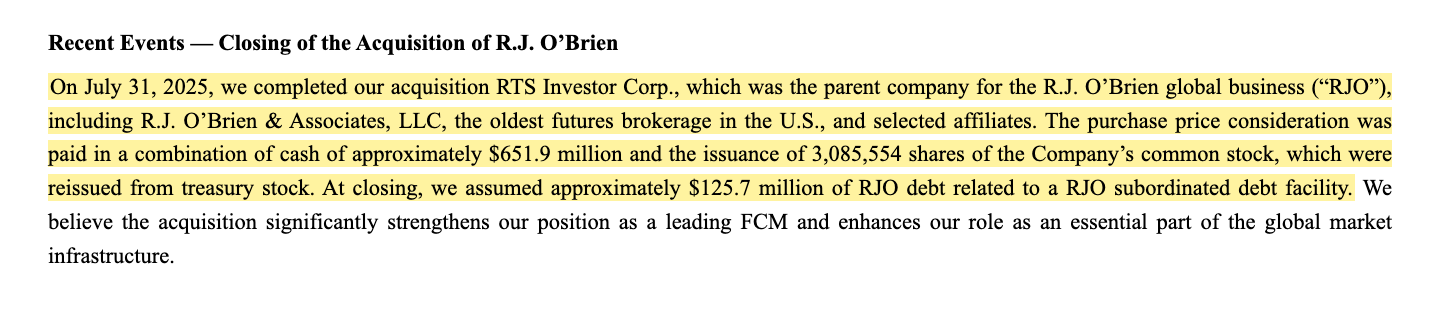
The deal was also funded with fresh debt: on July 8, 2025, StoneX issued $625 million of 6.875% senior secured notes due 2032 — on top of the existing 7.875% notes due 2031; per the annual report, the indentures restrict dividends and buybacks, among other things. And shareholders paid their share too: the diluted weighted-average share count rose from 73.5 million in the first half of fiscal year 2025 to 81.0 million in the first half of 2026 — roughly 10 percent more slices of the cake for every future profit to be spread across (RJO shares plus stock compensation). The report itself stays dry: "Acquisitions give rise to unforeseen issues" (10-K for fiscal year 2025, Item 1A). So far, the numbers argue for management's skill as a buyer: RJO contributed $414.5 million of operating revenues in the half-year, and the integration is delivering. But it is worth keeping the two things apart: part of the 58 percent growth is organic, part of it is simply purchased — paid for with interest costs and dilution that will remain when the momentum fades.
Valuation: a $10.9 billion market value — and the question of which lens counts
As of the July 10, 2026 data cut-off, the StoneX share cost about $137.30, for a market value of roughly $10.9 billion on 79.0 million shares outstanding (March 31, 2026). Through the screener lens, that is either dirt cheap or rich depending on the row: price-to-sales of 0.07 (an illusion, see above), price-to-cash-flow around 1.4 (notoriously distorted at brokers, because client money movements wash through the cash flow statement) — but a trailing price-to-earnings ratio around 24 and a price-to-book ratio around 4. For a financial group earning a 15.6 percent return on equity, four times book is no longer a bargain; it is an advance on further rising profits. Then again: if the first half's profit surge ($3.74 in diluted earnings per share in six months) even roughly holds, the P/E deflates quickly. StoneX pays no dividend, by the way — per the annual report it has never declared a cash dividend; every dollar goes into the business and into acquisitions, and the note indentures put additional limits on payouts. The side signals are worth noting: institutional investors hold about 86 percent of the shares, insiders a good 9 percent — but in recent months 13 insider sales stood against a single purchase, including sales by the CEO (data as of July 10, 2026). After a 136 percent run and two stock splits that is no scandal, rather human — but it is the opposite of a buy signal from the people who know the shop best. And it is remarkably quiet around the stock: our data set covers just two analyst estimates for StoneX — for a $10.9 billion company that is almost small-cap solitude, and it cuts both ways: undiscovered or avoided.
Opportunities and risks at a glance
What speaks for StoneX:
- A profit run with substance: net income of $238.5, $260.8 and $305.9 million in fiscal years 2023 through 2025, and already $313.3 million in the first half of fiscal year 2026 — more than in the entire prior year; return on equity of 15.6 percent (fiscal year 2025).
- A scale network with moat-like traits: access to over 40 derivatives exchanges, 180 FX markets and 18,000 OTC markets; four client segments spread the business across agriculture, energy, metals, securities, FX and payments.
- The RJO acquisition strengthens the core: the oldest futures brokerage in the U.S., $6.4 billion in additional average client equity, $414.5 million in operating revenues in the first half — the integration is measurably delivering so far.
- Technicals and scanner confluence: 24 hits, a Stan Weinstein stage-2 uptrend, an RS rating of 95, plus 48/77/136 percent over three, six and twelve months; plus a fundamental grade of B and a Piotroski score of 6 of 9 (data as of July 10, 2026).
- Shareholder-friendly signals of its own kind: two 3-for-2 stock splits within twelve months (March 2025, March 2026) and a management team that prefers reinvesting profits over paying them out.
What speaks against it:
- The shop-window metrics mislead: $132.4 billion in "revenues" is 97 percent merchandise flow-through; the net margin on it is 0.2 to 0.4 percent, and the real price-to-revenue ratio sits around 2.7, not 0.07.
- Interest rate dependence: $1,734.3 million of interest income in fiscal year 2025; the company's own risk factors warn that declining short-term rates or shrinking client deposits may have a "material adverse effect" on profitability.
- Credit and counterparty risk on a thin cushion: bad debts jumped from $0.1 million to $12.4 million in the January-through-March 2026 quarter ($8.0 million of it in Global Metals); a $53.6 billion balance sheet rests on roughly $2.7 billion of equity (about a 5 percent ratio).
- Growth on credit and with dilution: $625 million of new 6.875% notes due 2032 on top of the existing 7.875% notes due 2031, with restrictive covenants; the diluted share count rose about 10 percent within a year.
- Insiders are selling into the rally: 13 sales against 1 purchase, including the CEO (data as of July 10, 2026); a trailing P/E around 24 and four times book leave little room for disappointment.
A human conclusion
Back to the anchor trap from the opening. Its poison is not that the anchor is wrong — the 0.07 price-to-sales ratio really does appear in the screener. Its poison is that it answers the wrong question. The right question at StoneX is not "how cheap is the revenue?" but: "What is left of $132 billion, who owns the money in between, and what can happen to it along the way?" The honest answers from the filings: what is left is $4.1 billion in operating revenues and, most recently, record profits growing faster than the market expected. The money in between belongs to the clients, and StoneX earns on it twice — on the toll and on the interest. And plenty can happen to it: a rate-cutting cycle, a large client default, an acquisition that chokes. Whoever buys the stock after a 136 percent run is not buying an undiscovered 0.07 bargain — but a well-oiled, highly leveraged financial toll-booth operator at four times book value, with real momentum and real structural risks. Both at once. The anchor from the opening has no answer to that; the filings do. What you make of it is your decision. And that is exactly as it should be.
Sources
All original documents used in this analysis — for your own reading:
- StoneX Group Inc. — SEC annual report 10-K for fiscal year 2025 (ended September 30, 2025; filed November 28, 2025)
- StoneX Group Inc. — SEC annual report 10-K for fiscal year 2024 (ended September 30, 2024; filed November 29, 2024)
- StoneX Group Inc. — SEC quarterly report 10-Q as of 03/31/2026 (filed May 6, 2026)
- StoneX Group Inc. — SEC quarterly report 10-Q as of 12/31/2025 (filed February 4, 2026)
- Complete SEC filing history of StoneX Group Inc.: EDGAR overview (sec.gov)
- Fundamental data (metrics, quarterly series, valuation; data as of July 10, 2026), cross-checked against the SEC filings.
- Screener and rating data: in-house stock scanner (momentum run of July 17, 2026; metrics data as of July 10, 2026).
Transparency & disclaimer: This analysis is a journalistic contextualization of publicly available information and is not investment advice, not a financial analysis in the regulatory sense and not a solicitation to buy or sell securities. Stock investments carry substantial risks up to and including total loss. All information without guarantee; the data cut-off is noted in the text. The author holds no position in StoneX shares at the time of publication.
Our Bottom Line at a Glance
- Growth & earnings power positive
- Net income of $238.5, $260.8 and $305.9 million in fiscal years 2023 through 2025, return on equity of 15.6 percent — and $313.3 million already earned in the first half of fiscal year 2026, more than in the entire prior year; operating revenues up 64 percent in the January-through-March 2026 quarter (10-Q as of 03/31/2026).
- Revenue optics & margin negative
- Of the $132.4 billion in fiscal 2025 total revenues, $128.5 billion is pass-through physical commodities; management itself calls operating revenues ($4,126.9 million) the more useful measure (10-K, Item 7). Screener values like a 0.07 price-to-sales or 1.4 price-to-cash-flow ratio are artifacts here, not buy arguments — the net margin on the flow-through is 0.2 to 0.4 percent.
- Interest rate dependence negative
- $1,734.3 million of interest income in fiscal year 2025, largely earned on client balances on deposit; the company's own risk factors warn that declining short-term rates or shrinking deposits "may have a material adverse effect" on profitability (10-K, Item 1A). The RJO deal enlarged the interest engine — and with it this flank.
- Credit/counterparty risk & leverage negative
- Bad debts in the January-through-March 2026 quarter: $12.4 million after $0.1 million a year earlier, $8.0 million of it in the metals business (10-Q, Item 2); $53.6 billion in total assets on roughly $2.7 billion of equity (about a 5 percent ratio) — industry-standard, but with no tolerance for one big failure.
- Acquisition strategy neutral
- Five acquisitions in fiscal year 2025 alone (including R.J. O'Brien for $651.9 million in cash plus 3,085,554 shares, and Benchmark), goodwill up $238.0 million, new $625 million of 6.875% notes due 2032, diluted share count up about 10 percent — the integration is delivering so far (RJO: $414.5 million in half-year operating revenues), but the interest burden and dilution will remain even when the momentum fades.
- Momentum & valuation neutral
- 24 scanner hits, a stage-2 uptrend, an RS rating of 95, plus 136 percent in twelve months and two 3-for-2 splits — set against a trailing P/E around 24, four times book value, 13 insider sales versus 1 purchase (including the CEO) and just two analyst estimates (data as of July 10, 2026).
StoneX is a highly profitable financial toll-booth operator in top form: record profits, a half-year above the entire prior year, broad momentum and an acquisition that strengthens the network. But the most eye-catching screener metric — the 0.07 price-to-sales ratio — is an optical illusion built from $128 billion of pass-through commodities, the net margin on it is paper-thin, profit hangs noticeably on U.S. interest rates, and $53.6 billion in assets rest on roughly 5 percent equity. Whoever invests here buys a very well-run, highly leveraged network business at four times book — not the bargain from the screener. Not investment advice.
What Our Rating Means
- If you don't own the stock
- As long as the question raised in the bottom line stays open, we see no basis for an entry.
- If you hold it in your portfolio
- Our findings offer no acute reason to sell — the checkpoints named remain decisive.
A journalistic assessment by our editorial team at the time of the deep dive, based on public sources — not investment advice and not a solicitation to buy or sell. Your personal circumstances (investment goals, risk capacity, taxes) cannot be taken into account. What our categories mean, how verdicts are formed, and what conflicts of interest exist →
Worth Noting
- SNEX reached the research list through the momentum/stage-2 run of our in-house stock scanner on July 17, 2026, with 24 hits; the underlying metrics carry a data cut-off of July 10, 2026.
- Scanner metrics (P/S, P/CF, P/E, Piotroski, fundamental grade) are computed on trailing twelve-month figures and treat the gross revenues of the physical commodities business like ordinary revenue — which is exactly why StoneX appears in cheapness rankings although the real price-to-revenue ratio sits around 2.7.
- Price and valuation figures are dated July 10, 2026 (about $137.30, about $10.9 billion in market value); analyses are evergreen, daily prices are not a buy argument. The fiscal year ends September 30; share counts and earnings per share are comparable only on a split-adjusted basis after the 3-for-2 splits of 03/21/2025 and 03/20/2026.
Frequently Asked Questions
StoneX Group Inc. (Nasdaq: SNEX), based in New York, is a financial services firm that connects clients to over 40 derivatives exchanges, 180 foreign exchange markets and more than 18,000 over-the-counter markets — as broker, clearer, market maker, payments provider and physical commodities merchant. Four segments: Commercial, Institutional, Self-Directed/Retail and Payments. In fiscal year 2025 (ended September 30, 2025), operating revenues were $4,126.9 million and net income $305.9 million.
Because reported total revenues ($132.4 billion in fiscal year 2025) include physical commodities sold on a gross basis — $128.5 billion is merchandise flow-through with nearly identical cost of goods. Management itself calls operating revenues ($4,126.9 million) the more useful measure in the annual report (10-K). On that basis, the price-to-revenue ratio is about 2.7, not 0.07 (data as of July 10, 2026).
From commissions and clearing fees ($728.2 million in fiscal year 2025), trading and market-making spreads (principal gains: $1,247.2 million), consulting and account fees ($205.9 million) — and to a substantial degree from interest on client balances left on deposit: $1,734.3 million in interest income. That is why falling U.S. policy rates are, per the company's own risk factors, a material profit risk.
On July 31, 2025, StoneX acquired R.J. O'Brien, the oldest futures brokerage in the U.S. — for approximately $651.9 million in cash plus 3,085,554 of its own shares; roughly $125.7 million of debt was assumed, and $625 million of 6.875% notes due 2032 were issued around the deal. RJO brought $6.4 billion in additional average client equity and contributed $414.5 million of operating revenues in the first half of fiscal year 2026.
StoneX's fiscal year ends September 30. "Fiscal year 2025" therefore covers October 2024 through September 2025, and the "second quarter of fiscal year 2026" means January through March 2026. If you compare StoneX numbers with calendar-year figures of other companies, keep that one-quarter offset in mind.
Total assets stood at $53.6 billion as of March 31, 2026, against roughly $2.7 billion of equity — a ratio of about 5 percent. That is industry-standard for a brokerage group, since much of the balance sheet consists of client balances and collateralized securities transactions; but it also means large client or counterparty defaults eat into equity quickly. In the January-through-March 2026 quarter, bad debts jumped from $0.1 million to $12.4 million.
No. Per the annual report (10-K) for fiscal year 2025, StoneX has never declared a cash dividend and has no plans to; the indentures of the 7.875% notes due 2031 and 6.875% notes due 2032 additionally restrict payouts. Instead of dividends there were two 3-for-2 stock splits within twelve months (March 2025 and March 2026) — which make the share handier but distribute no profit.
Found an error?
Did you spot a factual error, an outdated number, or a typo in this deep dive? Let us know briefly — your report goes straight to the editorial team.