Insperity: $45.6 Billion Flows Through, a $10 Million Loss Stays Behind
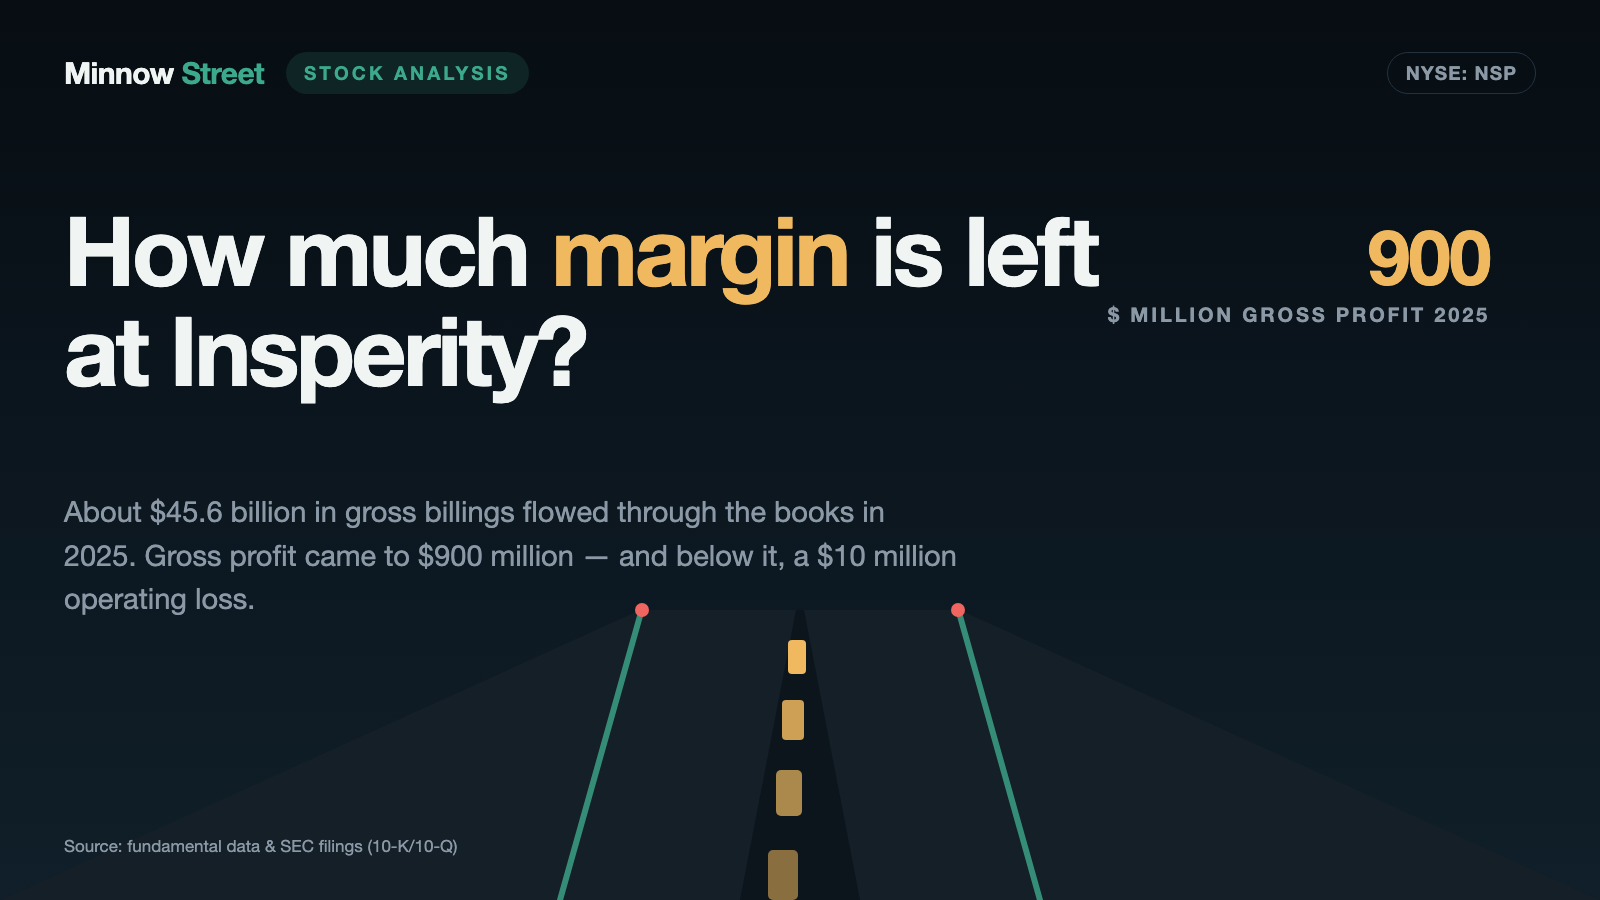
Insperity is the employer that appears on nobody's business card: roughly 310,000 people work at small U.S. companies and sit on this Texas company's payroll. In 2025, $45,565 million of gross billings ran through the books. Gross profit came to $900 million — ten million less than the business cost to run that year. One scissor movement explains it: benefits cost per covered employee rose 9 percent, pricing only 3 percent. We read the annual report and the quarterly report for March 31, 2026, and check whether that gap is really closing. Dated numbers instead of opinions with exclamation marks.
 Thomas Mücke
Founder & Publisher
Thomas Mücke
Founder & Publisher
Chart
Interactive price chart (TradingView).
Note: pure fact-based analysis, not investment advice and not a solicitation to buy or sell. All figures without guarantee.
There is an investor trap that springs shut whenever a company handles other people's money: the treasurer trap. It works like this. The treasurer of your local sports club has fifty thousand dollars in the account and a thick folder of receipts. That does not make him rich — the money belongs to the club, and the folder says to the cent who is owed what. Insperity, Inc. (NYSE: NSP) is the same thing at scale, except the numbers are impressive enough that the receipts are easy to skip. In one line: of the $45,565 million in gross billings for 2025, $6,812 million remained as revenue, of which $900 million was gross profit — and below that sat an operating loss of $10 million. So let us make a deal: before we talk about the stock, we read together what the company itself filed with the U.S. securities regulator, the SEC — the annual report (Form 10-K) for 2025 filed February 11, 2026, and the quarterly report (Form 10-Q) for March 31, 2026, filed May 1, 2026. An SEC filing is honest under penalty of law. And this one tells of a gap that has been widening for two years, of a credit agreement that had to give ground twice, and of a cash balance where more than nine tenths belongs to somebody else.
What this analysis covers
- What Insperity actually does — the employer nobody puts on a business card
- How this stock landed on our desk
- The numbers across the years — what genuinely impresses
- What the filings say — five uncomfortable truths
- Valuation — what the market pays for this business
- Opportunities and risks at a glance
- A human bottom line
- Frequently asked questions
- Sources
What Insperity actually does — the employer nobody puts on a business card
Picture a company with forty employees. It needs payroll, payroll taxes, health coverage, workers compensation, employment contracts, someone who knows termination law and someone who knows which form looks different in California than in Texas. It is far too small to justify an HR department. That is where Insperity steps in: the company from Kingwood, Texas, becomes the legal co-employer of the workforce — in industry terms a professional employer organization, or PEO. The people keep working at the client site but sit on Insperity's payroll. The filings call them worksite employees.
The economics rest on scale: because Insperity bundles the workforces of many small firms into one large group, it obtains health insurance terms a forty-person shop could never negotiate alone. In 2025 it paid an average of 310,089 worksite employees per month, up 1 percent. Insperity itself employed about 4,200 people as of December 31, 2025.
The offering comes in four versions. HR 360 is the full package and the largest source of revenue. HR 360 Select Edition is the leaner variant for larger mid-market clients. HR Core is payroll and human capital management without co-employment. And HR Scale is the new one: a joint solution built with Workday, Inc. on top of Workday's human capital management software, priced above HR 360 and aimed at companies with roughly 150 to 5,000 worksite employees. The annual report gives the start date: the first clients were expected to begin using HR Scale in the first quarter of 2026. Everything is reported in a single segment called HR Solutions — so there is no separate profit and loss statement for HR Scale.
And now the line that explains everything. Insperity bills the client gross: wages plus a markup expressed as a percentage of payroll cost. Only the markup counts as revenue. Out of that markup Insperity pays payroll taxes, health benefits and workers compensation; what is left is gross profit. That frames the central tension of this analysis, and it runs through every chapter below: the markup has to rise faster than health costs — but every price increase costs clients, and the same fixed costs spread worse across fewer heads. This is not theory. It is precisely what happened in 2025 and in the first quarter of 2026.
How this stock landed on our desk
We run roughly 3,500 stocks through our scanners every day. Insperity reached the research list through our in-house stock scanner "Turnaround Candidates": rank 19 of 62 U.S. hits, turnaround check 7 of 8, as of July 25, 2026. To reproduce it: open the scanner, set the country filter to U.S., sort by the turnaround check column. These lists are recalculated daily — the rank and the score are a dated snapshot, not a permanent state.
The model has two mandatory pillars. Break either one and a stock drops out instantly, no matter how the business is doing:
- Pillar 1 — the crash: the stock must trade at least 50 percent below its all-time high. No real crash, no turnaround. This is the pillar a stock loses exactly when things go well — the higher the price, the closer the exit.
- Pillar 2 — survival: the Altman Z score (an insolvency early-warning measure built from several balance sheet ratios) must be at least 1.1, stockholders equity must be positive, and no more than one balance sheet warning flag may be present. Plus tradability: price above $3 and average daily turnover above $2 million.
And this is where the hook carries an expiry date — a calculable one this time. The dividend-adjusted all-time high of Insperity stock dates from July 26, 2019, at roughly $116. Half of that is about $58. On July 24, 2026, the stock closed at $48.35 — roughly 58 percent below the all-time high, leaving only about 20 percent of room before the exclusion. For reference: on July 28, 2025, the same stock stood at $61.42. So if the price keeps climbing, Insperity leaves this list — not because the business got worse, but because it looks better. Pillar 2, by contrast, is comfortably met: our fundamental data put the Altman Z score at 4.05 (as of July 26, 2026), because $6.8 billion of revenue meets only $2.2 billion of total assets. Equity is positive — but only $67 million of it. More on that shortly.
Only after the mandatory pillars does the actual turnaround check come into play: eight points, four from the quarterly numbers (revenue direction, net margin, operating cash flow, balance sheet healing) and four from market behavior (price above the 50-day line, relative strength of the last three months against the last twelve, net insider buying, institutional accumulation). A stock is listed once it reaches at least 6 of 8; Insperity stood at 7 on July 25, 2026. We described the same mechanism earlier in this series for another service provider to U.S. small businesses that arrived through the same list — see our CBIZ analysis. Remember the principle: a scanner sorts by attributes, not by reasons. The reason has to be read.
The numbers across the years — what genuinely impresses
Start with what deserves credit: Insperity is not losing clients wholesale, and revenue has risen in every recent year. $4,973 million (2021), $5,939 million (2022), $6,486 million (2023), $6,581 million (2024) and $6,812 million (2025). That is 37 percent growth in four years in a business whose contracts can generally be cancelled on 30 days notice. Client retention has improved too: from 81 percent in 2024 to 83 percent in 2025, against a five-year average of 84 percent. The fiscal year matches the calendar year.
Now the line underneath. Gross profit — what is left after payroll taxes, health benefits and workers compensation — did not follow revenue. In 2025 it left it behind:
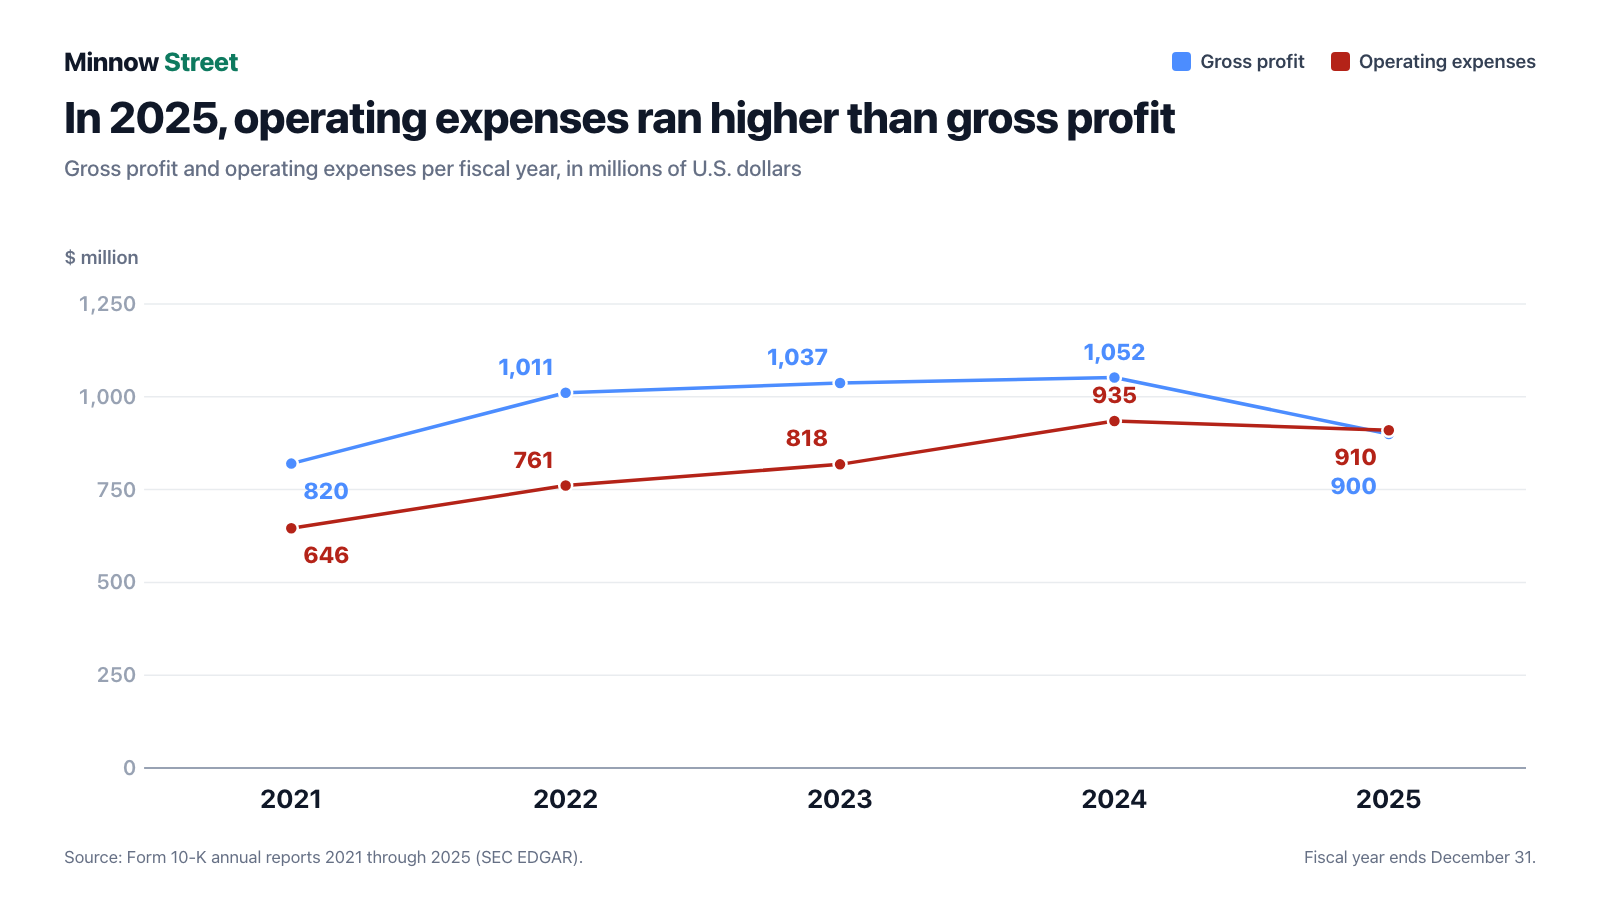
The gross profit series: $820 million (2021), $1,011 million (2022), $1,037 million (2023), $1,052 million (2024) — and then $900 million (2025). Operating expenses over the same years: $646, $761, $818, $935, $910 million. In 2024 there were still $117 million between the two lines; in 2025 they crossed. Operating income fell accordingly from $250 million (2022) through $219 million (2023) and $117 million (2024) to minus $10 million. The bottom line for 2025 was a net loss of $7 million and diluted loss per share of $0.19 — after $4.64 of earnings per share in 2022.
What deserves noting is how disciplined the cost side was: operating expenses fell 3 percent in 2025, and per worksite employee per month from $253 to $245. The problem was not an overgrown head office. It sat one floor above.
What the filings say — five uncomfortable truths
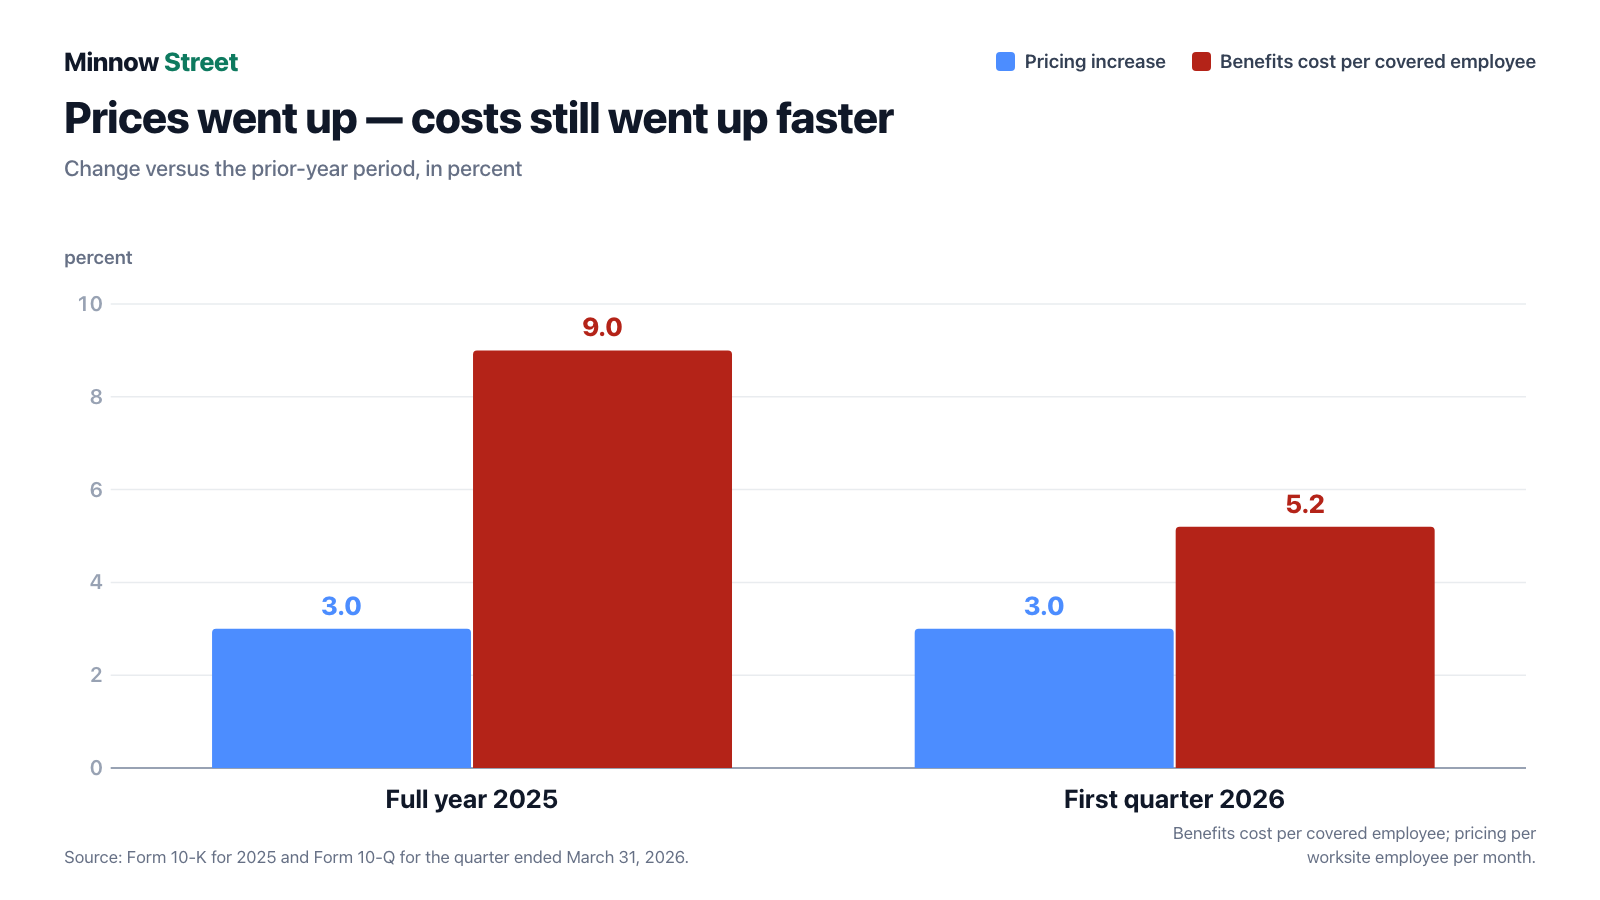
Uncomfortable truth No. 1: pricing rose 3 percent, health costs 9 percent
The annual report explains the collapse in four sentences, without hedging:
"Gross profit decreased 14% to $900 million. The decrease was primarily due to a 15% decrease in gross profit per WSEE, which was partially offset by a 1% increase in the average number of WSEEs paid per month. Gross profit per WSEE paid per month reflected, in part, a 3% pricing increase offset by a 6% increase in direct costs per WSEE. The increase in direct costs per WSEE was primarily attributable to a 9% increase in benefits costs per participant."
— Insperity, Inc., Form 10-K for 2025, Management's Discussion and Analysis

Three percent of pricing against nine percent of cost is not a soft patch in the cycle. It is a pricing error with a lead time. Insperity fixes its rates a year in advance and has to estimate what its clients' workforces will run up in medical bills over the coming year. When the estimate is wrong, Insperity carries the difference — not the client. That is the core of the business and its single largest risk.
Uncomfortable truth No. 2: the gap is closing — and the price is paid in clients
The first quarter of 2026 looks better. Benefits cost per covered employee rose only 5.2 percent, against an unchanged pricing increase of 3 percent. Six percentage points of gap became 2.2:
What that progress costs is in the filing too, stated plainly enough that you read it twice:
"During Q1 2026, average WSEEs paid decreased 1% compared to Q1 2025. The number of WSEEs paid from new client sales and client retention decreased due in part to our margin recovery efforts, while the net change in our client base increased compared with Q1 2025."
— Insperity, Inc., Form 10-Q for the quarter ended March 31, 2026

In plain terms: Insperity is deliberately accepting client losses to rescue the margin. That is sound management and uncomfortable ownership, because the first quarter still came in weaker than the year before — $62 million of operating income against $68 million, $33 million of net income against $51 million, $0.88 per diluted share against $1.35. Two things belong in the calculation for fairness. The first quarter of 2026 carried $9 million of restructuring charges from the workforce realignment announced in February 2026; without that item operating income would have exceeded the prior-year figure. And the effective tax rate jumped from 29 percent to 48 percent because equity awards vested at a price below their grant price — that alone cost $10 million of additional tax. A fallen share price literally raises the tax bill here.
One framing point matters: the first quarter is Insperity's seasonally strongest, because U.S. payroll tax bases reset at the start of the year. Multiplying $62 million by four is guaranteed to be wrong — 2025 opened with a $68 million first quarter and ended at minus $10 million for the year.
Uncomfortable truth No. 3: $555 million in cash — $519 million of it belongs to others
Here the treasurer trap from the opening snaps shut at full force. The quarterly report reports a cash position that sounds like a fortress, and dissolves it in the same sentence:

Of $555 million in cash, cash equivalents and marketable securities at March 31, 2026, roughly $415 million was payable in April 2026 — withheld federal and state income taxes, employment taxes and other payroll deductions, that is, other people's money on its way to the tax authorities. Another $104 million represented client prepayments. That leaves about $36 million. Working capital stood at $142 million (December 31, 2025: $102 million; December 31, 2024: $155 million). The year-end 2025 picture was the same: $660 million of cash, of which $468 million was payable in early January and $135 million was client prepayments.
The same pattern governs cash flow: operating cash flow swung from plus $198 million (2023) to plus $520 million (2024) and then to minus $278 million (2025). Those swings do not measure earning power; they measure which day of the week a payroll date happened to fall on relative to the balance sheet date. At a payroll processor, treating operating cash flow as a quality metric means measuring the calendar.
Uncomfortable truth No. 4: the lenders gave ground twice in 2025
Insperity has $369 million drawn on its revolving facility and $67 million of stockholders equity on the balance sheet (March 31, 2026). The ratio is unusual — and it left marks in the credit agreement during 2025:

The Form 8-K filed December 16, 2025, carries the detail of the second step: the revolving commitment rose from $650 million to $750 million, the accordion option from $700 million to $800 million, maturity was extended to December 15, 2028 — and the permitted leverage ratio rose from 3.00 to 3.75. The definition of EBITDA was amended as well. A ceiling does not get raised because there is plenty of room under it. At March 31, 2026, $369 million was drawn plus a $1 million letter of credit, leaving $380 million unused. The report confirms compliance with all financial covenants at that date.
Over the same period Insperity kept paying $23 million of dividends per quarter — $90 million in 2025, against a full-year loss of $7 million. Add $19 million of share repurchases and $31 million of capital expenditure. That dividends were carved out of the interest coverage covenant is therefore not a technicality: it is the condition under which that payout can continue as it is.
Uncomfortable truth No. 5: one carrier, one sales force — both stretched
Two concentrations that sit far apart in the filings and belong side by side. First: roughly 85 percent of health insurance costs run through the policy with UnitedHealthcare. One carrier therefore governs the company's largest cost block. To its credit, Insperity renegotiated: an amendment dated November 3, 2025, extends the arrangement through 2028, holds out additional cost savings starting in 2026, and gives Insperity the right to elect annually whether it stands behind each participant's claims up to $500,000, $750,000 or $1 million. For 2026 the company chose the most cautious step: $500,000. That is precisely the lever that likely braked the cost curve in the first quarter of 2026 — and it costs premium.
Second: the sales force has shrunk sharply. The average number of business performance advisors fell from 769 in 2024 to 612 in 2025, a decline of more than a fifth. Trained advisors went from 698 to 599. That matters because Insperity loses roughly 17 percent of its base to attrition every year; at 310,089 worksite employees that is more than 50,000 heads to replace just to stand still. In the first quarter of 2026 headcount in sales, service and support fell another 8 percent, while advertising spend rose 57 percent to $11 million. At the same time HR Scale is launching — a new, higher-priced offering aimed at exactly the larger clients — and it did show up in the mid-market in the first quarter of 2026: worksite employees there rose 9 percent, lifting the mid-market share of the total from 26 percent to 29 percent.
How powerfully a single cost block can turn a service business is something this series has already shown at a manager of workers compensation costs — see our CorVel analysis.
Valuation — what the market pays for this business
As a dated anchor: on July 24, 2026, the stock closed at $48.35; with 38,169,182 shares outstanding (as of April 23, 2026) that is a market capitalization of roughly $1.85 billion. Against 2025 revenue of $6,812 million that is a price-to-sales ratio of about 0.27 — which says little about a business that converts only 13 percent of revenue into gross profit. No price-to-earnings ratio can be formed for 2025 because there were no earnings. On the adjusted figures — $39 million of adjusted net income and $1.03 of adjusted earnings per share — the multiple would be roughly 47 times.
The more telling view is on what once was and might be again: between 2021 and 2023 Insperity earned between $124 million and $179 million of net income. On that level today's market capitalization corresponds to a multiple between 10 and 15. Book value is no anchor here: $1.755 per share gives a price-to-book ratio of about 27.5 — a legacy of years of buybacks, not of losses. Retained earnings still stood at $648 million on March 31, 2026.
The professionals are split. The average price target in our fundamental data is $43.75 (as of July 26, 2026), below the July 24 close. At the same time those estimates call for $2.05 of earnings per share this year and $2.80 next year — after minus $0.19 in 2025. Anyone who trusts that estimate is paying roughly 17 times the earnings of the year after next. Anyone who does not is paying for a company with an operating loss. Both describe the same stock. Also notable is short interest of about 12.4 percent of the float: a meaningful part of the market is still betting against it.
Opportunities and risks at a glance
What speaks for it:
- The cost curve is measurably bending: benefits cost per covered employee rose only 5.2 percent in the first quarter of 2026 after 9 percent in 2025, against an unchanged pricing increase of 3 percent.
- The largest cost block was renegotiated: the amendment of November 3, 2025, extends the UnitedHealthcare arrangement through 2028, holds out savings from 2026 and allows the per-participant exposure to be capped at $500,000, the level elected for 2026.
- Client retention improved: 83 percent in 2025 after 81 percent in 2024.
- Cost discipline is working: operating expenses fell 3 percent to $910 million in 2025, and per worksite employee per month from $253 to $245; in February 2026 a further 4 percent of non-sales positions were eliminated.
- The chief executive bought roughly $12.6 million of stock between March 17 and June 3, 2026 — reported on Form 4, transaction code P.
- The mid-market business is growing: worksite employees up 9 percent in the first quarter of 2026, share of the total from 26 percent to 29 percent.
What speaks against it:
- The turnaround is unproven: first-quarter 2026 operating income of $62 million came in below the prior year's $68 million, net income of $33 million below $51 million.
- The margin is being paid for in clients: worksite employees paid fell 1 percent in the first quarter of 2026, attributed in the filing in part to margin recovery efforts.
- The balance sheet is thin: $67 million of stockholders equity within total assets of $2,196 million (March 31, 2026), roughly 3 percent.
- Credit covenants were loosened twice in 2025 — dividends carved out of interest coverage, the leverage ceiling raised from 3.00 to 3.75.
- The $90 million of dividends paid in 2025 was not covered by earnings and was effectively funded through the revolving facility.
- One carrier bears roughly 85 percent of health insurance costs; client contracts are generally cancellable on 30 days notice and attrition runs at roughly 17 percent a year.
- The sales force shrank by more than a fifth in 2025 while HR Scale is only starting and carries no separate segment reporting.
A human bottom line
Back to the treasurer from the opening. We started at $45.6 billion and landed at $900 million of gross profit and minus $10 million of operating income. Run the same arithmetic on the cash: $555 million sounds like a cushion, and $519 million of it belongs to the tax authorities and to clients. At Insperity nearly everything that looks large is merely passing through. What stays is a narrow spread — and that spread decides everything.
What we like about this case: the company does not talk around it. It writes into its own filing that it is losing clients because it is raising prices. It quantifies the cost increase to the decimal. It reports the loosening of its credit covenants in a sentence you cannot miss if you look for it. And its chief executive put his own money into the stock twice in the spring of 2026, while the price sat on the floor.
What we do not like: the proof is still missing. A single, seasonally strong quarter with operating income below the prior year is a direction, not a turn. The question everything hangs on is easy to ask and will be answered within a year: do health costs per covered employee rise durably slower than prices — and are enough clients left for the progress to show up in dollars rather than only in percentage points? We will not tell you what to do with that. We only tell you where to look. What you make of it is your decision. And that is exactly how it should be.
Sources
- Form 10-Q for the quarter ended March 31, 2026, filed May 1, 2026 — Insperity, Inc., CIK 0001000753 (most recent periodic report)
- Form 10-K for 2025, filed February 11, 2026 — source of the 2025, 2024 and 2023 annual figures, client retention, sales force data and the UnitedHealthcare disclosures
- Form 10-K for 2024, filed February 11, 2025; the 2021 and 2022 annual figures come from the XBRL data of the 2022 and 2023 annual reports
- Form 8-K dated February 10, 2026, Items 2.02 and 2.05 — realignment plan: roughly 4 percent of non-sales positions, about $9 million of one-time charges
- Form 8-K dated December 16, 2025, Items 1.01 and 2.03 — Eighth Amendment to the credit agreement: $750 million commitment, maturity December 15, 2028, leverage ceiling from 3.00 to 3.75
- Form 8-K dated November 3, 2025, Items 1.01 and 2.02 — UnitedHealthcare amendment: extension through 2028, annual election of $500,000 / $750,000 / $1 million per participant
- Forms 4 dated March 19, 2026, and June 4, 2026 — chief executive purchases of 201,987 and 233,000 shares
- Fundamental data & SEC filings (annual and quarterly reports, 10-K/10-Q): metrics, price and valuation data, as of July 24 to 26, 2026
- Hook: our in-house stock scanner "Turnaround Candidates" — rank 19 of 62 U.S. hits, turnaround check 7 of 8, as of July 25, 2026; the lists are recalculated daily.
This analysis is journalistic commentary based on publicly available documents. It is not investment advice, not a recommendation to buy or sell, and not a solicitation to buy or sell securities. Stocks can lose value at any time, up to and including total loss. All figures carry their respective reference dates and may have changed since publication. The author holds no position in Insperity, Inc. at the time of publication.
Our Bottom Line at a Glance
- Business model & market position positive
- As co-employer for small and medium-sized U.S. companies, Insperity bundles workforces into a purchasing group for benefits — a value a forty-person shop cannot create alone. In 2025 it paid an average of 310,089 worksite employees per month and client retention rose from 81 percent to 83 percent. Revenue grew from $4,973 million in 2021 to $6,812 million in 2025 even though contracts are generally cancellable on 30 days notice.
- Earnings power & margin break negative
- Gross profit fell 14 percent to $900 million in 2025 and for the first time came in below operating expenses of $910 million. Operating income flipped from $250 million in 2022 through $117 million in 2024 to minus $10 million, and diluted earnings per share from $4.64 in 2022 to minus $0.19. The Form 10-K for 2025 gives the cause: a 3 percent pricing increase against a 6 percent rise in direct costs per worksite employee, driven by a 9 percent increase in benefits cost per participant.
- Progress of the turn neutral
- In the first quarter of 2026 benefits cost per covered employee rose only 5.2 percent against an unchanged 3 percent pricing increase — the gap narrowed from 6 to 2.2 percentage points. Operating income of $62 million nonetheless trailed the prior-year quarter's $68 million, including $9 million of restructuring charges. Worksite employees paid fell 1 percent, which the filing attributes in part to the company's own margin recovery efforts.
- Balance sheet & funding negative
- At March 31, 2026, stockholders equity of $67 million sits within total assets of $2,196 million (about 3 percent), with $369 million drawn on the revolving facility. Of $555 million in cash and marketable securities, roughly $415 million was payable in April 2026 as taxes and payroll deductions and $104 million was client prepayments. In December 2025 lenders raised the leverage ceiling from 3.00 to 3.75; during 2025 dividends were carved out of the interest coverage covenant. All covenants were met at the reporting date.
- Concentration risks negative
- Roughly 85 percent of health insurance costs run through the UnitedHealthcare policy; an amendment dated November 3, 2025, extends it through 2028 and allows the per-participant exposure cap of $500,000 elected for 2026. At the same time the sales force shrank in 2025 from an average of 769 advisors to 612, while roughly 17 percent of the client base has to be replaced every year.
- Valuation & market picture neutral
- A market capitalization of roughly $1.85 billion (38,169,182 shares at $48.35, as of July 24, 2026) equals about 0.27 times annual revenue; no price-to-earnings ratio can be formed for 2025. Measured against the $124 million to $179 million of net income earned between 2021 and 2023, the multiple would be between 10 and 15. The average analyst price target of $43.75 sits below the closing price, and short interest runs at about 12.4 percent of the float.
Insperity earns a narrow spread: in 2025, $45,565 million of gross billings ran through the books, $900 million remained as gross profit — and below it an operating loss of $10 million, the first in years. The cause is a gap the company quantifies itself: a 3 percent pricing increase against a 9 percent rise in benefits cost per covered employee. In the first quarter of 2026 that gap narrowed to 2.2 percentage points, yet operating income of $62 million still trailed the prior year's $68 million and worksite employees paid fell 1 percent — attributed in the filing to the company's own margin recovery efforts. The balance sheet carries only $67 million of equity, credit covenants were loosened twice in 2025, and the $90 million of dividends paid in 2025 was not covered by earnings. The chief executive bought roughly $12.6 million of stock between March and June 2026. Not investment advice.
What Our Rating Means
Open questions
The business works in principle, but one material question is open. As long as it stays open, our findings do not carry a quality verdict.
The business itself works: revenue rose again in 2025 to $6,812 million, client retention improved from 81 percent to 83 percent, equity is positive, all credit covenants were met at March 31, 2026, and the first quarter of 2026 was profitable with $33 million of net income. There is no substance finding in the sense of a going-concern warning, negative equity or a cash runway below four quarters. What is open is the decisive operating question: whether prices durably rise faster than health costs is not proven — one seasonally strong quarter with operating income below the prior year does not settle it. Add equity of only $67 million against $2,196 million of total assets, covenants loosened twice, a dividend not covered by 2025 earnings, and dependence on a single carrier that bears roughly 85 percent of health costs. This is the textbook case for yellow: a working business with an unproven turn. The share price does not determine this color. The decision is yours.
A journalistic assessment by our editorial team at the time of the deep dive, based on public sources — not investment advice and not a solicitation to buy or sell. Your personal circumstances (investment goals, risk capacity, taxes) cannot be taken into account. What our levels mean, how verdicts are formed, and what conflicts of interest exist →
Worth Noting
- Insperity reached the research list through our in-house stock scanner "Turnaround Candidates": rank 19 of 62 U.S. hits, turnaround check 7 of 8, as of July 25, 2026. These lists are recalculated daily — rank and score are a dated snapshot. The two mandatory pillars are a distance of at least 50 percent from the all-time high and an Altman Z score of at least 1.1 with positive equity. Pillar 2 is comfortably met at 4.05; pillar 1 is the tight one: the dividend-adjusted all-time high of July 26, 2019, stands at roughly $116, half of which is about $58. If the price rises above that threshold — roughly 20 percent above the July 24, 2026, close of $48.35 — the stock leaves the list without anything changing in the business.
- The fiscal year matches the calendar year. The most recent periodic report is the Form 10-Q for March 31, 2026 (filed May 1, 2026); afterwards, through the data date of July 26, 2026, only a Form 8-K dated May 20, 2026, covering officer matters and annual meeting results (Items 5.02/5.07), Form 4 insider filings and Schedule 13G ownership filings were submitted. The report for the quarter ended June 30, 2026, was not yet available.
- Price and valuation figures are dated anchors, not buy arguments: a closing price of $48.35 on July 24, 2026, and a market capitalization of roughly $1.85 billion, calculated on the 38,169,182 shares from the quarterly report cover page dated April 23, 2026. The first quarter is Insperity's seasonally strongest because U.S. payroll tax bases reset at the start of the year — extrapolating a first quarter to the full year reliably misleads.
- As of July 26, 2026, no acquisition, merger or take-private process is pending; there is no Form S-4, no SC 13E3, no Form 25 and no Schedule 13D. The two Form 15-12B filings of December 8, 2017, and May 26, 2021, cover other classes of securities — the 2021 filing expressly names rights to purchase preferred stock and states that the reporting duty for the common stock remains.
- Risk of confusion: on the New York Stock Exchange the ticker NSP stands for Insperity, Inc., not for a network or utility operator. The former name Administaff, Inc. appears in documents up to March 1, 2011. Operating cash flow is no quality metric at a payroll processor: the swing from plus $520 million in 2024 to minus $278 million in 2025 largely follows where payroll dates fall around the balance sheet date.
Frequently Asked Questions
Insperity is a professional employer organization. It becomes the legal co-employer of the workforces of small and medium-sized U.S. companies and takes over payroll, payroll taxes, health insurance, workers compensation and HR compliance. In 2025 it paid an average of 310,089 worksite employees per month. Only the markup on payroll cost counts as revenue, not the wage bill itself.
Because costs rose faster than prices. The Form 10-K for 2025 reports a 3 percent pricing increase against a 6 percent rise in direct costs per worksite employee, driven by a 9 percent increase in benefits cost per participant. Gross profit fell 14 percent to $900 million while operating expenses stood at $910 million. The bottom line was a net loss of $7 million.
Partly. Benefits cost per covered employee rose only 5.2 percent against an unchanged 3 percent pricing increase. But operating income of $62 million came in below the prior year quarter's $68 million and net income of $33 million below $51 million. Those figures include $9 million of restructuring charges and $10 million of additional tax from equity awards vesting below their grant price.
Considerably less than the balance sheet suggests. At March 31, 2026, cash, cash equivalents and marketable securities stood at $555 million. Of that, roughly $415 million was payable in April 2026 as withheld taxes and payroll deductions, and another $104 million represented client prepayments. Working capital was $142 million.
Insperity built HR Scale jointly with Workday, Inc. It runs on Workday human capital management software and is priced above the standard HR 360 offering. The target group is companies with roughly 150 to 5,000 worksite employees. According to the annual report, the first clients were expected to begin using HR Scale in the first quarter of 2026. There is no separate segment reporting: Insperity reports one single segment.
It is currently not covered by earnings. In 2025 Insperity paid $90 million of dividends against a full-year net loss of $7 million; in the first quarter of 2026 it paid $23 million against $33 million of net income. In December 2025 dividends were carved out of the credit agreement's interest coverage covenant and the permitted leverage was raised from 3.00 to 3.75. All covenants were met at March 31, 2026.
Heavily. According to the Form 10-K for 2025, roughly 85 percent of health insurance costs run through the policy with UnitedHealthcare. An amendment dated November 3, 2025, extends the arrangement through 2028 and lets Insperity elect annually between per-participant exposure of $500,000, $750,000 or $1 million. For 2026 the company chose the lowest level of $500,000.
Because two mandatory conditions are met. On July 24, 2026, the stock closed at $48.35, roughly 58 percent below its dividend-adjusted all-time high of about $116 from July 2019, and the Altman Z score of 4.05 is well above the 1.1 threshold. If the price rises above roughly $58, the stock drops off the list for that reason alone. The lists are recalculated daily.
Found an error?
Did you spot a factual error, an outdated number, or a typo in this deep dive? Let us know briefly — your report goes straight to the editorial team.