CBIZ: Two Billion Dollars for Growth — and Less Profit per Share Than in 2023
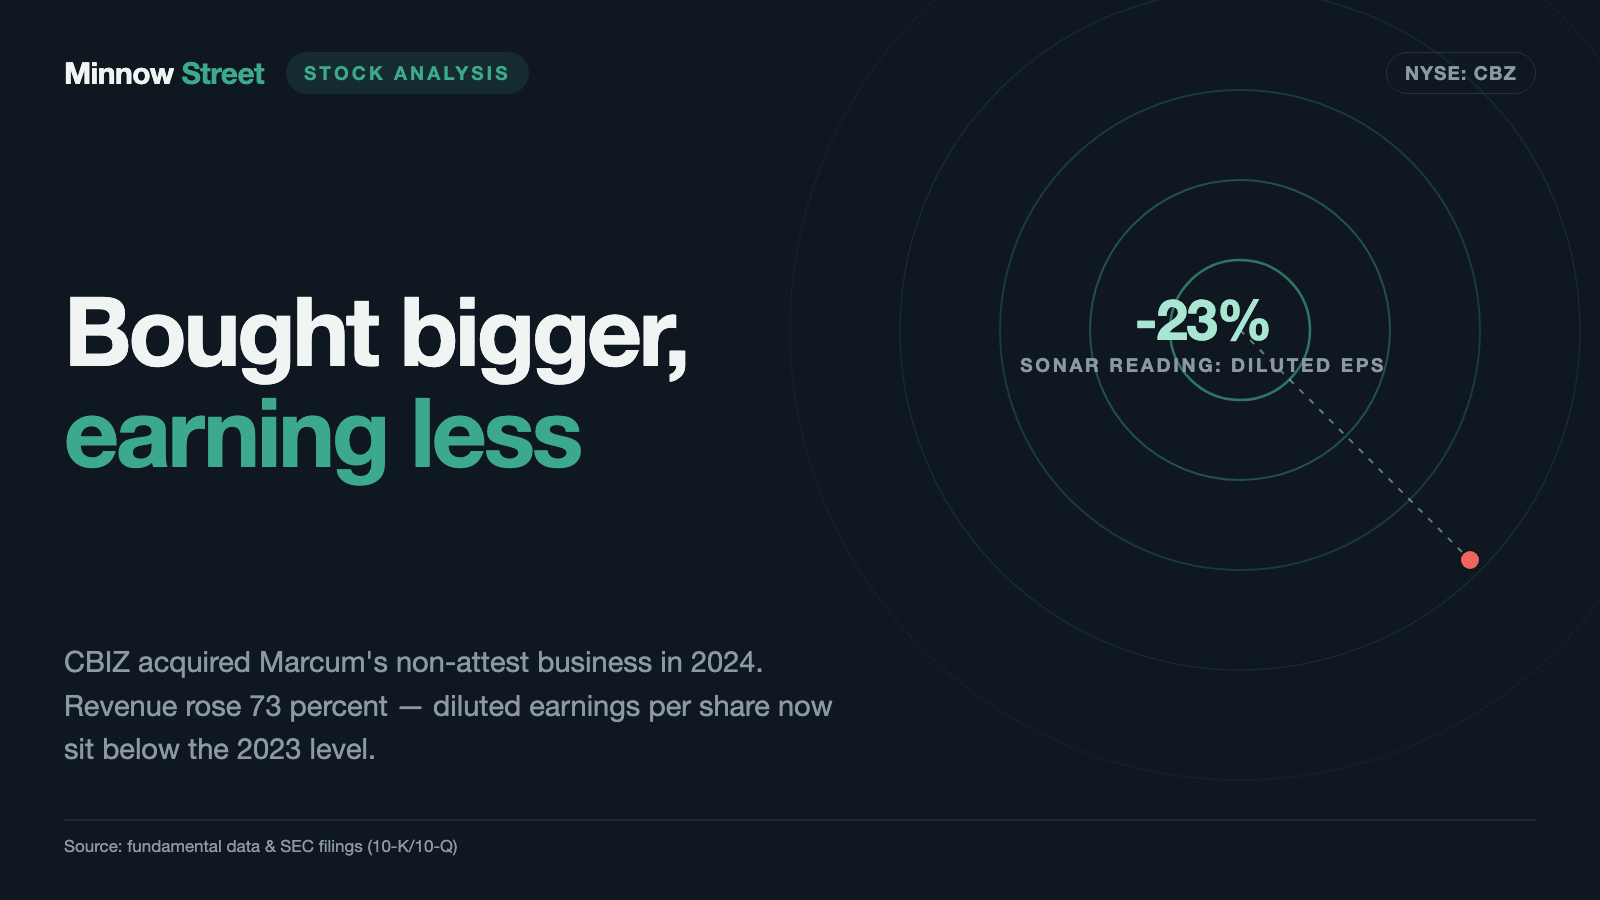
CBIZ does the work no mid-sized American company wants to do itself: bookkeeping, tax, payroll, insurance. On November 1, 2024 it paid roughly two billion dollars for the advisory business of Marcum and nearly doubled in size overnight. Revenue hit a record $2,758.0 million in 2025. Diluted earnings per share still came in at $1.83, below the $2.39 of 2023. We read the annual report and the quarterly report as of March 31, 2026 and find a record quarter that is one quarter one-time gain, 6.2 million shares still to come, and an interest bill that eats almost the entire annual profit. We do the math on how much of the new size actually reaches the shareholder.
 Thomas Mücke
Founder & Publisher
Thomas Mücke
Founder & Publisher
Chart
Interactive price chart (TradingView).
Note: pure fact-based analysis, not investment advice and not a solicitation to buy or sell. All figures without guarantee.
There is an investor trap that looks friendly, because it opens with good news: the revenue illusion. It works like this. A company reports that it has grown by half. Your brain hears "grown" and thinks "improved". Those are two entirely different things. Buying a kitchen twice the size does not make you cook twice as well — it gives you a bigger kitchen and a bill to go with it. At CBIZ, Inc. (NYSE: CBZ) the trap becomes visible in a single comparison: from 2023 to 2025 revenue rose 73 percent while diluted earnings per share fell 23 percent. So let us make a deal. Before we talk about the stock, we read together what the company itself told the U.S. securities regulator, the SEC — the annual report (10-K) for 2025 filed February 26, 2026, and the quarterly report (10-Q) as of March 31, 2026 filed April 30, 2026. An SEC filing is honest under threat of penalty. And these two describe a record quarter that is one quarter one-time gain, 6.2 million shares that have yet to arrive, and interest payments that swallow almost the entire annual profit.
What this analysis covers
- What CBIZ actually does — the back office of the American middle market
- Where the stock landed on our desk
- The numbers over the years — what genuinely impresses
- What the filings say — five uncomfortable truths
- Valuation — what the market pays for this profit
- Opportunities and risks at a glance
- A human conclusion
- Sources
What CBIZ actually does — the back office of the American middle market
CBIZ sells nothing you can touch. The company from Independence, Ohio takes over exactly the work that small and mid-sized businesses do not want to do and cannot justify a department for: bookkeeping and tax returns, payroll, advice on acquisitions and valuations, plus benefits and insurance solutions for the workforce. At the end of 2025 the annual report counted more than 9,500 team members.
The business runs in three practice groups. By far the largest is Financial Services — accounting, tax, advisory, government healthcare consulting: $2,301.5 million of revenue in 2025, up 68.9 percent from 2024. The second, Benefits and Insurance Services (retirement plans, health, property and casualty, payroll), came in at $409.6 million, up 2.1 percent. The remaining roughly $47 million sits in National Practices, essentially managed IT services. Remember that split: one group grew by more than two thirds in 2025, the other by barely two percent. We will come back to why.
One feature of this model needs explaining and matters for the rest of the analysis: CBIZ is not allowed to audit financial statements. U.S. independence requirements and state accountancy laws bar a listed company from performing attest services itself. CBIZ solves this through administrative service agreements with independent CPA firms. As of December 31, 2025 it maintained such agreements with four CPA firms. The best known is CBIZ CPAs, P.C., formerly Mayer Hoffman McCann, with 421 stockholders. Most stockholders of those firms are also CBIZ employees, and CBIZ renders services to them as an independent contractor. For a picture of how closely that construct works in practice, see our analysis of FactSet, another professional information business whose product is expertise rather than inventory.
The business is highly seasonal — in a way that distorts every quarterly figure read in isolation. The annual report says so itself:
"Core financial services (traditional tax and accounting services) are impacted by seasonality given the nature of tax season due to a heavier volume of activity during the first four months of the year. Seasonality is most evident in the quarterly earnings per share (“EPS”) as most of the annual EPS is earned during the first half of the year."
— CBIZ, Inc., SEC annual report 10-K for 2025, Item 1 (Business)
In plain terms: the first quarter is by far the strongest, the fourth is routinely weak. Anyone annualizing a single CBIZ quarter is guaranteed to be wrong. That frames the central tension of this analysis, which runs through every chapter that follows: CBIZ nearly doubled in size overnight. The question is not whether the company grew — the question is how much of that size reaches the shareholder.
Where the stock landed on our desk
We run roughly 3,500 stocks through our scanners every day. CBIZ landed on the research list through our in-house stock scanner "Turnaround Candidates": rank 17 of 62 U.S. hits, turnaround check 7 of 8, as of July 25, 2026. To reproduce it: open the scanner, set the country filter to "US", sort by the turnaround check column. These lists are recalculated every day — rank and score are a dated snapshot, not a permanent state.
The model has two mandatory pillars. Miss one and a stock drops off the list immediately, no matter how well or badly the business is doing:
- Pillar 1 — the crash: the stock must trade at least 50 percent below its all-time high. No real crash, no turnaround. This is the pillar a stock loses as soon as it recovers — the better the price does, the closer the exit.
- Pillar 2 — survival: the Altman Z-score (an early-warning measure for insolvency built from several balance sheet ratios) must exceed 1.1, equity must be positive, and no more than one balance sheet warning flag may be present. Plus tradability: price above $3 and average daily turnover above $2 million.
So the fact that CBIZ appeared on the list on July 25, 2026 means both mandatory pillars were met that day. And that is exactly where this hook has an expiry date. The shaky one is not Pillar 2: the Altman Z-score stands at 6.01 (data as of July 26, 2026), more than five times the required 1.1; equity is positive and our data show no balance sheet warning flag. Membership hangs on Pillar 1: CBIZ trades 64.8 percent below its all-time high against a required minimum of 50 percent. At a price of $42.60 (July 26, 2026) that implies an all-time high of roughly $121 — and therefore a cut-off at roughly $60.50. A price recovery of a good 42 percent to that level takes CBIZ off the list without anything changing in the business.
Only after the mandatory pillars does the actual turnaround check apply: eight points, four from the quarterly numbers (revenue direction, net margin, operating cash flow, balance sheet healing) and four from market behavior (price above the 50-day line, three-month relative strength versus twelve months, net insider buying, net institutional accumulation). A stock is listed at six of eight or better; CBIZ stood at seven on July 25, 2026. We described the same mechanism in this series for a service provider whose business was never sick and which still landed on the turnaround list — see our analysis of CorVel. Remember the principle: a scanner sorts by characteristics, not by reasons. The reason has to be read.
The numbers over the years — what genuinely impresses
Start with what honestly impresses. CBIZ has not been a shrinking company for years, and revenue rose every single year even before the big deal. The fiscal year matches the calendar year.
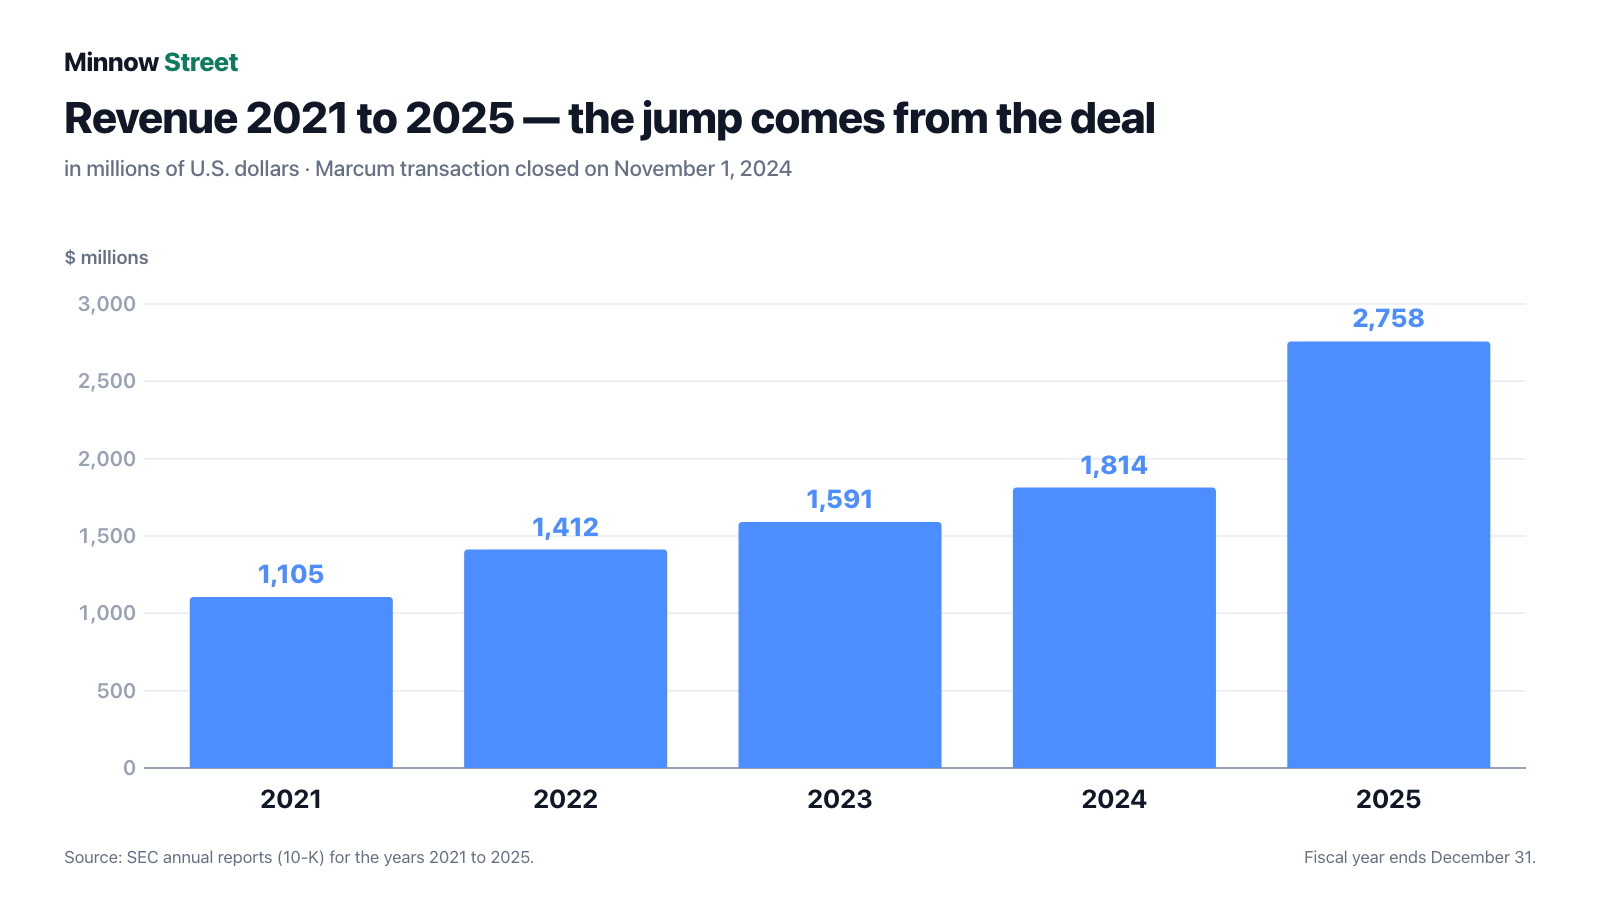
The series is clear: $1,104.9 million (2021), $1,412.0 million (2022), $1,591.2 million (2023), $1,813.5 million (2024) and $2,758.0 million (2025). That is two and a half times the business in four years. Net income climbed for most of that stretch too: $70.9 million (2021), $105.4 million (2022), $121.0 million (2023). Then the deal arrived and the series broke: $41.0 million in 2024 and $115.4 million in 2025. Even in the record revenue year of 2025, profit stayed below the 2023 figure — a year in which CBIZ booked barely more than half the revenue.
On a per-share basis the same event shows up even more sharply, because the newly issued shares count as well:
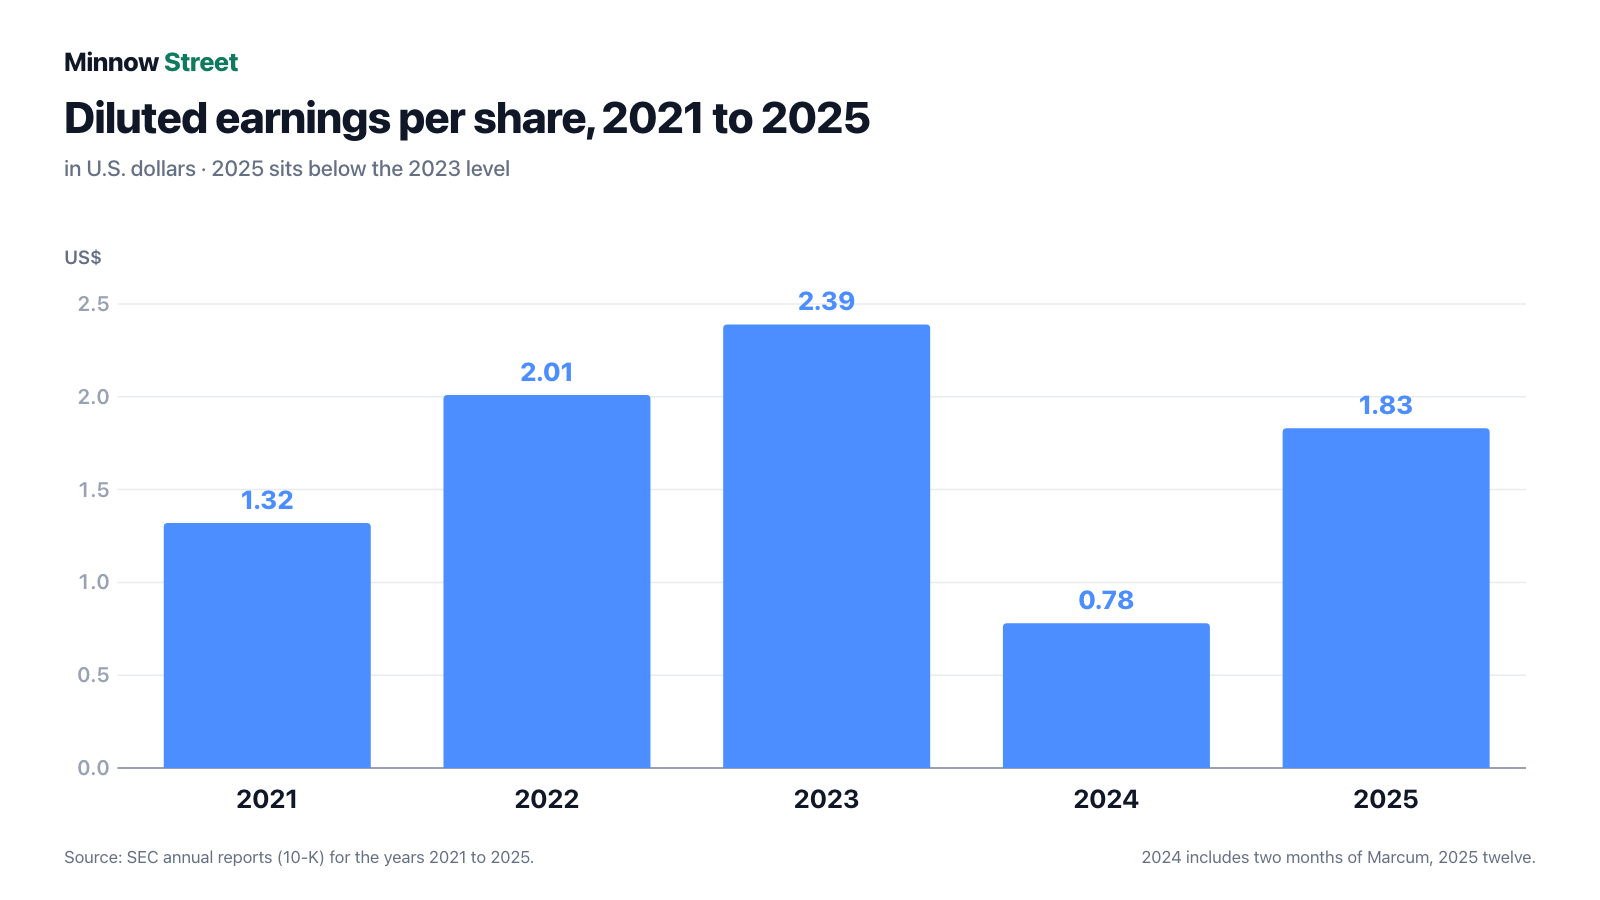
Diluted earnings per share rose from $1.32 (2021) through $2.01 (2022) to $2.39 (2023), fell to $0.78 in 2024 and reached $1.83 in 2025. That is the core of this analysis in one number: against 2023 revenue is up 73 percent and earnings per share are down 23 percent. The reason sits right beside it: the diluted share count went from 50.6 million (2023) through 52.7 million (2024) to 63.2 million (2025). A rule worth keeping: making the pie bigger while seating more people at the table does not automatically give you a bigger slice.
In fairness: 2024 is not a normal year but the year of the acquisition — it contains only two months of Marcum (the transaction closed on November 1, 2024) while carrying the costs of the deal. 2025 contains twelve months of Marcum. And both years carry integration costs: $5.0 million in 2024 and $64.3 million in 2025. Those costs eventually run out. Interest expense and the share count do not.
What the filings say — five uncomfortable truths
No. 1: The revenue jump was bought, not grown
The 2025 annual report does the math itself, in a single paragraph. Revenue grew by $944.5 million, or 52.1 percent. And further: of that increase, $914.2 million — 50.4 of the 52.1 percentage points — came from newly acquired operations net of divestitures. That leaves roughly $30.3 million from the existing business, or about 1.7 percent measured against the prior-year revenue of $1,813.5 million.
The practice groups show the same picture. Financial Services grew 68.9 percent to $2,301.5 million in 2025 — "primarily the result of the Transaction", as the report puts it. Benefits and Insurance Services, where no acquisition helped, grew 2.1 percent to $409.6 million. That is the honest organic speed of this house. A service business growing at 1.7 to 2 percent is no disaster — but it is not a growth stock either. It is a solid, slow business that buys its size.
No. 2: The record quarter is one quarter one-time gain
The quarterly report as of March 31, 2026 reads like a breakthrough at first glance: diluted earnings per share of $2.63 against $1.91 a year earlier, net income of $161.6 million against $122.8 million. But the income statement carries a line that did not exist a year ago:
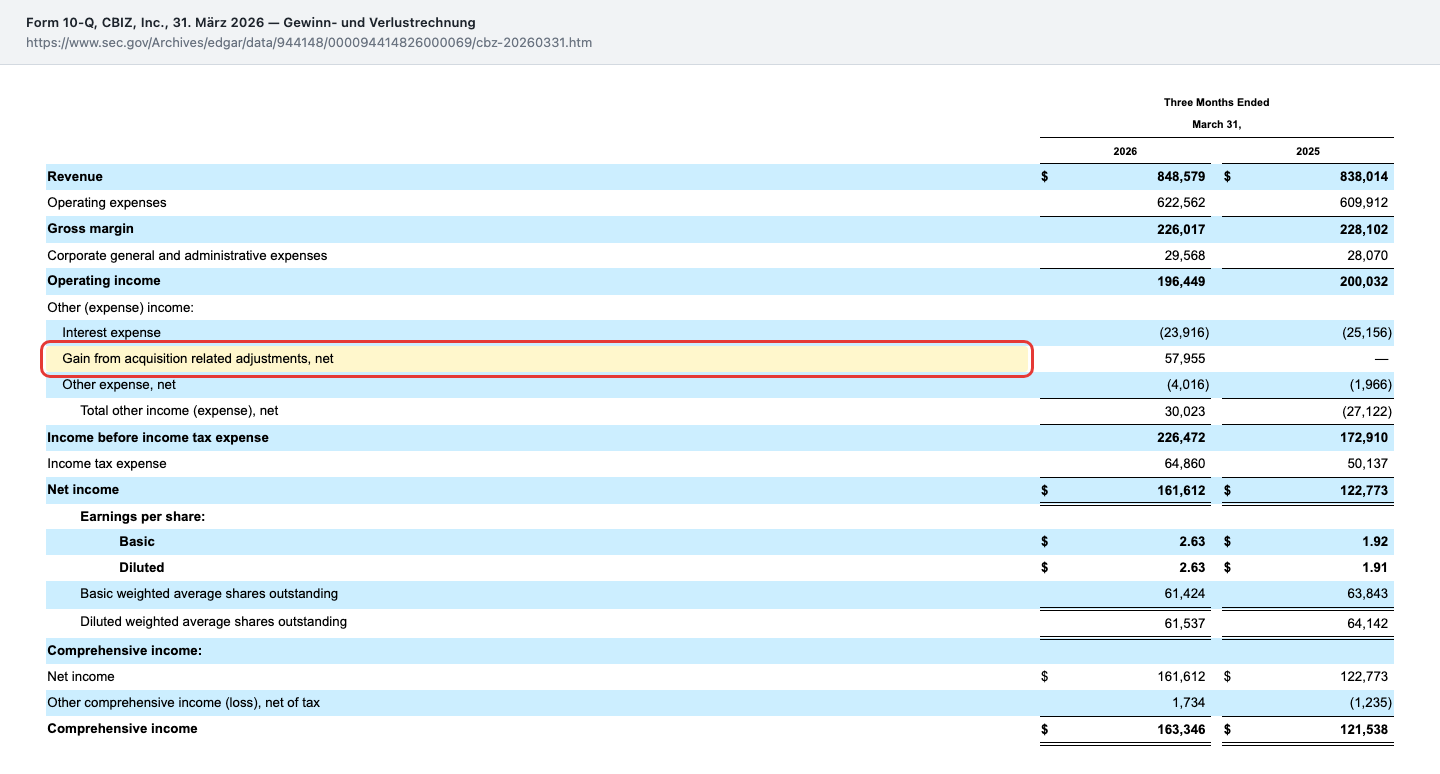
Note 3 explains where the money came from: CBIZ finalized the working capital and purchase price settlement for the Marcum transaction, received $53.1 million in cash on January 26, 2026 ($46.5 million working capital adjustment, $3.5 million first installment of a note receivable, $3.1 million from an indemnity escrow) and booked a gain of $57.2 million, plus $0.8 million from other adjustments. This is not accounting trickery — it is a properly recorded, one-time credit out of the purchase agreement. But it does not repeat.
The more telling line sits one level above: operating income fell from $200.0 million to $196.4 million even though revenue rose 1.3 percent to $848.6 million. Backing the one-time gain out at the group tax rate of 28.6 percent for the quarter leaves diluted earnings per share of roughly $1.96 rather than $2.63 — still a touch above the prior-year $1.91, but hardly a breakthrough. Remember: a record you no longer recognize once a single line is removed is a record with an expiry date.
No. 3: 6.2 million shares are still to come — on a calendar
Part of the purchase price was paid in CBIZ stock. It does not arrive all at once but in monthly installments, and part of it still lies ahead:

"Pursuant to the terms of the Transaction, with respect to the 13.6 million shares of stock consideration, approximately 7.3 million shares, in aggregate, were delivered from January 2, 2025 to March 31, 2026 to the selling shareholders. The remaining 6.2 million shares will be delivered in 21 monthly installments starting on April 1, 2026."
— CBIZ, Inc., SEC quarterly report 10-Q as of March 31, 2026, Note 3 (Business Combinations)
As of April 27, 2026, 53,648,732 shares were outstanding. The undelivered 6.2 million therefore equal about 11.6 percent — spread across 21 months, roughly 295,000 shares a month through the end of 2027. The annual report names the consequence itself: former Marcum partners are no longer subject to contractual resale restrictions, and persistent selling, or merely the perception of it, could weigh on the share price. The fair counterweight: CBIZ buys its own shares back. In 2025 it repurchased 2.4 million shares for a combined $160.0 million, and in the first quarter of 2026 roughly 1.1 million for $29.0 million. On February 11, 2026 the board reset the program to 5 million shares, running through March 31, 2027. For a shareholder that means new paper arrives every month while the company buys back — and who wins is decided quarter by quarter.
No. 4: 96.6 percent of the purchase price is goodwill and intangibles
When one company buys another and pays more than the individual assets are worth, the remainder lands on the balance sheet as goodwill. Everyday picture: buying a bakery means paying not only for ovens and flour but also for the regulars — you can touch the ovens, not the regulars.
With Marcum that ratio is extreme. The final purchase price allocation in the 2025 annual report shows total consideration of $1,997.8 million. Of that, $1,439.3 million is goodwill and $490.0 million other intangible assets (largely client relationships) — 96.6 percent combined. Net assets acquired came to $558.5 million. For roughly two billion dollars CBIZ essentially bought a client list and a workforce.
For an advisory firm that is not unusual — but it has a consequence the company writes into its own filing. As of March 31, 2026, $2,856.2 million of goodwill and intangibles sit in a balance sheet of $4,630.0 million, or 61.7 percent. Goodwill alone is $2,000.3 million — more than the $1,894.2 million of equity. What happens if the expected benefits fail to materialize is set out in Note 13:

"Additionally, further declines in our market capitalization may result in the need for impairment assessments in the future, which could result in the recognition of an impairment charge."
— CBIZ, Inc., SEC quarterly report 10-Q as of March 31, 2026, Note 13 (Goodwill)
For context, without alarm: a goodwill impairment costs no cash and changes nothing in the operating business. It would, however, hit equity and reported profit — precisely the two figures that credit covenants and balance sheet ratios hang on. The striking part is the second sentence: the company names its own market capitalization as a possible trigger. If the share price falls, the probability of a test rises. That is the uncomfortable feedback loop in this balance sheet.
No. 5: Interest costs almost as much as the entire annual profit
The deal was not paid out of petty cash. On November 1, 2024 CBIZ entered into new credit facilities of $2.0 billion — a $1.4 billion term loan and a $600 million revolving facility, maturing November 1, 2029. The annual report shows the cost: interest expense rose to $107.2 million in 2025, from $34.4 million in 2024. Average debt stood at $1,517.9 million at 6.56 percent, against $538.6 million at 6.00 percent a year earlier.
This is the comparison worth memorizing: $107.2 million of interest against $115.4 million of net income. For every dollar the business keeps after tax, almost a second one goes to the banks. As of March 31, 2026, $1,551.5 million was outstanding under the facilities ($1,312.5 million term loan, $239.0 million revolver) against cash of $28.7 million. One bright spot: the blended effective rate fell to 6.11 percent in the first quarter of 2026, from 6.57 percent a year earlier.
And the credit agreement attaches conditions:

Two points matter here, and both are frequently misread. First: the permitted total net leverage ratio starts at 5.00 and steps down to 3.75 during and after the seventh fiscal quarter following closing. The bar rises year by year while CBIZ pays down. The company states its own target as net leverage of 2.0 to 2.5. Second: the agreement requires a minimum interest coverage ratio of 3.00 — and the report states that all covenants were complied with as of March 31, 2026. Our own fundamental data set shows an interest coverage of 2.01 (as of July 26, 2026). That is not a contradiction but a different calculation: credit agreements define earnings and interest by their own, usually more generous, rules. Trust the statement in the filing — and watch whether it is still there next quarter.
Valuation — what the market pays for this profit
Every figure below is a dated anchor, not a buy argument. As of July 26, 2026 our data set carries a share price of $42.60. Applied to the 53,648,732 shares from the cover page of the quarterly report, that is a market capitalization of roughly $2.29 billion. Adding the 6.2 million shares still to be delivered brings it to roughly $2.55 billion.
That produces a notable order of magnitude: the market values the entire company at less than one year of revenue — a price-to-sales ratio of about 0.8. Price to book is about 1.2 (equity of $1,894.2 million as of March 31, 2026). Measured against 2025 diluted earnings per share of $1.83, the price-to-earnings ratio is roughly 23.
The most important sentence on valuation sits elsewhere, though: debt comes on top of market capitalization. $1,551.5 million of financial debt less $28.7 million of cash gives roughly $1.52 billion of net debt — putting enterprise value at roughly $3.8 billion, or 1.4 times annual revenue. Anyone buying CBIZ buys two fifths of a bank along with it. Remember: a low price-to-sales ratio at a leveraged company is not proof of a bargain, it is half a calculation.
Professional coverage is thin: our data set holds only three analyst estimates as of July 26, 2026. For a company with a $2.3 billion market capitalization that is little attention — which cuts both ways: less pre-priced optimism, but also less corrective. The Piotroski F-score, which checks nine balance sheet and earnings characteristics, stands at 5 of 9 (as of July 26, 2026) — mid-field: not a warning sign like a reading of 2 or 3, but no seal of quality like an 8 or 9 either.
Opportunities and risks at a glance
What speaks for CBIZ:
- Recurring, largely non-cyclical work: bookkeeping, tax returns and payroll have to be done in bad years too. No single client carries the result.
- The deal is paid for and largely worked through: the purchase price settlement closed in January 2026, and integration costs fell from $64.3 million in 2025 to $3.1 million in the first quarter of 2026.
- The balance sheet is not thin despite the debt: $1,894.2 million of equity in a $4,630.0 million balance sheet (March 31, 2026), a ratio of roughly 41 percent. All covenants were met at the reporting date.
- Valuation is modest: roughly 0.8 times revenue and 1.2 times book value. Anyone who believes the acquired client base holds is paying no premium for it.
- CBIZ buys back its own stock — $160.0 million in 2025 — and reset the program to 5 million shares in February 2026.
What speaks against it:
- Organic growth is minimal: about 1.7 percent in 2025, and 2.1 percent in the benefits and insurance business that no acquisition supported. Without deals, CBIZ is a very slow company.
- Interest eats the profit: $107.2 million of interest against $115.4 million of net income in 2025. Only as the $1.55 billion of debt comes down will earnings reach the bottom line.
- Dilution continues: 6.2 million shares, about 11.6 percent of today's count, arrive monthly through the end of 2027 — to sellers with no lock-up left.
- 61.7 percent of the balance sheet is goodwill and intangibles, and goodwill alone exceeds equity. The company names its own market capitalization as a possible impairment trigger.
- The latest result is far paler without the one-time gain: operating income fell in the first quarter of 2026 despite higher revenue.
- The company's own filing lists technological change and artificial intelligence explicitly as competitive threats — for a provider whose core is bookkeeping and tax returns, that is not boilerplate.
A human conclusion
Back to the revenue illusion from the start. We opened with a number that sounds like success — revenue up 73 percent since 2023 — and set a second one beside it that sounds like the opposite: earnings per share down 23 percent. Both are correct. The gap between them is the entire story of this company: between what comes in at the top and what reaches the shareholder at the bottom sit two billion dollars of purchase price, $1.55 billion of debt and 12.6 million additional shares.
That is not a scandal but a bet — and CBIZ did not place it quietly. It placed it in public, on the record. It pays off if the acquired clients stay, if integration costs genuinely run out, and if the company works its debt down to the 2.0 to 2.5 net leverage it set for itself. Then a much larger revenue base meets a much smaller interest bill, and $1.83 per share can become more again. It does not pay off if the clients wander — because what was bought was not machinery but relationships.
What interests us most about this case is its timing. Almost everything that decides the next few quarters has a date. The shares arrive monthly through the end of 2027. The covenant step-down follows a calendar. The next quarter is the first without a one-time gain. An investor here does not have to guess the future — only to check whether the deadlines hold. We will not tell you what to do with that. We will only tell you where to look. What you make of it is your decision. And that is exactly how it should be.
Sources
- Quarterly report 10-Q as of March 31, 2026, filed April 30, 2026 — CBIZ, Inc., CIK 0000944148 (most recent periodic report)
- Annual report 10-K for 2025, filed February 26, 2026 and the amendment 10-K/A of March 2, 2026 (Amendment No. 1 — re-filed officer certifications only, no restatement)
- Annual report 10-K for 2024, filed February 28, 2025
- Annual report 10-K for 2023, 10-K for 2022 and 10-K for 2021 — source of the 2021 to 2023 revenue and earnings series
- Current report 8-K of February 17, 2026, Item 8.01 — continuation of the share repurchase program, 5 million shares through March 31, 2027
- Fundamental data & SEC filings (annual and quarterly reports, 10-K/10-Q): metrics, price and valuation data, as of July 26, 2026
- Hook: our in-house stock scanner "Turnaround Candidates" — rank 17 of 62 U.S. hits, turnaround check 7 of 8, as of July 25, 2026; the lists are recalculated daily.
This analysis is journalistic commentary based on publicly available documents. It is not investment advice, not a buy or sell recommendation and not a solicitation to buy or sell securities. Shares can lose value at any time, up to a total loss. All figures carry their respective as-of dates and may have changed since publication. The author holds no position in CBIZ, Inc. at the time of publication.
Our Bottom Line at a Glance
- Business model & market position positive
- Bookkeeping, tax returns, payroll and insurance brokerage for small and mid-sized U.S. companies are recurring, largely non-cyclical services, and no single client carries the result. After the Marcum acquisition closed on November 1, 2024, CBIZ generated revenue of $2,758.0 million in 2025 with more than 9,500 team members, up from $1,104.9 million in 2021.
- Quality of growth negative
- The growth was bought: of the $944.5 million revenue increase in 2025, the annual report attributes $914.2 million to acquisitions net of divestitures — leaving roughly 1.7 percent organic. Benefits and Insurance Services, the practice group no acquisition supported, grew 2.1 percent to $409.6 million in 2025.
- Earnings per share & dilution negative
- Diluted earnings per share of $1.83 in 2025 sit below the $2.39 of 2023, even though revenue rose 73 percent over the same period. The diluted share count climbed from 50.6 million to 63.2 million. Of 13.6 million shares of stock consideration, 6.2 million are still outstanding and will be delivered in 21 monthly installments from April 1, 2026 — about 11.6 percent of the 53,648,732 shares outstanding as of April 27, 2026.
- Leverage & interest burden negative
- Interest expense rose to $107.2 million in 2025 (2024: $34.4 million), close to the entire net income of $115.4 million; average debt stood at $1,517.9 million at 6.56 percent. As of March 31, 2026, $1,551.5 million was outstanding against $28.7 million of cash. The credit agreement requires a total net leverage ratio stepping down from 5.00 to 3.75 and a minimum interest coverage ratio of 3.00; the report states all covenants were met at the reporting date.
- Balance sheet quality neutral
- As of March 31, 2026, equity of $1,894.2 million sits in a balance sheet of $4,630.0 million, roughly 41 percent. However, $2,856.2 million of that is goodwill and intangibles (61.7 percent of total assets), and goodwill alone exceeds equity at $2,000.3 million. Note 13 of the quarterly report explicitly names failure to achieve the anticipated benefits of the transaction, and further declines in market capitalization, as possible triggers for an impairment charge.
- Valuation & market picture neutral
- A market capitalization of roughly $2.29 billion (53,648,732 shares at $42.60, as of July 26, 2026) equals about 0.8 times annual revenue and about 1.2 times book value — cheap at first glance. Adding net debt puts enterprise value at roughly $3.8 billion, or 1.4 times revenue. Measured against 2025 earnings per share, the price-to-earnings ratio is about 23. Our data set holds only three analyst estimates.
CBIZ nearly doubled in size overnight — paid for with roughly two billion dollars of purchase price, $1.55 billion of debt and 12.6 million additional shares. Revenue reached $2,758.0 million in 2025, yet diluted earnings per share of $1.83 still sit below the $2.39 of 2023. Organic growth runs at about 1.7 percent, interest of $107.2 million nearly matches the full-year profit of $115.4 million, and 6.2 million shares will be delivered monthly through the end of 2027. The record quarter ended March 31, 2026 contains a $58.0 million one-time gain from the purchase price settlement while operating income slipped. The bet is legible and dated: if the acquired clients stay and the interest bill falls, the new size will reach the shareholder. Not investment advice.
What Our Rating Means
Open questions
The business works in principle, but one material question is open. As long as it stays open, our findings do not carry a quality verdict.
The business itself holds up: recurring services for the middle market, no client concentration, $1,894.2 million of equity and all covenants met as of March 31, 2026 — there is no substance finding in the sense of a going concern warning, negative equity or interest coverage below 1. What is open is the decisive operating question: whether the two billion dollar acquisition pays off has not been proven. Organic growth is only about 1.7 percent, earnings per share sit below the 2023 level, $107.2 million of interest stands against $115.4 million of annual profit, 61.7 percent of the balance sheet is goodwill and intangibles, and the latest record quarter draws a quarter of its profit from a one-time credit. This is the textbook case for yellow: not a sick business, but an unproven transformation. The valuation at roughly 0.8 times revenue is not the reason for this colour — price does not determine this rating. The decision is yours.
A journalistic assessment by our editorial team at the time of the deep dive, based on public sources — not investment advice and not a solicitation to buy or sell. Your personal circumstances (investment goals, risk capacity, taxes) cannot be taken into account. What our levels mean, how verdicts are formed, and what conflicts of interest exist →
Worth Noting
- CBIZ landed on the research list through our in-house stock scanner "Turnaround Candidates": rank 17 of 62 U.S. hits, turnaround check 7 of 8, as of July 25, 2026. These lists are recalculated every day — rank and score are a dated snapshot. The two mandatory pillars are a gap of at least 50 percent to the all-time high and an Altman Z-score of at least 1.1 with positive equity. Pillar 2 is comfortably met: the Altman Z-score stands at 6.01 (data as of July 26, 2026). Membership hangs on Pillar 1 — the gap to the all-time high is 64.78 percent against a 50 percent threshold; from a price of roughly $60.50 (all-time high about $121, price $42.60 on July 26, 2026) the stock leaves the list without anything changing in the business.
- The fiscal year matches the calendar year. The most recent periodic report is the quarterly report 10-Q as of March 31, 2026 (filed April 30, 2026); after that, and up to the data cut-off of July 26, 2026, only a current report 8-K of May 15, 2026 on annual meeting results (Item 5.07), insider filings (Form 4) and beneficial ownership filings were submitted. The report for the quarter ended June 30, 2026 was not yet available. The amendment 10-K/A of March 2, 2026 covers only the re-filing of officer certifications and contains no restatement.
- Price and valuation figures are dated anchors, not buy arguments: a share price of $42.60 and a market capitalization of roughly $2.29 billion as of July 26, 2026, calculated on the 53,648,732 shares from the cover page of the quarterly report (April 27, 2026). All balance sheet and earnings figures carry the as-of date of their respective report.
- As of July 26, 2026 no takeover, merger or take-private process is under way. The term "the Transaction", used throughout the filings, refers to the acquisition of the Marcum business already completed on November 1, 2024, not to a pending process; accordingly there is no Form S-4, no SC 13E3, no Form 25 and no Form 15.
- Possible confusion: CBIZ, Inc. (CBZ) is not the same as CBIZ CPAs, P.C. — the latter is the legally separate CPA firm linked to CBIZ through an administrative service agreement. Marcum LLP also continues to exist as a legal entity; what was acquired was the non-attest business. The former name Century Business Services appears in documents up to 2006.
Frequently Asked Questions
CBIZ supplies small and mid-sized U.S. businesses with the administrative work they do not want to handle themselves: bookkeeping, tax returns, payroll, advisory services, plus benefits and insurance solutions. In 2025, revenue of $2,301.5 million came from Financial Services, $409.6 million from Benefits and Insurance Services and roughly $47 million from National Practices. The company reported more than 9,500 team members at year end.
On November 1, 2024 CBIZ acquired the non-attest business of Marcum LLP, a New York based accounting and advisory firm. Final consideration came to $1,997.8 million. Of that, $1,439.3 million was recorded as goodwill and $490.0 million as other intangible assets, 96.6 percent combined; net assets acquired were $558.5 million. Part of the price was paid in CBIZ stock.
Because far more shares are outstanding and interest costs climbed. The diluted share count went from 50.6 million in 2023 to 63.2 million in 2025, and interest expense from $34.4 million in 2024 to $107.2 million in 2025. Diluted earnings per share therefore fell from $2.39 in 2023 to $1.83 in 2025 while revenue rose 73 percent over the same span.
Of 13.6 million shares of stock consideration, roughly 7.3 million had been delivered by March 31, 2026. The remaining 6.2 million will be issued in 21 monthly installments from April 1, 2026, running through the end of 2027. Measured against the 53,648,732 shares outstanding on April 27, 2026 that is about 11.6 percent of additional supply. The recipients are no longer under any lock-up.
As of March 31, 2026, $1,551.5 million was outstanding under the credit facilities agreed in 2024: a $1,312.5 million term loan and $239.0 million drawn on the revolver, against cash of $28.7 million. The facilities total $2.0 billion and mature on November 1, 2029. The agreement requires a total net leverage ratio stepping down from 5.00 to 3.75 and a minimum interest coverage ratio of 3.00; all covenants were met at the reporting date.
Because both mandatory criteria were met on July 25, 2026: at least 50 percent below the all-time high, and an Altman Z-score above 1.1 with positive equity. That day CBIZ ranked 17 of 62 U.S. hits with 7 of 8 points in the turnaround check. Survival has ample headroom: the Altman Z-score stands at 6.01 (data as of July 26, 2026). The tighter criterion is the crash — 64.8 percent below the all-time high against a required 50 percent: if the price recovers from $42.60 to about $60.50, CBIZ drops off the list. The lists are recalculated daily, so the ranking is a snapshot.
U.S. independence requirements and state accountancy laws bar a listed company from performing attest services itself. CBIZ therefore works through administrative service agreements with independent CPA firms; there were four as of December 31, 2025. The best known is CBIZ CPAs, P.C. with 421 stockholders. Most stockholders of those firms are also CBIZ employees.
Because of tax season. The annual report itself states that most of the annual earnings per share is earned in the first half of the year, since the heaviest volume of activity falls in the first four months. The first quarter is therefore by far the strongest — $848.6 million of revenue in the first quarter of 2026 — and the fourth is routinely weak. Annualizing a single CBIZ quarter is guaranteed to mislead.
Found an error?
Did you spot a factual error, an outdated number, or a typo in this deep dive? Let us know briefly — your report goes straight to the editorial team.