CorVel: Record Profits, Zero Debt — and Still on the Turnaround List
CorVel reviews the bills that pile up after American workplace injuries. In the year ended March 31, 2026 the company earned $110.3 million, more than ever before, held $233.1 million in cash and says it has carried virtually no interest-bearing debt for 35 years. The stock still closed 53 percent below its split-adjusted all-time high of February 5, 2025 on July 24, 2026 — which is exactly why it shows up in a turnaround scanner. Except that what turned here is the price, not the business. We read the annual report, the proxy statement and the June 1, 2026 filing, and we find a buyback that barely moves the needle, a shareholder with 38 percent, and a chief executive the annual report does not yet know about. No advice — just the question of who was ever sick here.
 Thomas Mücke
Founder & Publisher
Thomas Mücke
Founder & Publisher
Chart
Interactive price chart (TradingView).
Note: pure fact-based analysis, not investment advice and not a solicitation to buy or sell. All figures without guarantee.
There is an investing trap that springs precisely when you are being diligent: the case file trap. It works like this. Somebody hands you a list, and above the list there is a word. If that word is "turnaround", your mind reads every number underneath it like a medical chart — it hunts for symptoms. And because symptoms can always be found, it finds some. The question that gets lost along the way is the most important one: was anyone ever actually sick here? At CorVel Corporation (Nasdaq: CRVL) the answer is no. The fiscal year ended March 31, 2026 was the best in company history — $958.5 million in revenue, $110.3 million in net income, $155.6 million of operating cash flow, virtually no debt. The stock still closed 53.4 percent below its high of February 5, 2025 on July 24, 2026. So let us make a deal: before we write a diagnosis, we read what the company itself filed with the U.S. securities regulator, the SEC — the annual report (Form 10-K) of May 22, 2026, the quarterly report (Form 10-Q) for the period ended December 31, 2025, the proxy statement of June 26, 2026 and a current report (Form 8-K) dated June 1, 2026. An SEC filing is honest under penalty of law. And these tell the story of a buyback worth less than its price tag, a man with 38 percent — and a chief executive the annual report has not met yet.
What this analysis covers
- What CorVel actually does — the quiet bill reviewer behind the workplace injury
- How the stock reached our desk
- The numbers over the years — what genuinely impresses
- What the filings say — five uncomfortable truths
- Valuation — what the market pays for this profit
- Opportunities and risks at a glance
- A human conclusion
- Sources
What CorVel actually does — the quiet bill reviewer behind the workplace injury
Picture a warehouse in Ohio. Someone slips and breaks an arm. From that moment on a second, invisible process begins: doctor bills, physical therapy, prescriptions, an independent medical examination, perhaps a dispute over fitness for work. The employer or its insurer has to pay all of it — and has to know whether each individual bill is correct and appropriate. That second process is CorVel\'s business.
The company sits in Fort Worth, Texas, was incorporated in Delaware in 1987 and has been publicly traded since June 28, 1991. It operates entirely within the United States and sells two things, reported as separate revenue streams:
- Network solutions — the paperwork side: automated review of medical bills against state fee schedules, a proprietary provider network (more than 1.2 million providers as of March 31, 2026), pharmacy and directed care management. Fiscal 2026 revenue: $362 million, up 15 percent.
- Patient management — the human side: claims administration, case management, 24/7 nurse triage, return-to-work services. Fiscal 2026 revenue: $596 million, up 3 percent.
Where bill review grows faster than case management, margins grow too — the review business is the higher-margin of the pair, which the annual report explicitly cites as the reason margins improved. That explains a good part of what the numbers show in a moment.
The engine behind it is software, and the annual report describes it with unusual candour:
"CorVel's artificial intelligence engine includes over 100 million individual rules, which offers a comprehensive, paperless solution that surpasses the capabilities of traditional, manual bill review processes."
— CorVel Corporation, Form 10-K for fiscal year 2026, Item 1 (Business)
As of March 31, 2026, 5,239 people worked for CorVel, 93 percent of them permanently remote or in a hybrid arrangement — at a service company whose product consists of review work, phone calls and documents, that is not a detail but a cost model. No single customer accounted for 10 percent or more of fiscal 2026 revenue, although two customers did cross that threshold in accounts receivable. For a look at how differently a U.S. health care provider behaves when it runs its own hospitals instead of auditing bills, see our Encompass Health analysis.
That frames the central tension of this analysis, which runs through every chapter that follows: what fell here is not the company but the price the market pays for the same company. A scanner cannot measure that difference. A reader can.
How the stock reached our desk
We run roughly 3,500 stocks through our scanners every day. CorVel landed on the research list through our in-house stock scanner "Turnaround Candidates": rank 15 of 62 U.S. hits, turnaround check 7 of 8, as of July 25, 2026. To reproduce it: open the scanner, set the country filter to "US", sort by the turnaround check column. These lists are recalculated every day — the ranking is a dated snapshot, not a permanent state.
The model has two mandatory pillars, and failing either one removes a stock immediately, however well the business is doing:
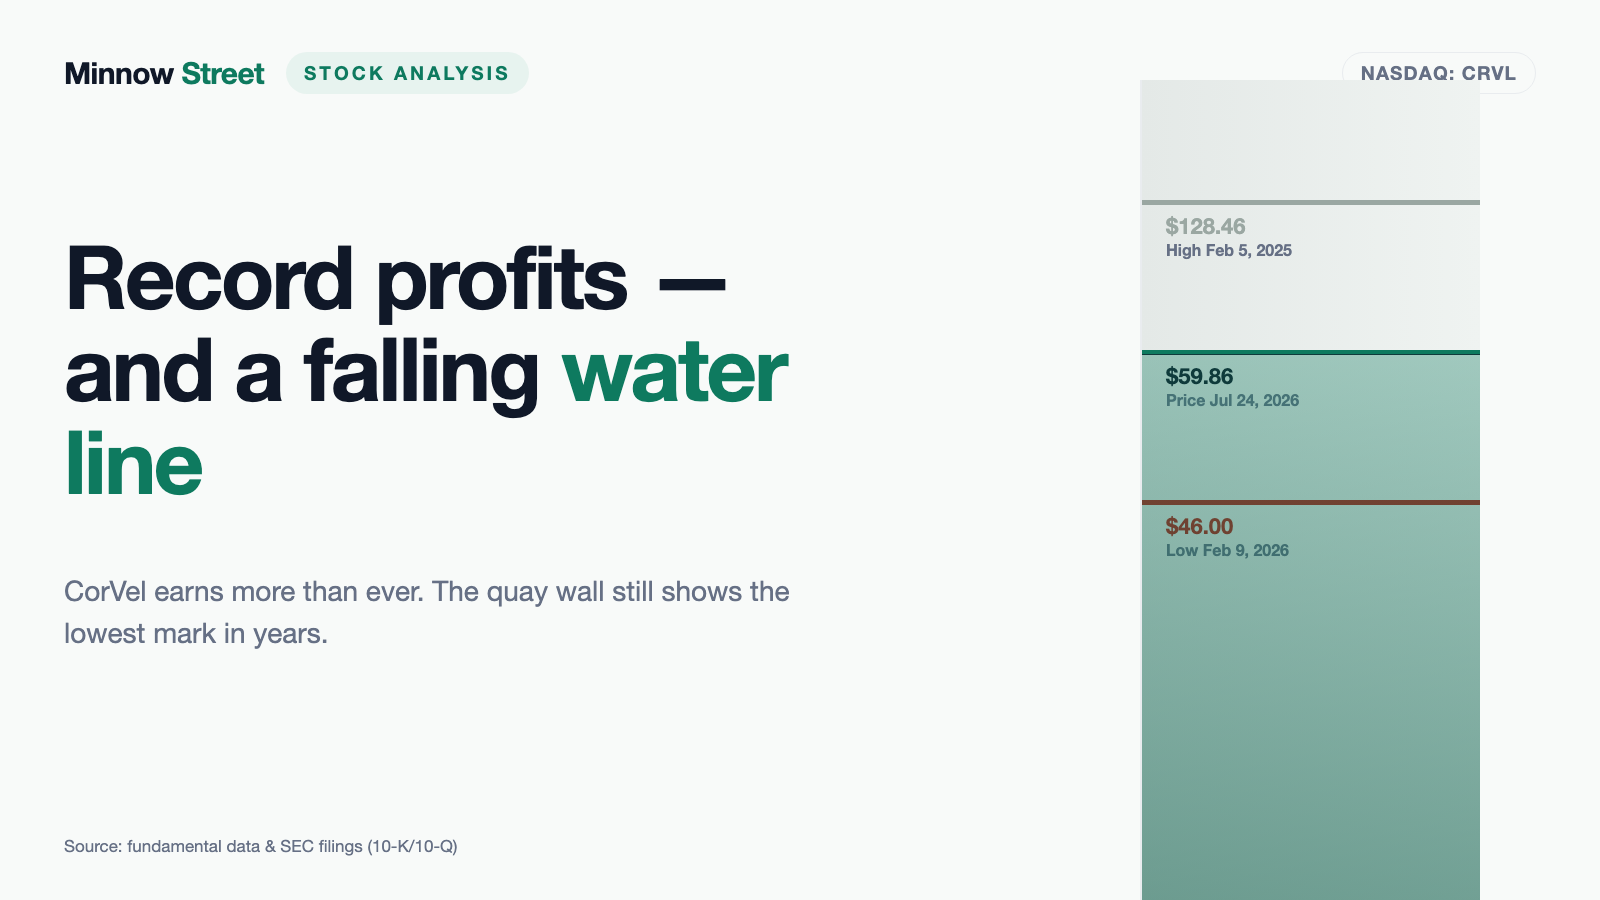
- Pillar 1 — the crash: the stock has to trade at least 50 percent below its all-time high. No real crash, no turnaround. CorVel closed at $59.86 on July 24, 2026 against a split-adjusted all-time high of $128.46 set on February 5, 2025 — a gap of 53.4 percent.
- Pillar 2 — survival: the Altman Z-score (a bankruptcy early-warning measure built from several balance sheet ratios) must exceed 1.1, equity must be positive, and no more than one balance sheet warning flag may be present. CorVel carries an Altman Z of 12.2 and an equity ratio of 61.3 percent (data as of July 26, 2026). Tradability applies as well: a price above $3 and average daily dollar volume above $2 million — CorVel runs at roughly $13.2 million.
Only then does the actual turnaround check begin: eight points, four drawn from the quarterly numbers (revenue direction, net margin, operating cash flow, balance sheet healing) and four from market behaviour (price back above the 50-day line, three-month relative strength beating twelve-month, net insider buying, institutional accumulation). A stock is listed once it reaches at least 6 of 8; CorVel stood at 7 on July 25, 2026.
One of those eight points CorVel demonstrably does not earn. In the twelve months to July 24, 2026 there were zero insider purchases against seven insider sales — sales at $91.54, $89.16, $76.94 and, most recently on March 16, 2026, at $54.00 per share (source: fundamental data, as of July 26, 2026). On the other side of the ledger, institutions were accumulating: 14 increasing positions against 6 reducing, roughly 3.7 million shares net.
And now the sentence that makes this list honest: CorVel is on it not because the company is struggling, but because the price fell. The load-bearing condition is pillar one, and it is tight. If the stock rises above roughly $64.23 — that is, 50 percent below the all-time high — CorVel drops out of the very list that put it on this desk. Not because anything got worse, but because it would no longer be crashed enough. We described the same mechanism in this series for another stock that combines growth with a beaten-down price, in our FactSet analysis. The principle worth remembering: a scanner sorts by attributes, not by reasons. You have to read the reason yourself.
The numbers over the years — what genuinely impresses
Let us start with what genuinely impresses, because there is plenty of it. CorVel\'s fiscal year ends March 31, so fiscal 2026 ran from April 1, 2025 through March 31, 2026. Anyone comparing CorVel with calendar-year reporters has to account for that three-month shift.
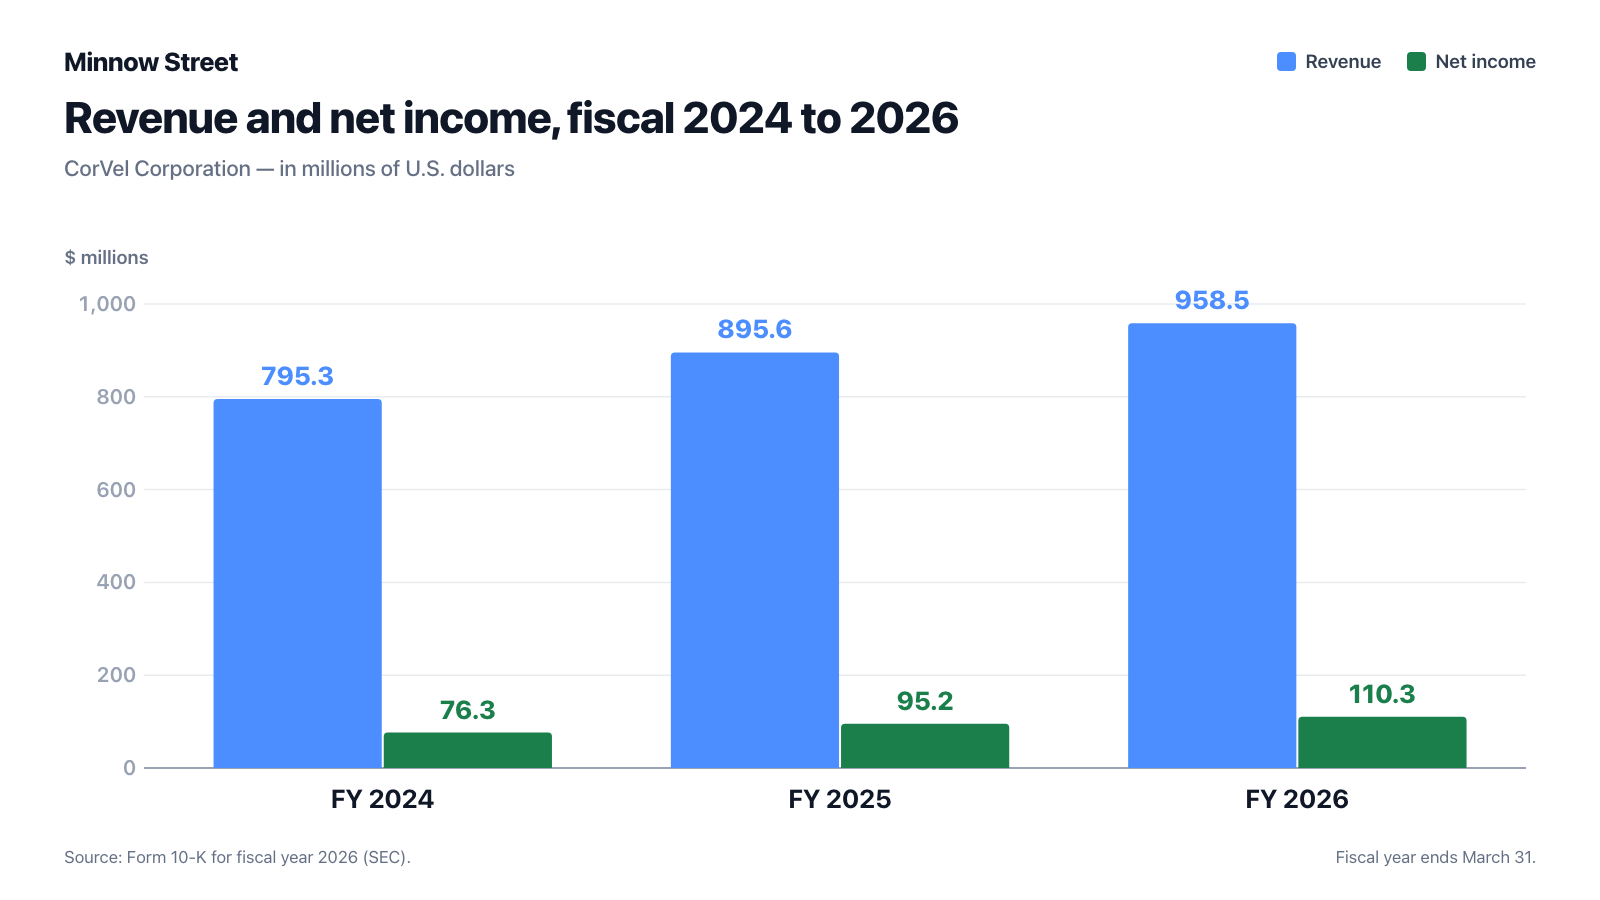
Both lines read the same way. Revenue climbed from $795.3 million in fiscal 2024 through $895.6 million in fiscal 2025 to $958.5 million in fiscal 2026; net income from $76.3 million through $95.2 million to $110.3 million. The gap between the two growth rates matters more than the absolute figures: revenue rose 7.0 percent in fiscal 2026, profit 16.0 percent. That is the evidence that the company is not merely doing more work but better work.
The net margin improved accordingly from 9.6 percent through 10.6 percent to 11.5 percent, and diluted earnings per share from $1.47 through $1.83 to $2.14. Operating cash flow — the money that actually arrives — climbed from $99.2 million through $127.3 million to $155.6 million. After $45.4 million of capital expenditure, roughly $110.3 million of free cash flow remains. The rule of thumb: when free cash flow matches reported profit, the profit is not an accounting effect.
One honest caveat belongs here. Capital spending is growing faster than the business: $45.4 million in fiscal 2026, after $35.8 million and $29.2 million, against depreciation and amortisation of $31.8 million. CorVel is investing roughly one and a half times what it writes off, mostly in software development according to the filing. As long as margins keep rising, that is money well spent. If margins stall, the same number becomes a cost problem.
The balance sheet as of March 31, 2026 is remarkably tidy: $642.99 million of total assets, of which $394.23 million is equity (a ratio of 61.3 percent), and $233.07 million of cash. There is no financial debt; the only meaningful long-term liability is $20.69 million of lease obligations. The report puts it this way:
"The risk of decreased operating cash flow from a decline in earnings is partially mitigated by the diversity of the Company's services, geographies and customers, and the Company has had virtually no interest-bearing debt for the past 35 years."
— CorVel Corporation, Form 10-K for fiscal year 2026, Item 7 (Liquidity and Capital Resources)
And because buybacks feature heavily in what follows, here is the scale of the programme. Since it began in the autumn of 1996, CorVel has repurchased 115,259,435 shares for $888 million through March 31, 2026 — against 50,909,297 shares still outstanding. In other words the company has taken more than twice today\'s share count out of the market, funded from cumulative net earnings of roughly $1 billion. That is this company\'s culture expressed in a single number.
What the filings say — five uncomfortable truths
Uncomfortable truth No. 1: $56.2 million of buybacks — and 450,247 fewer shares
A buyback is supposed to make your slice of the pie bigger: fewer shares, same profit, more profit per share. In fiscal 2026 CorVel put real money behind it:

782,744 shares for $56.2 million, an average of $71.81 each. That sounds like a meaningful bite. Then you turn to the statement of stockholders\' equity in the same filing and find the offset: 276,905 new shares from option exercises, 13,987 from the employee stock purchase plan and 41,605 issued as consideration for an asset acquisition — 332,497 shares flowing back the other way.
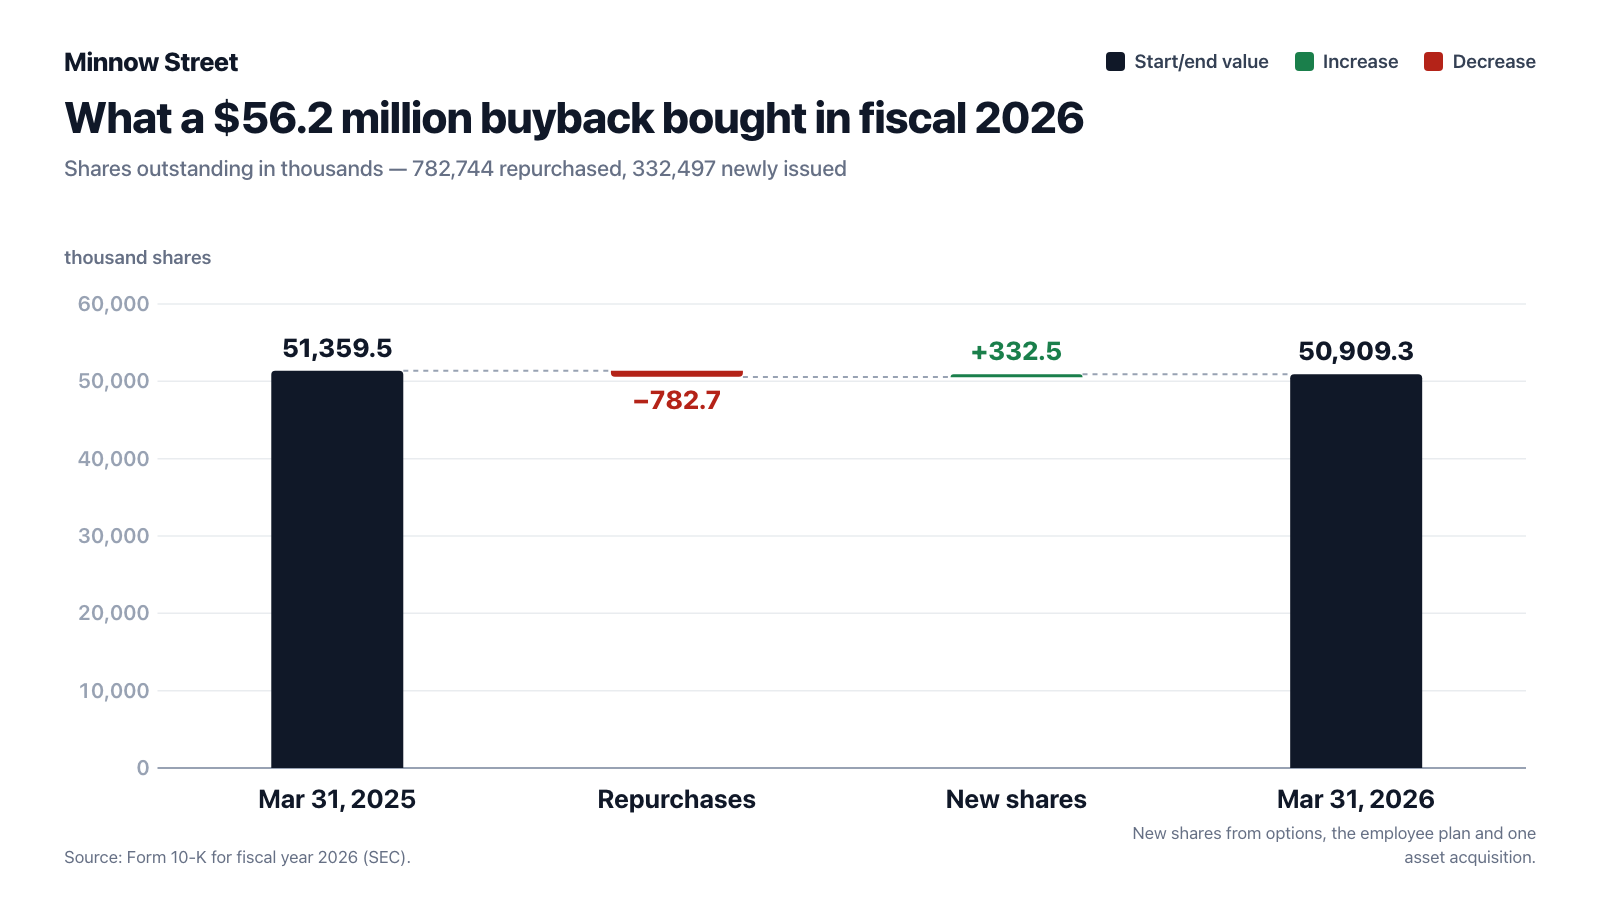
Net of everything, shares outstanding fell from 51,359,544 to 50,909,297 — a reduction of 450,247 shares, or 0.88 percent. Work it backwards: $56.2 million divided by 450,247 shares that genuinely disappeared comes to roughly $125 per share. That is what shrinking the pie actually cost, while the market price paid was $71.81. Remember this: a buyback is only a return when the share count actually falls. Otherwise it is, in large part, employee compensation routed through the balance sheet instead of the income statement.
In fairness: diluted earnings per share still rose 16.9 percent, because profit itself grew so strongly, and the direction is right — average diluted shares fell from 51,994 thousand to 51,625 thousand. It is simply one percentage point of effect, not leverage.
Uncomfortable truth No. 2: one man holds 38 percent — and chairs the committee that picks the board
The proxy statement filed June 26, 2026 contains a table you do not see every day at a company worth three billion dollars.
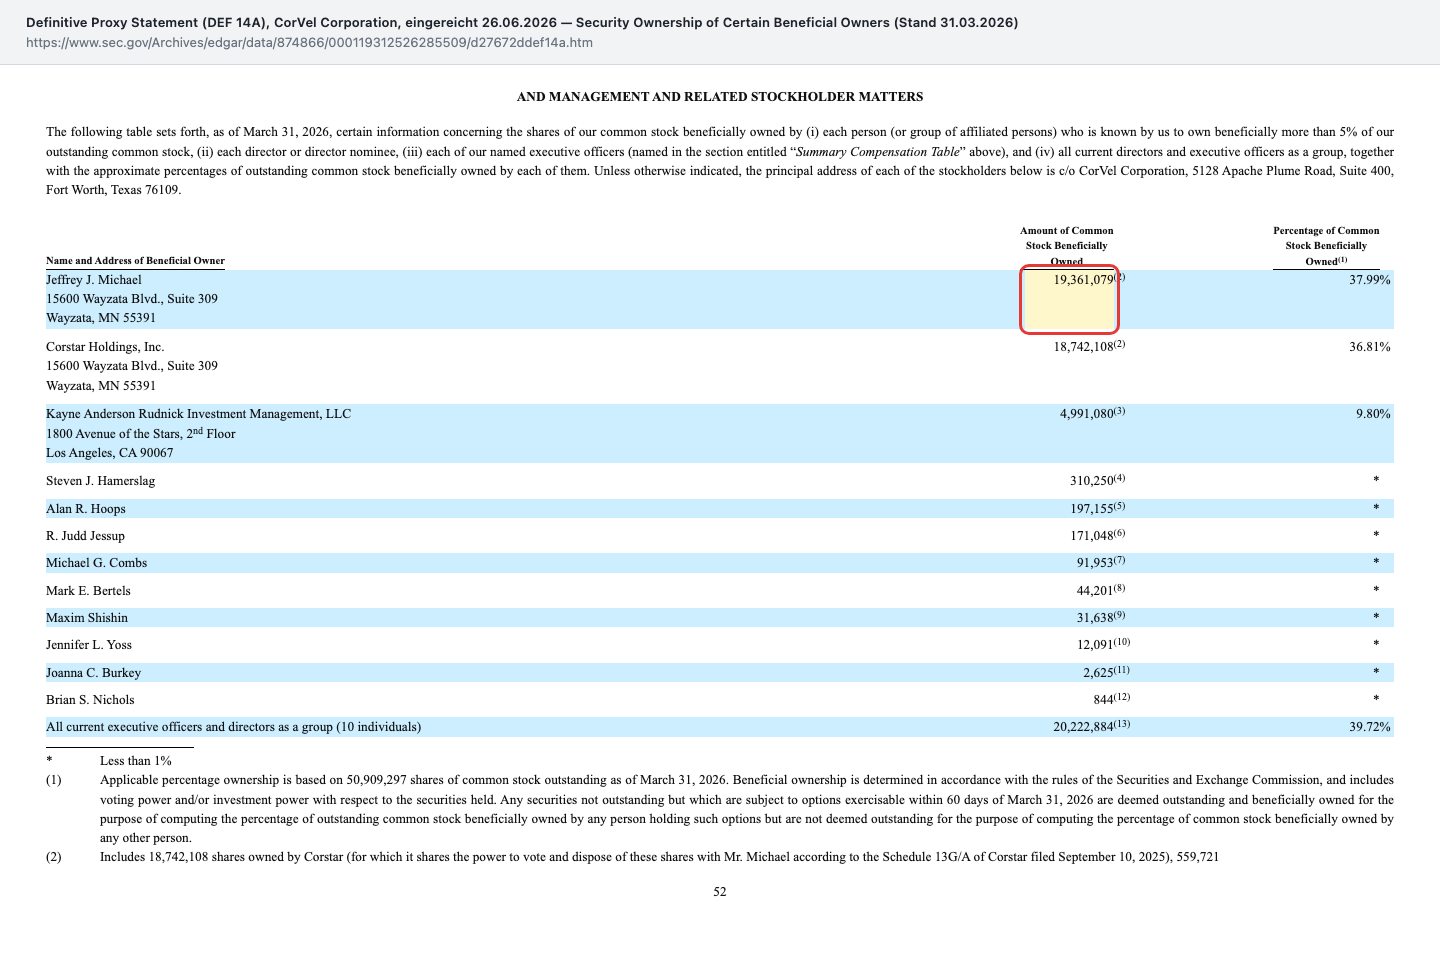
Jeffrey J. Michael held 19,361,079 shares, or 37.99 percent, as of March 31, 2026 — 18,742,108 of them through Corstar Holdings, Inc. of Wayzata, Minnesota. Corstar\'s sole shareholder is the Michael Family Grantor Trust, whose trustee is Mr. Michael himself. He has sat on the board since September 1990, meaning since before the initial public offering. All officers and directors together — ten people — hold 39.72 percent.
None of that is inherently good or bad: an owner who has been present for 36 years thinks in different time horizons than a quarterly market does. What stands out is the distribution of roles. The same proxy lists Mr. Michael as an independent director, as chair of the nomination and governance committee — the body that decides who is even put forward for election to the board — and as a member of the compensation committee. Each of those committees met exactly once during fiscal 2026.
Translated into an everyday question: who is supervising whom? The largest shareholder occupies the seat where the candidate list for his own oversight is drawn up. This is legally clean in the United States and it is disclosed — that is why it appears in the document at all. For a minority shareholder it still means this: on every question that requires a majority — a takeover, a sale, a take-private, a charter amendment — one address in Minnesota has a decisive say. A hostile bid is effectively off the table. For the record, as of July 26, 2026 there is no takeover, merger or take-private process under way: the company\'s SEC record contains no Form S-4, no Schedule 13E-3 and no merger proxy.
Uncomfortable truth No. 3: the annual report names a chief executive who left that role on July 1, 2026
Check the calendar on this one. The annual report was filed on May 22, 2026. Its risk factors carry the standard key-person sentence: the loss of key personnel, "especially Michael Combs, our Chairman, Chief Executive Officer and President", could materially harm the business. Ten days later, on June 1, 2026, the company announced exactly that change:

Michael G. Combs — 34 years with the company, chief executive since January 2019, president since April 2017 and chairman since November 2024 — handed over operational leadership on July 1, 2026 and became executive chair. His pay in that role: $25,000 a month plus continued health insurance. His successor is Sarah Scott, 49, who joined in 1999 and most recently served as executive vice president for product and corporate services. Her base salary is $600,000, with a bonus target of 75 percent of that and a grant of 25,000 stock options.
Why this matters here: anyone valuing the stock off the annual report is valuing a company with a chief executive who no longer holds that job. The succession is internal, so it is not a rupture — but the first quarter under new leadership ended June 30, 2026, and the corresponding quarterly report had not been filed as of this analysis (July 26, 2026). Remember: an annual report is always a snapshot with an editorial deadline. What happened afterwards lives in the 8-K.
Uncomfortable truth No. 4: the entire cash balance sits above the deposit insurance limit
The accounting policies contain a sentence you would not immediately expect at a debt-free company:

The Federal Deposit Insurance Corporation covers $250,000 per depositor per bank. As of March 31, 2026 CorVel held $233.07 million of cash plus $115.71 million of customer deposits administered on behalf of clients. Together that is $348.78 million — roughly 88 percent of equity and 54 percent of total assets. This is not an acute problem and it is common at companies this size; it is, however, the only meaningful counterparty risk on an otherwise immaculate balance sheet. Anyone who remembers the spring of 2023 knows why that sentence is no longer boilerplate.
Uncomfortable truth No. 5: seven insider sales, not a single purchase
Insider purchases are the most honest signal on a stock exchange because they cost money. Sales are the least honest, because there are a thousand harmless reasons for them — taxes, a house, diversification. The tally is nonetheless unambiguous: in the twelve months to July 24, 2026 the data record seven insider sales and not a single insider purchase. Shares were sold on August 20, 2025 at $89.16, on September 8, 2025 at $91.54, three times in November 2025 between $76.20 and $76.94 as well as at $72.35, and most recently on March 16, 2026 at $54.00 (source: fundamental data, as of July 26, 2026).
That last sale is the interesting one. At $54 the stock was already roughly 58 percent below its all-time high. Someone selling there apparently does not regard the price as a bargain — or had good private reasons. Both are possible, which is precisely why this is an indication rather than proof. But it is the one point the turnaround check withholds: the company buys its own shares. The people running the company do not.
Valuation — what the market pays for this profit
Start with the arithmetic: 50,691,185 shares outstanding (annual report cover page, as of May 19, 2026) at a closing price of $59.86 on July 24, 2026 give a market capitalisation of roughly $3.0 billion. Because CorVel holds more cash than debt, enterprise value sits below that at roughly $2.85 billion.
In orders of magnitude rather than decimal places (data as of July 26, 2026): the price-to-earnings ratio is around 28 on fiscal 2026 diluted earnings of $2.14 per share, the price-to-sales ratio around 3.2, enterprise value to EBITDA around 16, and price to book around 7.8. Return on equity is 30.8 percent and return on assets 15.1 percent.
How should that be read? Twenty-eight times earnings for a debt-free service business with an 11.5 percent net margin, a 30 percent return on equity and three consecutive record years is not a bargain-bin price — but it is no longer an excess either. For context: on September 30, 2025 the stock closed at $77.42 according to the annual report cover page, and the company itself repurchased stock at an average of $71.81 during fiscal 2026. The market today pays less than management paid over the past fiscal year. That is an argument — but an argument about price, not about quality.
There is no analyst consensus in our data (as of July 26, 2026): no average rating and no price target. That is plausible for CorVel, because with almost 40 percent of the shares tightly held the tradable portion is modest — the stock is simply too small for large houses. Anyone who wants a view here has to form it themselves. The Piotroski F-score, a nine-point test of the direction of a company\'s books, stands at 6 of 9: acceptable, not brilliant — genuinely healthy starts at 8. The Altman Z-score of 12.2 sits as far outside any danger zone as a debt-free balance sheet would suggest.
Opportunities and risks at a glance
What speaks for CorVel
- Three consecutive record years: revenue of $795.3 million, then $895.6 million, then $958.5 million; net income of $76.3 million, then $95.2 million, then $110.3 million (fiscal 2024 to 2026).
- Margins improve under their own power: net margin of 9.6, then 10.6, then 11.5 percent, driven by higher-margin bill review (up 15 percent to $362 million in fiscal 2026).
- A balance sheet without financial debt: $394.23 million of equity (a 61.3 percent ratio), $233.07 million of cash, an Altman Z of 12.2.
- Profit backed by cash: $155.6 million of operating cash flow and roughly $110.3 million free after capital expenditure — effectively identical to reported net income.
- No customer accounted for 10 percent or more of fiscal 2026 revenue; the business is spread across many clients.
- Owner culture: 115,259,435 shares repurchased for $888 million since 1996, funded out of current profits rather than borrowing.
What speaks against it
- Much of the buyback evaporates: $56.2 million in fiscal 2026 cut the share count by only 450,247 shares, or 0.88 percent.
- Concentration of power: 37.99 percent with one shareholder who also chairs the nominating committee and sits on the compensation committee; a tight free float and no analyst consensus.
- A leadership change effective July 1, 2026 — the first set of numbers under Sarah Scott is still outstanding.
- The valuation remains demanding: roughly 28 times earnings and 7.8 times book value for a business growing revenue at 7 percent.
- Capital spending outpaces revenue growth ($45.4 million against $31.8 million of depreciation in fiscal 2026) — if margins stop rising, that becomes cost pressure.
- Insiders are selling: seven sales and no purchases in the twelve months to July 24, 2026.
- Virtually all cash sits above the deposit insurance limit — the balance sheet\'s only counterparty risk.
A human conclusion
Back to the case file trap from the opening. We were handed a list headed "turnaround" and we went looking for symptoms. What we found is a company that has earned more than ever three years running, carries no debt, converts its profit into cash and buys its own shares. The patient was never ill. What fell is the price, not the business.
That does not make the decision easier, only more honest. If there is nothing to repair, there is no repair to bet on. What remains is a plain question: is a solid, slowly growing service business worth roughly 28 times its earnings? The filings offer three hints towards an answer. Management bought its own stock at higher prices during the past fiscal year. Insiders sold at lower ones. And above it all sits an owner with 38 percent who has been there since 1990 and is plainly in no hurry.
We are not going to tell you what to do with that. We will only say that "turnaround" is the wrong word here — and that a wrong word above a list can be the most expensive ingredient in an investment decision. What you make of it is your decision. And that is exactly as it should be.
Sources
- Form 10-K for fiscal year 2026 (ended March 31, 2026), filed May 22, 2026 — CorVel Corporation, CIK 0000874866
- Form 10-Q for the quarter ended December 31, 2025, filed February 5, 2026
- Form 10-K for fiscal year 2025, filed May 23, 2025
- Form 8-K of June 1, 2026, Item 5.02 (leadership transition effective July 1, 2026)
- Definitive proxy statement DEF 14A of June 26, 2026 (ownership, committees, compensation)
- Form 8-K of December 13, 2024 and Form 8-K of December 26, 2024 — three-for-one stock split effective December 24, 2024
- Fundamental data & SEC filings (annual and quarterly reports, 10-K/10-Q): metrics, price history, insider and institutional activity, as of July 24 to 26, 2026
- Hook: our in-house stock scanner "Turnaround Candidates" — rank 15 of 62 U.S. hits, turnaround check 7 of 8, as of July 25, 2026; the lists are recalculated daily.
This analysis is editorial commentary based on publicly available documents. It is not investment advice, not a recommendation to buy or sell, and not a solicitation to buy or sell securities. Stocks can lose value at any time, up to and including total loss. All figures are stated with their respective as-of dates and may have changed since publication. The author holds no position in CorVel Corporation at the time of publication.
Our Bottom Line at a Glance
- Business model & earning power positive
- Three consecutive record years: revenue rose from $795.3 million through $895.6 million to $958.5 million across fiscal 2024 to 2026, and net income from $76.3 million through $95.2 million to $110.3 million. The net margin climbed from 9.6 to 11.5 percent because the higher-margin bill review business grew faster (up 15 percent to $362 million in fiscal 2026) than case management (up 3 percent to $596 million). No customer accounted for 10 percent or more of revenue.
- Balance sheet & cash flow positive
- As of March 31, 2026 the balance sheet carries $394.23 million of equity (a 61.3 percent ratio) and $233.07 million of cash with no financial debt whatsoever; the only long-term liability is $20.69 million of lease obligations. Operating cash flow rose to $155.64 million, leaving roughly $110.3 million free after $45.36 million of capital expenditure — effectively identical to reported net income.
- Capital allocation neutral
- Fiscal 2026 saw $56.21 million spent on 782,744 of the company's own shares at an average of $71.81. Because 332,497 shares were simultaneously created through options, the employee plan and one asset acquisition, the share count fell only from 51,359,544 to 50,909,297 — a net 0.88 percent. In effect every share that genuinely disappeared cost roughly $125. Over 30 years the programme adds up to 115,259,435 shares for $888 million.
- Ownership & governance negative
- The proxy statement of June 26, 2026 shows Jeffrey J. Michael holding 37.99 percent as of March 31, 2026, mostly through Corstar Holdings, Inc.; all ten officers and directors together hold 39.72 percent. The same document lists him as an independent director, as chair of the nomination and governance committee and as a member of the compensation committee; each of those committees met once during fiscal 2026. The free float is correspondingly tight and no analyst consensus exists.
- Leadership transition neutral
- Sarah Scott (49, with the company since 1999) took over as chief executive on July 1, 2026 from Michael G. Combs, who became executive chair at $25,000 a month (Form 8-K of June 1, 2026). The annual report filed ten days earlier still names Combs as chief executive in its risk factors. The succession is internal; the first quarter under new leadership ended June 30, 2026 and had not been reported as of July 26, 2026.
- Valuation & market picture neutral
- A market capitalisation of roughly $3.0 billion (50,691,185 shares at a closing price of $59.86 on July 24, 2026) equates to roughly 28 times diluted earnings of $2.14 per share and 7.8 times book value — demanding against 7 percent revenue growth, defensible against a 30.8 percent return on equity. For context: the stock closed at $77.42 on September 30, 2025 per the annual report cover page, and the company itself repurchased at an average of $71.81 during fiscal 2026. Insiders sold seven times in twelve months and bought not once.
CorVel appears in a turnaround scanner but is not a restructuring case: the year ended March 31, 2026 was the best in company history with $958.5 million of revenue, $110.3 million of net income and $155.6 million of operating cash flow, on a balance sheet carrying 61.3 percent equity and no financial debt. What fell is the price, not the business — and that makes the decision harder, not easier, because there is no repair to bet on. Three points remain uncomfortable: a $56.2 million buyback that cut the share count by only 0.88 percent, a shareholder holding 37.99 percent who also chairs the nominating committee, and insiders who sold seven times in twelve months and bought not once. Not investment advice.
What Our Rating Means
Quality confirmed
Business model, numbers and balance sheet hold up to our review. Whether the current price supports an entry is a separate question — it hangs on the price, not on the company.
The quality of this business is documented and not in dispute: revenue has grown for three years, the margin has improved under its own power from 9.6 to 11.5 percent, the profit is backed by cash ($155.6 million of operating cash flow against $110.3 million of reported net income), the balance sheet carries no financial debt and 61.3 percent equity, and no customer accounts for 10 percent of revenue. What we criticise are not questions of substance but of capital allocation and power: a buyback that retires a net 0.88 percent of the shares, and a 37.99 percent shareholder who also decides who is nominated to the board. The price, at roughly 28 times earnings, is no bargain either — but price does not set this rating. The decision is yours.
A journalistic assessment by our editorial team at the time of the deep dive, based on public sources — not investment advice and not a solicitation to buy or sell. Your personal circumstances (investment goals, risk capacity, taxes) cannot be taken into account. What our levels mean, how verdicts are formed, and what conflicts of interest exist →
Worth Noting
- CorVel reached our research list through our in-house stock scanner "Turnaround Candidates": rank 15 of 62 U.S. hits, turnaround check 7 of 8, as of July 25, 2026. These lists are recalculated daily, so the ranking is a dated snapshot. The load-bearing mandatory pillar is the requirement to trade at least 50 percent below the all-time high; if the stock rises above roughly $64, CorVel leaves this list without anything having changed in the business.
- The fiscal year ends March 31. References to "fiscal 2026" cover April 1, 2025 through March 31, 2026 (annual report filed May 22, 2026). That annual report is the most recent periodic filing; the quarterly report for the period ended June 30, 2026 had not been filed as of July 26, 2026.
- Price figures are dated valuation anchors, not buy arguments: closing price $59.86 on July 24, 2026, split-adjusted all-time high $128.46 on February 5, 2025, 52-week low $46.00 on February 9, 2026. All prices before December 26, 2024 are comparable only on a split-adjusted basis because of the three-for-one stock split.
- As of July 26, 2026 no takeover, merger or take-private process is under way: the company's SEC record contains no Form S-4, no Schedule 13E-3, no merger proxy, no Form 25 and no Form 15.
- Possible confusion: CorVel Corporation (CRVL) is not related to similarly named medical technology suppliers, and it is not Corstar Holdings, Inc. — Corstar is the major shareholder, not the operating business.
Frequently Asked Questions
CorVel manages the costs that arise in the United States after workplace injuries, auto claims and group health claims. Two revenue streams: network solutions reviews medical bills automatically against state fee schedules and runs a network of more than 1.2 million providers ($362 million in fiscal 2026). Patient management handles claims administration, case management and return-to-work services ($596 million).
Because the scanner measures the price, not distress. Mandatory pillar one requires a gap of at least 50 percent to the all-time high: CorVel closed at $59.86 on July 24, 2026 against a split-adjusted high of $128.46 set February 5, 2025 — a gap of 53.4 percent. Pillar two requires the ability to survive, which is clearly met here. If the stock rises above roughly $64, CorVel drops off the list. These lists are recalculated daily.
On March 31. Fiscal 2026 ran from April 1, 2025 through March 31, 2026 and was filed as an annual report on Form 10-K on May 22, 2026. Anyone comparing CorVel with December-year companies has to allow for that three-month shift. The first quarter of fiscal 2027 ended June 30, 2026.
The board approved a three-for-one forward stock split on December 13, 2024, together with a proportionate increase in authorised shares from 120 million to 360 million. The charter amendment was filed in Delaware on December 23, 2024 and became effective on December 24, 2024; trading on a split-adjusted basis began December 26, 2024. No shareholder vote was required. Older prices therefore have to be divided by three.
As of March 31, 2026 Jeffrey J. Michael held 19,361,079 shares, or 37.99 percent, of which 18,742,108 shares (36.81 percent) sit inside Corstar Holdings, Inc.; Corstar's sole shareholder is the Michael Family Grantor Trust. Kayne Anderson Rudnick held 9.80 percent. All ten officers and directors together held 39.72 percent. Mr. Michael has served on the board since September 1990.
Sarah Scott, 49, who joined the company in 1999, has been chief executive officer and president since July 1, 2026. Her predecessor Michael G. Combs, 34 years with the company and chief executive since January 2019, became executive chair on the same date at $25,000 a month. The annual report filed May 22, 2026 still names Combs as chief executive in its risk factors — it was filed ten days before the announcement.
Virtually none. As of March 31, 2026 total liabilities of $248.76 million stood against $394.23 million of equity, and those liabilities are almost entirely short-term accruals and payables. The only long-term item is $20.69 million of lease obligations. The annual report states that the company has had virtually no interest-bearing debt for the past 35 years.
Only slightly. In fiscal 2026 CorVel spent $56.2 million on 782,744 of its own shares at an average of $71.81. At the same time 332,497 new shares were created through options, the employee plan and one asset acquisition. Net of that, shares outstanding fell from 51,359,544 to 50,909,297 — a reduction of 450,247 shares, or 0.88 percent. In effect, every share that genuinely disappeared cost roughly $125.
Found an error?
Did you spot a factual error, an outdated number, or a typo in this deep dive? Let us know briefly — your report goes straight to the editorial team.