Regional Management's Endgame: When Cash Flow Swallows the Losses
A price-to-cash-flow ratio of 1.1 looks like a bargain — until you check what that cash flow is made of. At a consumer lender it measures the interest margin before the loans go bad. We do the arithmetic on what is actually left to distribute.
 Thomas Mücke
Founder & Publisher
Thomas Mücke
Founder & Publisher
Chart
Interactive price chart (TradingView).
Note: pure fact-based analysis, not investment advice and not a solicitation to buy or sell. All figures without guarantee.
There is one number that makes almost every investor go weak: a single-digit valuation. When a stock trades at roughly one times its cash inflow, the brain switches off and the calculator switches on — this has to be a bargain. Psychologists call it anchoring: a small number feels cheap no matter what it is built from. Regional Management Corp. (NYSE: RM) carries a price-to-cash-flow ratio of about 1.1 and sits at rank 19 of 25 visible hits in our price-to-free-cash-flow ranking (U.S. selection, as of July 27, 2026). Before the reflex takes over, let us make a deal: we read together what that cash flow is made of — the annual report (10-K) for 2025, the quarterly report (10-Q) for the period ended March 31, 2026 and the two current reports (8-K) from May 2026. Because a metric is only as good as the question it answers. And at a lender, this one answers a different question than most people assume.

What Regional Management actually does
Regional Management is based in Greer, South Carolina, has been listed on the New York Stock Exchange since March 2012 and employed roughly 2,112 people as of December 31, 2025. The business is exactly as old-fashioned as it sounds: installment loans to consumers who cannot get one from a mainstream bank. Someone who needs to pay for a car repair, a dental bill or a debt consolidation, and who has weak to mid-tier credit, walks into a branch, signs a fixed-payment loan and pays it back over months. The U.S. securities regulator, the SEC, files the company under industry code 6141 — "Personal Credit Institutions."
Two product lines carry the business. Large loans accounted for a balance of $1,591.5 million as of March 31, 2026; small loans for $512.5 million. On top of that sits credit insurance, which brought in a net $45.6 million in 2025. The money is made on the spread between what customers pay in interest and what the funding costs — less the loans that never come back. Those three figures are the entire annual report: interest income, funding cost, charge-offs.
One point matters for everything that follows. A lender is not a factory. A factory buys machines (investing) and sells products (operations). A lender makes loans — and accounting rules put that lending in investing activities, not in operations. That is not a trick, it is the rule. But it means the most familiar of all cash-flow metrics measures something completely different at this kind of business than it does at a machinery maker.
How the stock reached our desk
Anyone can reproduce it: open the price-to-free-cash-flow ranking and set the market filter to the United States. The list sorts ascending by price-to-cash-flow — cheapest relative to operating cash flow first. On July 27, 2026, Regional Management stood at rank 19 of 25 visible hits, at a ratio of about 1.1 (the metric itself carries an as-of date of July 24, 2026). The lists are recomputed daily; anyone checking later may find the name in a different place, or may have to look it up through the screener.
The neighbourhood in that list says more about the metric than about the companies: 14 of the 25 visible hits are financial or real-estate businesses (as of July 27, 2026). At ranks 13 and 14 sit Oportun Financial and Consumer Portfolio Services, two direct competitors from consumer and auto lending. That is no coincidence. It is the mechanical consequence of these business models booking their core activity outside of operations.
The rest of the scanner profile reads solidly: a Piotroski F-Score of 8 out of 9 — a balance-sheet health check made of nine yes/no questions, where 8 is a very good result; a genuinely sound company sits at 8 or 9. Price-to-earnings is around 8.3, price-to-book around 1.0, the dividend yield around 2.9 percent (all fundamental data, as of July 24, 2026). The Altman Z figure reads 9.68 — more on that shortly, because it belongs to the metrics you must not use here.
The numbers over the years — credit where it is due
Start with what genuinely impresses. In three years Regional Management turned a lean year into a solid earnings record. Total revenue rose from $551.4 million in 2023 to $588.5 million in 2024 and $645.6 million in 2025. Net income climbed over the same period from $16.0 million to $41.2 million and then $44.4 million — close to a tripling. The first quarter of 2026 continued the trend: $11.4 million against $7.0 million a year earlier, or $1.18 per diluted share against $0.70.
What stands out alongside it is cost discipline. General and administrative expenses fell 2.1 percent to $64.7 million in the first quarter of 2026, even though ten new branches had opened since the year-earlier quarter. The operating expense ratio improved from 14.0 to 12.2 percent. The loan book grew at the same time from $1,890.4 million to $2,104.0 million. A company that can grow while cutting costs is doing something right operationally. That is not a footnote, and it belongs up front, before the uncomfortable parts.
Uncomfortable truth No. 1: the cash inflow contains losses that have not been paid yet
Now the core question. Operating cash flow in 2025 was $309.1 million. Against a market capitalization of about $392 million that produces the 1.1 that puts the name in the ranking. But how does a company earning $44.4 million produce $309.1 million of cash inflow?
The answer is in the statement of cash flows, on the second line. The credit provision is added back to net income — $245.4 million of it in 2025. That is entirely correct accounting: in the first step, the provision is a bookkeeping entry and no money leaves the building. It is the reserve for loans the company expects to go bad.
Except those loans really do go bad. In that same year, 2025, $239.2 million of loans were charged off; $15.1 million came back as recoveries on previously written-off balances. That leaves $224.0 million of real losses — money handed to customers and never repaid. So the $309.1 million inflow is not an amount the company can dispose of freely. It is the amount before the largest cost item in the business.
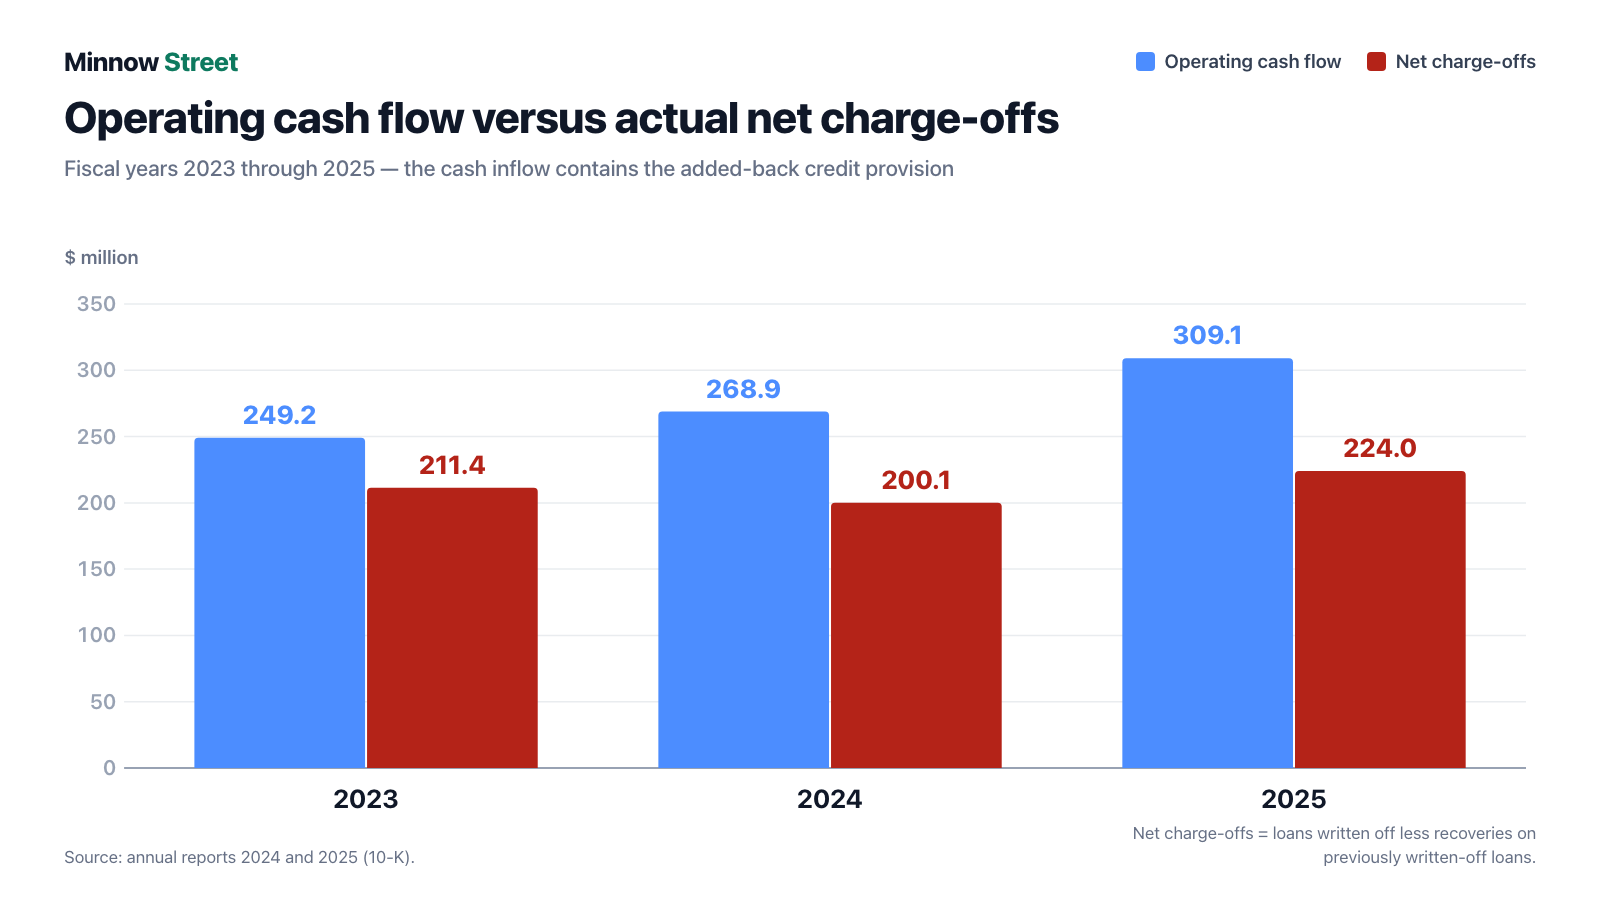
Subtract the real net charge-offs from operating cash flow and the three years leave $37.8 million (2023), $68.8 million (2024) and $85.0 million (2025). That is still a respectable figure — but it is not $309.1 million, and measured against it the stock trades at roughly 4.6 times, not 1.1. In the first quarter of 2026 the gap was tighter still: $81.0 million of inflow against $66.3 million of net charge-offs, leaving $14.7 million.

Uncomfortable truth No. 2: operations plus investing came to a deficit in 2025
There is a second line the metric never sees. A lender grows by making new loans. And that lending sits — by rule, as noted — in investing activities. In 2025 Regional Management originated $1,968.3 million of loans and received $1,516.3 million back. A net $452.0 million therefore flowed into the loan book.
Add operations and investing together — which is how a lender honestly has to be viewed — and fiscal 2025 produces a deficit of $162.1 million. Not because the business is doing badly, but because growth at a lender costs money before it makes money. The gap was closed by the financing side, which brought in a net $124.5 million, mostly through securitizations and credit facilities.
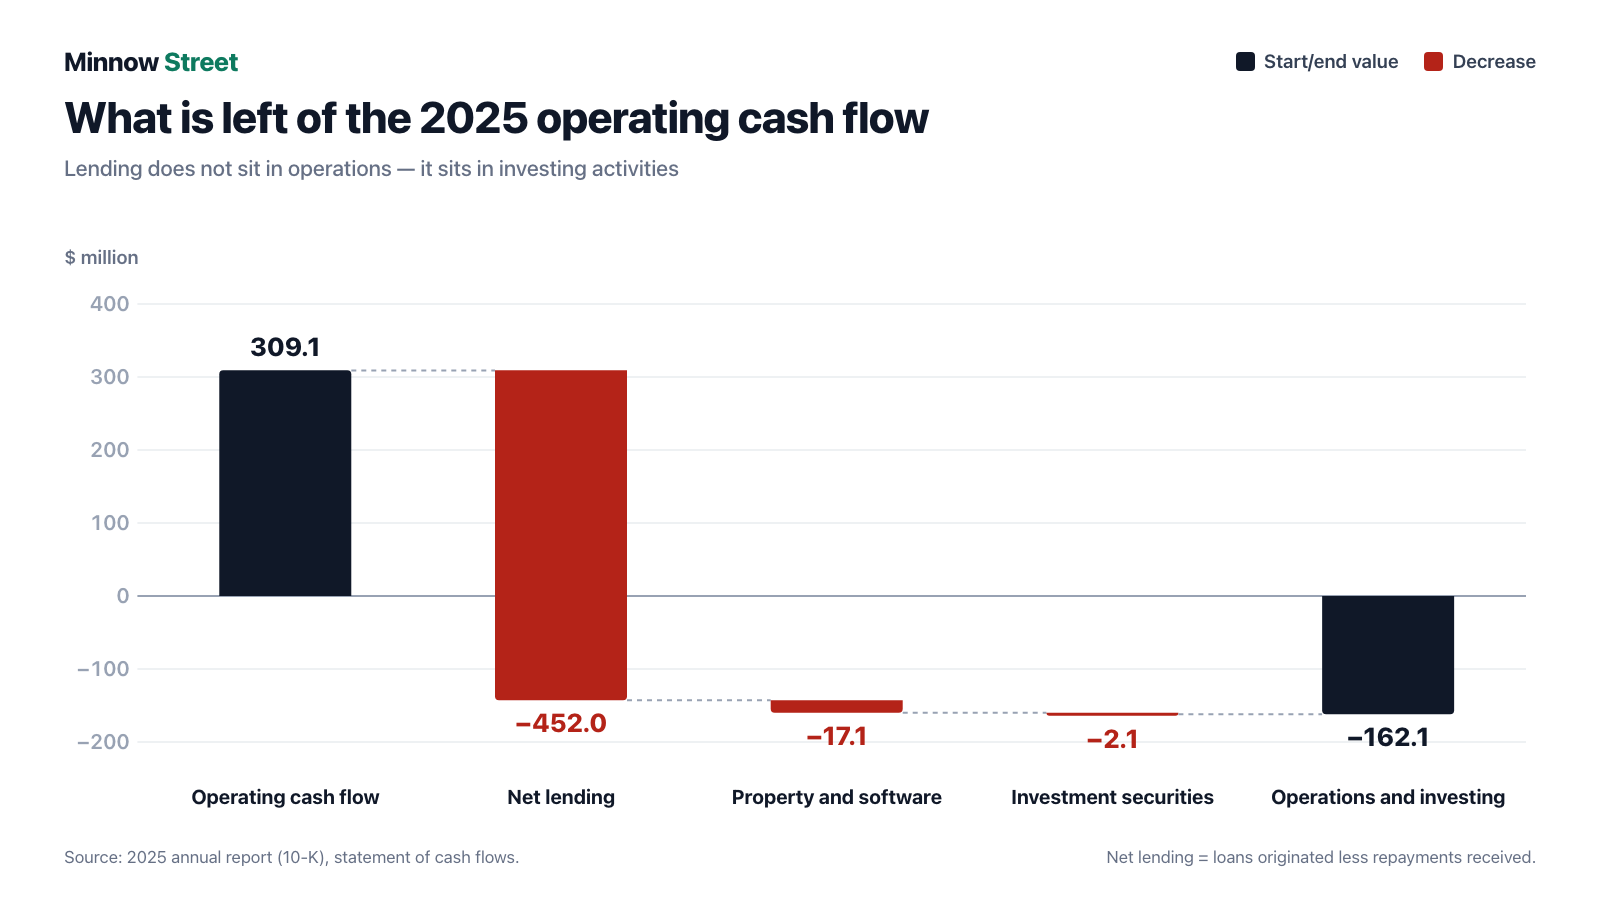
For comparison: at OneMain Holdings, the far larger competitor, the same arithmetic produces the same result. This is not a Regional Management quirk, it is the design of the industry. And it is exactly why comparing price-to-cash-flow between a lender and a software house is as useful as comparing the odometers of a car and a bicycle.
Uncomfortable truth No. 3: a quarter of the loan book is shrinking and deteriorating at once
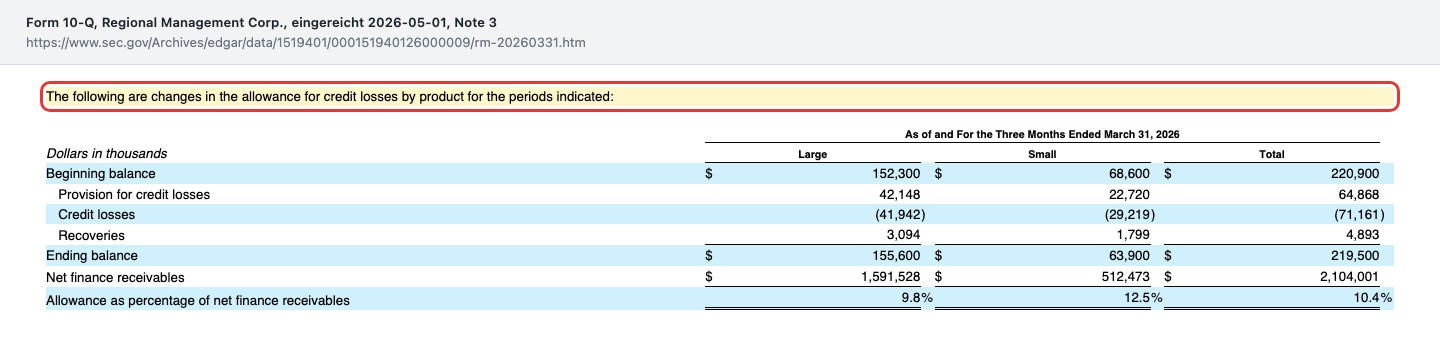
As of March 31, 2026, the allowance for credit losses stood at $219.5 million, or 10.4 percent of net finance receivables. A year earlier it was 10.5 percent — so reserves are being carried rather than quietly released, which is a common way to flatter a quarterly result. That is a point in the company's favour.
Delinquency needs a finer look. In total, 7.2 percent of net finance receivables were at least thirty days past due on March 31, 2026, against 7.1 percent a year earlier — effectively flat. Underneath that calm surface the two product lines diverge: on large loans delinquency rose from 5.9 to 6.0 percent, on small loans from 10.0 to 10.9 percent.
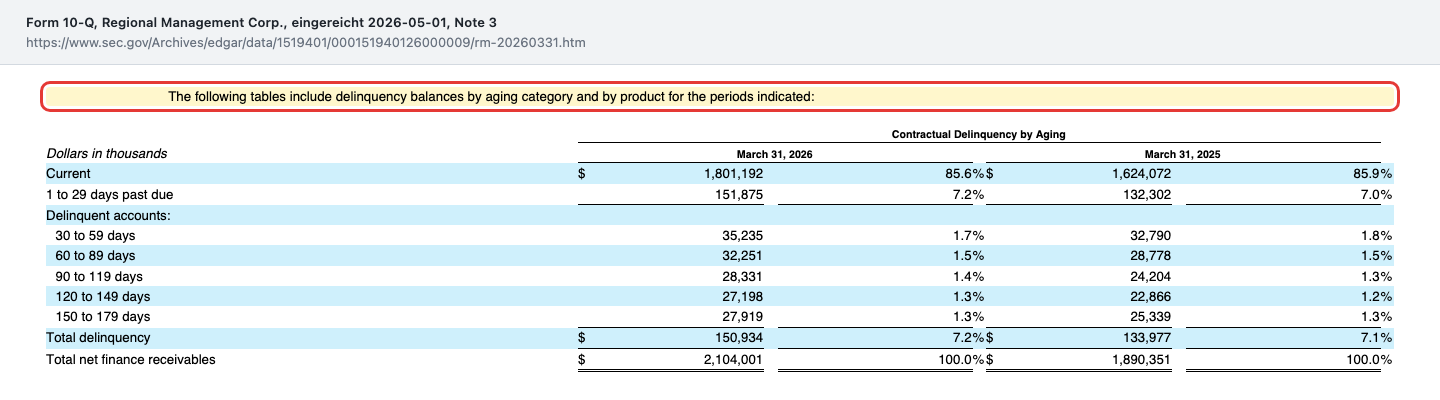
The striking part: the small-loan balance shrank over the same period, from $544.5 million to $512.5 million, a decline of 5.9 percent. Shrinking normally lowers a delinquency rate — here it rose. The allowance rate on that portfolio also moved up, from 11.9 to 12.5 percent. So a quarter of the loan book is getting smaller and weaker at once. In the headline 7.2 percent that effect disappears behind the larger, growing large-loan book.
Uncomfortable truth No. 4: interest coverage is thin — and the Altman score does not help here
A word about a metric you should not use on this name. Our data set carries an Altman Z figure of 9.68 for Regional Management. That is the so-called Z double-prime variant, whose cut-offs sit at 1.1 (distress zone) and 2.6 (safe zone) — not the classic formula with 1.8 and 3.0. On that scale the company would look outstanding.
But the formula was built for manufacturers and retailers. It relates current assets, retained earnings and operating income to total assets, assuming that current assets are things you can quickly turn into cash. At a lender the current assets are the loan book — which is precisely the risk you set out to measure. The number measures itself. Anyone assessing Regional Management's credit standing has to read other lines:
- Equity ratio of 18.1 percent — $375.8 million of equity against total assets of $2,072.8 million (March 31, 2026). Respectable for a consumer lender; it means roughly every sixth dollar on the balance sheet belongs to shareholders.
- Allowance rate of 10.4 percent — the company itself expects that a little more than one in ten dollars lent will not come back. That is not a catastrophe, it is the price tag of this business model: lend to weak credit and you charge accordingly high rates.
- Leverage of 4.3 times — $1,621.4 million of debt against $375.8 million of equity. Standard for the industry, but any deterioration in losses hits equity with that leverage attached.
- Interest coverage of 1.68 times (2025) — the thinnest figure in the set. Pre-tax income plus interest expense covered interest expense by only two thirds more than required; in the first quarter of 2026 it was 1.65 times. Cost of funds rose from 4.2 to 4.3 percent at the same time.
The company itself names what the business hangs on, in its annual report:
"The financial services industry is undergoing rapid technological changes, with frequent introductions of new technology-driven products, services, and marketing channels, including the use of AI and machine-learning solutions to interact with customers, sell products and services, and support and grow a customer base."
— Regional Management Corp., SEC annual report 10-K for 2025, Item 1A Risk Factors
For a house whose distribution rests on a branch network, that sentence is more than boilerplate. It describes competition from online lenders who carry no leases and no branch staff. Regional Management answers with proximity and its own origination system, in which, according to the quarterly report, it has been investing further — other expenses rose by $0.8 million partly because of a new front-end branch origination platform.
What has happened since the last quarterly report
Two current reports have been filed since, neither explosive but both worth noting. On April 28, 2026 the senior revolving credit facility (agent: Bank of Montreal) and the warehouse facility of the subsidiary RMR IV (agent: Wells Fargo) were amended. The change to the revolving facility explicitly concerns pledging receivables originated through a bank partner — the glossary of the quarterly report identifies that partner as Column National Association. It suggests part of the origination will run through a partner bank in future, a model widely used in the industry.
On May 13, 2026 the compensation committee approved equity awards to the named executive officers — performance restricted stock units and restricted stock from the 2024 long-term incentive plan — and new plan shares were registered shortly afterwards. At a company with only about 9.2 million shares outstanding, paying in stock is a dilution question even when the amounts look small: share-based compensation ran to $11.9 million in 2025.
Valuation: cheap, but not for the reason the list gives
Set the orders of magnitude. At a market capitalization of about $392 million (as of July 24, 2026) and net income of $44.4 million (2025), price-to-earnings sits at roughly 8 to 9 times. Book equity was $375.8 million on March 31, 2026 — so the stock costs about one times book. For a lender earning a return on equity of around 13 percent, that is neither expensive nor obviously too cheap: a business that durably earns more than its cost of equity usually trades above book, one carrying elevated loss risk below it.
The analyst consensus most recently pointed to a price target of about $48 (fundamental data, as of July 24, 2026). Such targets are the view of the professionals, not the truth — they rest on models with the same unknowns this article cannot resolve either: how do losses behave if weak-credit U.S. consumers come under pressure, and how expensive does funding get?
The honest valuation sentence reads: Regional Management may well be cheap — but not because price-to-cash-flow is 1.1. At most because a profitable, growing company with an 18.1 percent equity ratio is available at book value. Those are two entirely different arguments, and only the second survives scrutiny.
Opportunities and risks at a glance
What speaks for the stock:
- Revenue and earnings have grown for three consecutive years: revenue of $551.4 million, $588.5 million and $645.6 million; net income of $16.0 million, $41.2 million and $44.4 million (2023 through 2025).
- Costs are falling as the business grows — general and administrative expenses down 2.1 percent in the first quarter of 2026, the operating expense ratio from 14.0 to 12.2 percent, despite ten new branches.
- Reserves are carried rather than released: a 10.4 percent allowance against 10.5 percent a year earlier.
- Valuation at roughly book value on a return on equity of about 13 percent, plus a dividend yield of about 2.9 percent and ongoing buybacks (as of July 24, 2026).
- A clean filing status: no Form 15, no Form 25, no tender-offer statement, and a complete, current reporting trail through the quarter ended March 31, 2026.
What speaks against it:
- The metric that puts the name in the ranking does not measure what it appears to measure — net of real charge-offs, $309.1 million becomes $85.0 million.
- Operations and investing combined produced minus $162.1 million in 2025; growth is carried by the financing side.
- Thin interest coverage of 1.68 times (2025) on leverage of 4.3 times equity, with funding costs rising from 4.2 to 4.3 percent.
- Small loans are deteriorating: delinquency from 10.0 to 10.9 percent, the allowance rate from 11.9 to 12.5 percent, on a balance down 5.9 percent.
- The business depends on the ability of weak-credit consumers to pay. A worsening employment picture hits this model first, and — because of the leverage — particularly hard.
- Limited tradability: with about 9.2 million shares and daily turnover in the order of $2 million, the stock is thin; entering and exiting moves the price.
A human conclusion
We started with anchoring: a small number that feels cheap. We looked at what it is built from, and found something that has nothing to do with Regional Management and everything to do with us. We trust metrics because they shorten the thinking. That is exactly what they are for — as long as we know which question they answer.
Price-to-cash-flow answers the question: how much am I paying for the money that comes out of ongoing operations? At a machinery maker that is an excellent question. At a lender, ongoing operations are the interest margin, and the actual business — lending money and hoping it comes back — sits three lines lower, in a different section. The number does not lie. It simply answers a question we never asked.
What remains is a company you can like: 2,112 employees, an unglamorous business, three years of growing profits, falling costs and reserves that are not being massaged. And beside it, four lines worth reading in every quarterly report before passing judgment: net charge-offs against cash inflow, small-loan delinquency, funding costs, interest coverage. What you make of that is your decision. And that is exactly as it should be.
Sources
- Regional Management Corp., annual report 10-K for fiscal 2025 (filed February 20, 2026, CIK 0001519401) — revenue and earnings series 2023 through 2025, statement of cash flows, allowance roll-forward, risk factors.
- Regional Management Corp., quarterly report 10-Q for the period ended March 31, 2026 (filed May 1, 2026) — balance sheet, statement of cash flows, allowance by product, delinquency by aging, cover-page share count, management discussion.
- Regional Management Corp., annual report 10-K for 2024 (filed February 21, 2025) — comparative figures.
- Current report 8-K filed May 4, 2026 — amendments to the senior revolving credit facility and the RMR IV warehouse facility.
- Current report 8-K filed May 19, 2026 — equity awards to the named executive officers, annual meeting results.
- Fundamental data & our in-house stock scanner (valuation figures as of July 24, 2026, scanner status as of July 27, 2026): rank 19 of 25 visible hits in the price-to-free-cash-flow ranking, U.S. selection.
This analysis is journalistic commentary on publicly available filings and is not investment advice. It contains no recommendation to buy or sell and is not a solicitation to buy or sell securities. Share prices can move sharply; a total loss of invested capital is possible. All figures come from the original documents linked above and carry the as-of date stated with each; no warranty is given for the accuracy of the primary sources. The author holds no position in Regional Management Corp. at the time of publication.
Our Bottom Line at a Glance
- Earning power positive
- Revenue rose from $551.4 million (2023) to $588.5 million (2024) and $645.6 million (2025); net income went from $16.0 million to $44.4 million. The first quarter of 2026 added to that, at $11.4 million against $7.0 million a year earlier. General and administrative expenses fell 2.1 percent to $64.7 million against the trend — the operating expense ratio improved from 14.0 to 12.2 percent (10-Q for the period ended March 31, 2026).
- What the screening metric actually says negative
- The price-to-cash-flow ratio of about 1.1 (as of July 24, 2026) that puts this stock in the ranking measures, at a lender, the interest margin before credit losses: the $309.1 million operating inflow for 2025 contains $245.4 million of added-back credit provision, while net lending of $452.0 million sits in investing activities. Operations and investing combined came to minus $162.1 million.
- Credit quality neutral
- The allowance stood at 10.4 percent of net finance receivables on March 31, 2026, essentially unchanged from 10.5 percent a year earlier — reserves are being carried, not released. Thirty-day-plus delinquency edged up from 7.1 to 7.2 percent, but on small loans it rose from 10.0 to 10.9 percent even though that portfolio shrank 5.9 percent.
- Balance sheet and funding neutral
- An equity ratio of 18.1 percent ($375.8 million of $2,072.8 million as of March 31, 2026) is respectable for a consumer lender, and leverage of 4.3 times equity is standard. Interest coverage is the thin spot: pre-tax income plus interest expense covered interest expense only 1.68 times in 2025 and 1.65 times in the first quarter of 2026. Cost of funds rose from 4.2 to 4.3 percent.
- Use of capital neutral
- Regional Management distributed $35.5 million in 2025 ($11.5 million of dividends, $24.0 million of buybacks) and cut the share count from 9,554 thousand to 9,338 thousand between December 31, 2025 and March 31, 2026. Growth in the same year was funded by a net $124.5 million from financing activities — payout and balance-sheet expansion run in parallel.
- Quality of the record positive
- The filing trail is complete and current: annual report 10-K for 2025 (filed February 20, 2026), quarterly report 10-Q for the period ended March 31, 2026 (filed May 1, 2026) and both current reports since (8-K filed May 4 and May 19, 2026). No Form 15, no Form 25, no tender-offer statement; the share count comes from the cover page of the latest quarterly report.
Regional Management is a profitable, growing consumer lender with a respectable equity cushion — and at the same time a case study in how a single metric can mislead. The price-to-cash-flow ratio of about 1.1 that puts the stock in the ranking measures the interest margin before credit losses here; net the $224.0 million of 2025 charge-offs and the $452.0 million of net lending against it, and operations plus investing leave a $162.1 million deficit. Anyone judging this stock has to read it as a bank: an 18.1 percent equity ratio, a 10.4 percent allowance, 7.2 percent delinquency, interest coverage of 1.68 times. Not investment advice.
What Our Rating Means
Open questions
The business works in principle, but one material question is open. As long as it stays open, our findings do not carry a quality verdict.
Yellow here does not signal doubt about survival. Regional Management is profitable, revenue has grown for three straight years, an equity ratio of 18.1 percent is respectable for a consumer lender, and reserves equal to 10.4 percent of the loan book are being carried rather than released. Yellow stands because two things are true at once. First, the business is structurally thinly cushioned: of $645.6 million of revenue in 2025, $245.4 million went to credit provision, $257.6 million to general and administrative expenses and $84.8 million to interest, leaving $44.4 million of net income — 2.3 percent of average net finance receivables. Interest coverage of 1.68 times leaves little room if funding gets more expensive or losses rise, and both moved the wrong way most recently (cost of funds from 4.2 to 4.3 percent, net charge-offs from $200.1 million to $224.0 million). Second, a quarter of the loan book is deteriorating while it shrinks: small loans at 10.9 percent delinquency against 10.0 percent, on a balance down 5.9 percent. Both are open operating questions without any threat to the going concern — which is exactly what the yellow level is for. Green is ruled out by thin interest coverage combined with a loss rate in the double-digit percentages of the book; red is ruled out because the company has reported profits for three years, is not releasing reserves, and carries no open balance-sheet, governance or auditor qualifications.
A journalistic assessment by our editorial team at the time of the deep dive, based on public sources — not investment advice and not a solicitation to buy or sell. Your personal circumstances (investment goals, risk capacity, taxes) cannot be taken into account. What our levels mean, how verdicts are formed, and what conflicts of interest exist →
Worth Noting
- RM reached the research list as rank 19 of 25 visible hits in our in-house price-to-free-cash-flow ranking (U.S. selection, as of July 27, 2026), part of the series covering the leading places in that scanner. The lists are recomputed daily; today's rank is not tomorrow's rank.
- The ranking itself is telling: 14 of the 25 visible hits are financial or real-estate businesses (as of July 27, 2026). That is not chance but the arithmetic — where the core business is booked in investing activities, operating cash flow looks optically large.
- The Altman Z figure in our data set (9.68) is the Z double-prime variant with cut-offs of 1.1 and 2.6, not the classic Z-Score with 1.8 and 3.0. The formula was never designed for lenders in any case, and this analysis therefore does not use it as a credit argument.
- Market capitalization (about $392 million) and valuation figures carry an as-of date of July 24, 2026 and were checked against the 9,208,145 shares on the cover page of the quarterly report for the period ended March 31, 2026 (as of April 29, 2026). Analyses are evergreen; daily prices are not a reason to buy.
Frequently Asked Questions
Because a price-to-cash-flow ratio of about 1.1 (as of July 24, 2026) measures market capitalization against operating cash flow. At a lender, that inflow contains the added-back credit provision — in 2025, $245.4 million of $309.1 million. The actual lending sits in investing activities and never enters the ratio at all.
In fiscal 2025, $645.6 million of revenue left $44.4 million of net income, or 2.3 percent of average net finance receivables. In between sit $245.4 million of credit provision, $257.6 million of general and administrative expenses and $84.8 million of interest expense. In the first quarter of 2026 net income was $11.4 million against $7.0 million a year earlier.
As of March 31, 2026, $375.8 million of equity stood against total assets of $2,072.8 million, an equity ratio of 18.1 percent. Debt of $1,621.4 million equals 4.3 times equity. For a consumer lender that is standard but not comfortable: interest coverage in 2025 came to 1.68 times.
The figure in our data set is the Z double-prime variant, whose cut-offs are 1.1 and 2.6 — Regional Management sits at 9.68. But the formula was built for manufacturers and retailers and works with current assets against total assets. At a lender the loan book is the current assets, so the number loses its meaning. The telling figures here are the equity ratio, the allowance rate, delinquency and interest coverage.
In fiscal 2025, $239.2 million of loans were charged off and $15.1 million came back as recoveries on previously written-off balances, leaving $224.0 million of net charge-offs. As of March 31, 2026, the allowance stood at 10.4 percent of net finance receivables and 30-day-plus delinquency at 7.2 percent.
Yes. Fiscal 2025 saw $11.5 million in dividends plus $24.0 million of share repurchases. The dividend yield was about 2.9 percent (as of July 24, 2026). Operations and investing combined, however, produced minus $162.1 million in the same year — so the payout was carried in part by the financing side.
Two current reports on Form 8-K. On April 28, 2026 the senior revolving credit facility and the RMR IV warehouse facility were amended; the change covers, among other things, pledging receivables originated through a bank partner. On May 13, 2026 the compensation committee approved equity awards to the named executive officers, followed shortly by a registration of new plan shares on Form S-8.
Yes, but unevenly. Net finance receivables rose from $1,890.4 million (March 31, 2025) to $2,104.0 million (March 31, 2026). All of that growth came from large loans, which went from $1,345.8 million to $1,591.5 million, while small loans shrank from $544.5 million to $512.5 million — with a rising delinquency rate at the same time.
Found an error?
Did you spot a factual error, an outdated number, or a typo in this deep dive? Let us know briefly — your report goes straight to the editorial team.