CPSS Stock: On Paper, More Free Cash Flow Than Market Cap — In the Bank, $6.9 Million
Consumer Portfolio Services buys auto loans made to people banks turn away, and it ranks near the top of our FCF/market-cap scanner: reported operating cash flow over the last four quarters exceeds the entire market value of the company (data as of July 8, 2026). Anyone who doesn't want to buy that has not understood the game — or has read the balance sheet. We worked through the annual reports (10-K) for 2024 and 2025 and the quarterly report (10-Q) as of March 31, 2026: $3.7 billion of debt on $314 million of equity, $6.9 million of unrestricted cash, 7.8 percent net charge-offs — and a business model in which the scanner's dream metric systematically measures the wrong thing. Not investment advice — just an arithmetic lesson on when a dream metric is simply the wrong lens.
 Thomas Mücke
Founder & Publisher
Thomas Mücke
Founder & Publisher
Chart
Interactive price chart (TradingView).
Note: pure fact-based analysis, not investment advice and not a solicitation to buy or sell. All figures without guarantee.
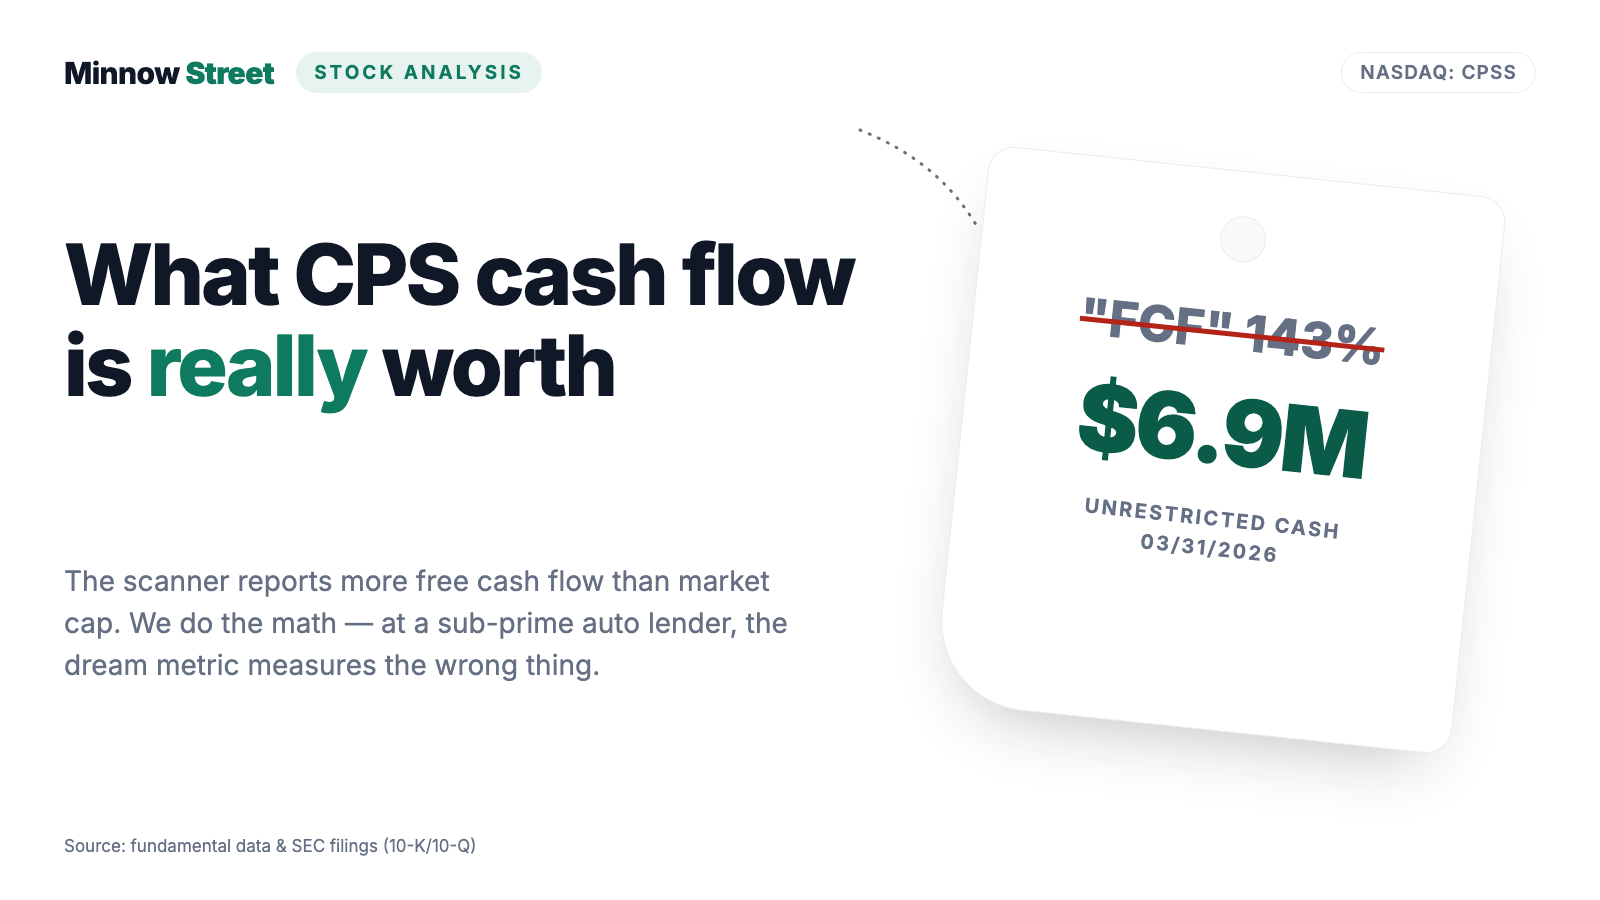
There is an investor trap that catches the diligent ones in particular: the dream-metric trap. It works like this: you sit in front of a stock screener, and suddenly a number lights up that looks too good to be true — a company whose free cash flow over the last twelve months is higher than its entire market capitalization. Your brain translates instantly: "It earns itself back in a year and a half, and nobody has noticed!" From that moment on you are no longer looking for reasons — you are looking for confirmation. That is exactly the number our in-house stock scanner shows for Consumer Portfolio Services (Nasdaq: CPSS): roughly $298 million of operating cash flow over four quarters against a market cap of about $210 million (data as of July 8, 2026) — rank 14 in our FCF/market-cap ranking (as of July 18, 2026). So let's make a deal: before you book the dream metric as a bargain, we read together what the company itself reported, under penalty of law, to the U.S. securities regulator, the SEC — the annual reports (10-K) for 2024 and 2025 and the quarterly report (10-Q) as of March 31, 2026. And in this case, they tell a story in which the same company is a cash-flow machine and a business with $6.9 million of unrestricted cash. In the end, you decide for yourself.
What Consumer Portfolio Services actually does
CPS is a specialty finance company — translated: a car lender for people a normal bank turns away. When a U.S. car dealer wants to sell a vehicle to a customer with weak or damaged credit, it submits the credit application to financiers like CPS. CPS buys the installment contract from the dealer, collects the monthly payments — at interest rates far above what a prime borrower would pay — and carries the default risk in return. The industry calls this sub-prime auto finance: "sub-prime" simply means below top-tier credit. Since its founding in 1991, CPS has purchased roughly $24.7 billion of auto loans this way; as of December 31, 2025, the managed portfolio stood at $3.9 billion — 212,718 loans in its own book, 90 percent of them for used cars. In December 2025 alone, applications arrived from 7,700 dealers in 47 states; no single dealer accounted for even 1.5 percent of the contracts purchased in 2025. The money for those purchases is naturally not sitting in CPS's checking account — it comes from the capital markets, via an assembly line called securitization: every quarter CPS bundles thousands of loans into a pool, sells it to a special-purpose subsidiary, and that entity issues asset-backed securities to institutional investors. CPS has executed 107 such term securitizations totaling about $22.4 billion since 1994, 19 of them still active; the gap until the next deal is bridged by three "warehouse" credit lines totaling $702.5 million. Management is remarkably constant: CEO Charles E. Bradley, Jr. has held the job since January 1992 — 34 years. Which brings us to the central tension of this analysis, and it runs through every chapter: the loan book keeps growing and produces impressive operating cash flow on paper — but that money is not "free"; it is the throughput of a machine that permanently needs fresh debt, and the profit left at the end has shrunk by three quarters in three years. What a sub-prime loan book with a very different business model looks like is something we dissected at the installment lender Affirm — and why credit quality trumps everything even at a community bank, in our look at Byline Bancorp.
Where the stock shows up in our scanner — and why caution applies right here
Every day we run about 3,500 stocks through our scanners. As of the July 8, 2026 data cut-off, CPSS delivered 8 hits: the trend side with a Stan Weinstein stage-2 uptrend, price above the 50- and 200-day lines, a 21-day EMA trend and Power Trend — backed by plus 25 percent over three months — plus the cheap side: the price-to-sales, price-to-cash-flow and, above all, the FCF/market-cap ranking, where CPSS stood at roughly 143 percent, rank 14 (as of July 18, 2026). To replicate it yourself: open the CPSS stock page or browse the FCF/market-cap scanner. The fundamental lens of the same scanner already urges caution: a grade of C, a Piotroski F-score of 7 of 9 (a nine-point test of the direction of the books — 7 is decent), but an EPS rating of only 69 and relative strength of 53 — middling. And now the sentence that makes this chapter more important than any hit: for a lender, the metric "free cash flow divided by market cap" systematically measures the wrong thing. The reason: "free cash flow" is conventionally operating cash flow minus capital expenditures. For a software company or a machine builder, that works. For a lender, however, the real "investment" — buying new loans, $1.64 billion at CPS in 2025 alone — is booked under investing cash flow and never appears in "free cash flow" at all. What remains in operating cash flow is the interest and fee stream of a $3.7 billion book — a big number that would dry up immediately without the constantly renewed debt behind it. Remember the image: a lender's operating cash flow is the jet of water from the tap — the metric never mentions that someone has to refill the tank around the clock. Which is exactly why we now do the math.
The numbers over the years — honestly appraised
First, what genuinely impresses. CPS has grown reliably for years: the managed portfolio rose from $2.25 billion (end of 2021) to $3.9 billion (end of 2025) — plus 73 percent in four years. Revenue climbed from $329.7 million (2022) through $352.0 million and $393.5 million to $434.5 million in 2025 (+10.4 percent), and the first quarter of 2026 added $112.3 million (+5.1 percent). The interest spread is intact: the portfolio yielded an average of 11.4 percent in 2025 while the securitization debt cost an average of 6.3 percent — a net interest margin of 5.2 percent. And: CPS has posted a profit in fourteen consecutive fiscal years (2012 through 2025) — for a sub-prime lender in an industry that claims victims in every recession, that is a genuine achievement. The latest quarter is encouraging too: net income rose 18 percent to $5.5 million in the first quarter of 2026, diluted earnings per share rose 26 percent to $0.24, and the January securitization of $345.6 million and the April deal of $514.1 million (weighted average rate: 5.51 percent — the cheapest in years) went through smoothly. So much for the sunny side:
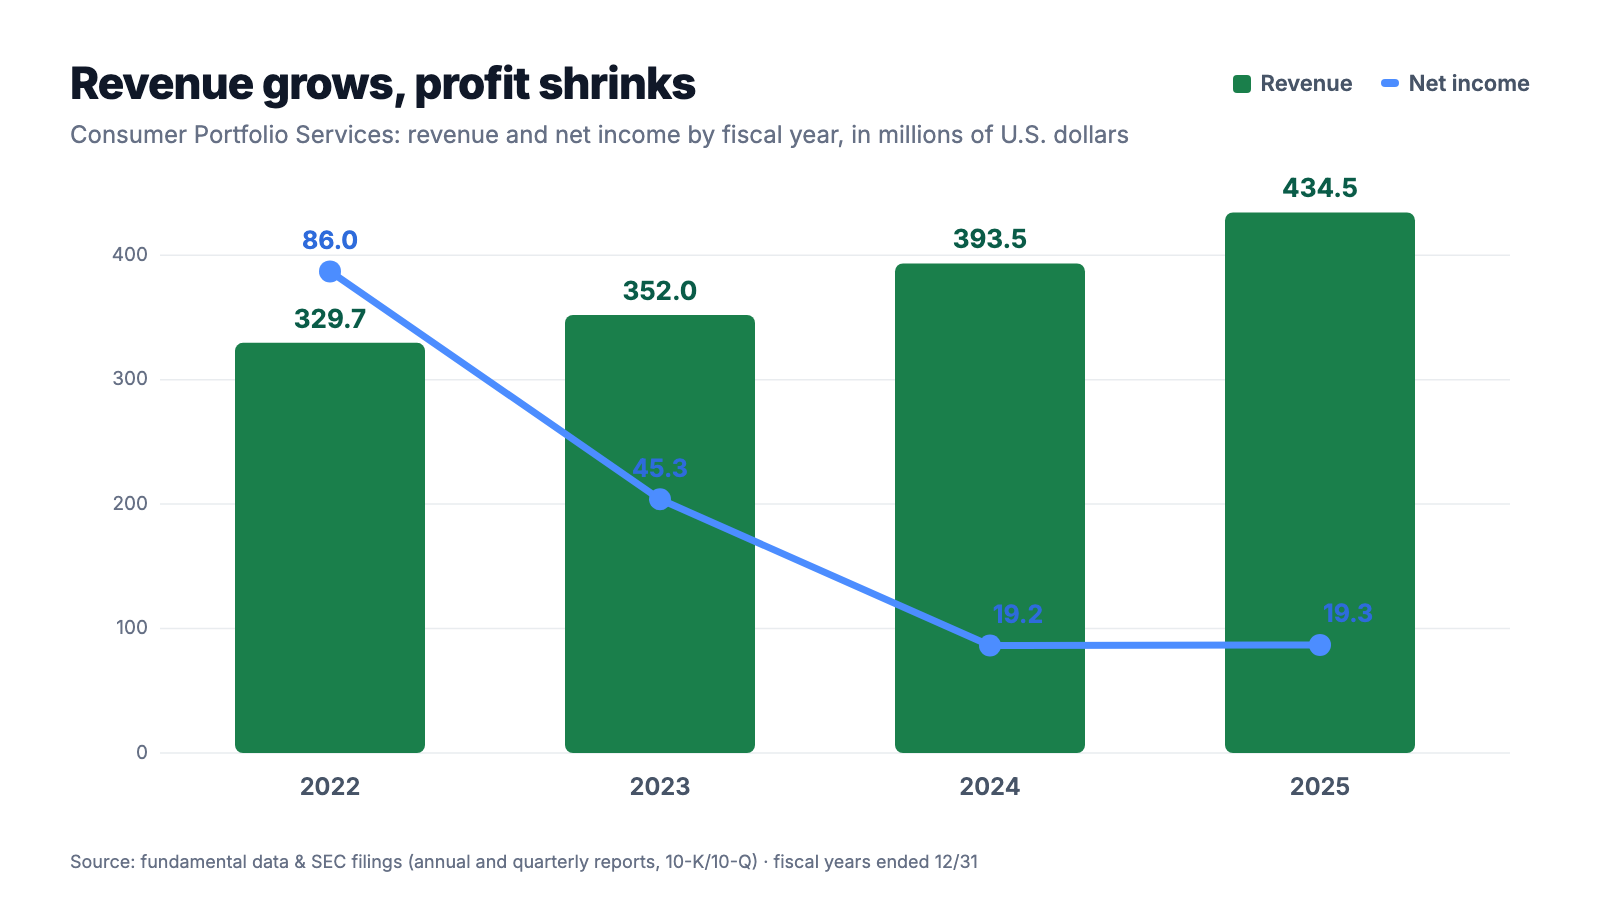
Because now comes the other axis: while revenue grew 32 percent, net income fell from $86.0 million (2022) to $19.3 million (2025) — diluted earnings per share from $3.23 to $0.80. The culprit is right there in the income statement: interest expense rose from $87.5 million (2022) to $232.0 million (2025) and now consumes 53 cents of every revenue dollar. CPS had to refinance loans made in the zero-rate era at high-rate-era prices — the October 2022 securitization cost 8.48 percent, against 2.54 percent in January of the same year. The good news: rates have been falling again since 2024 (most recently 5.51 percent in April 2026), which already helped the first quarter. The second chart shows why the scanner's dream metric is an illusion regardless:
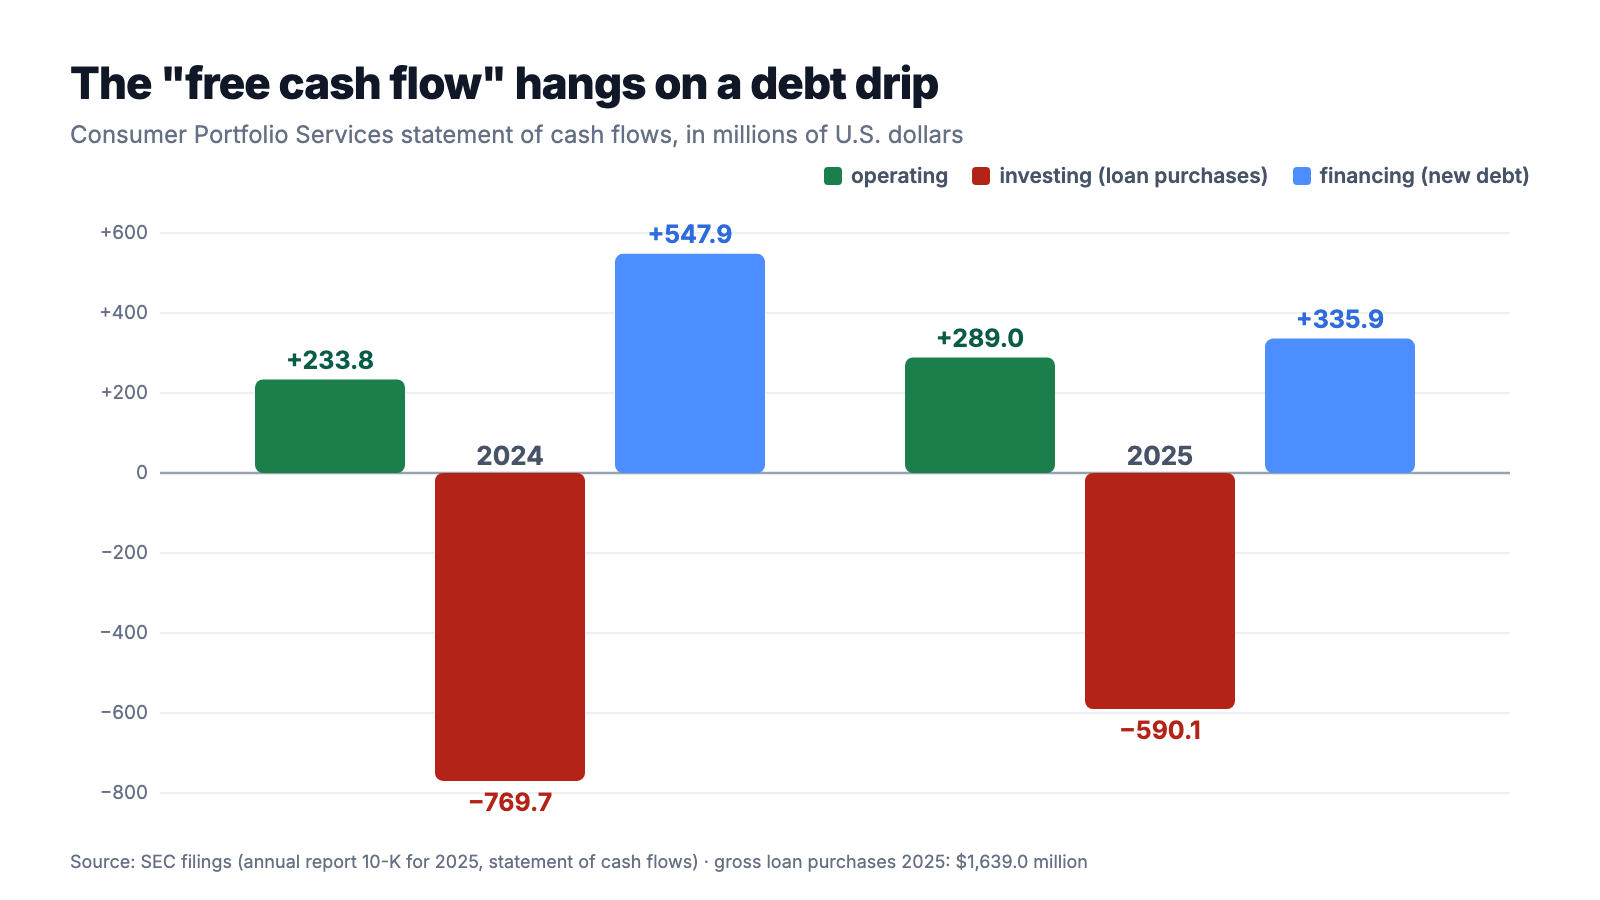
Remember the pattern: when a lender's operating cash flow shines, it has said nothing yet about value or safety — it only describes how big the wheel is that is spinning. Which brings us to the uncomfortable truths.
What the filings say — the uncomfortable truths
Uncomfortable truth no. 1: The dream metric measures throughput, not profit — the scanner hit dissolves when you do the math
Let's start with the number that lured you here. CPS's operating cash flow is real and stated plainly in the annual report:
"Net cash provided by operating activities for the years ended December 31, 2025, and 2024 was $289.0 million and $233.8 million, respectively."
— Consumer Portfolio Services, Inc., SEC annual report 10-K for fiscal year 2025, Item 7 "Liquidity and Capital Resources"
$289 million against a $210 million market cap — on paper, the company buys itself back in under a year. But directly below stands the sentence that flips the calculation:
"Net cash used in investing activities for the year ended December 31, 2025, and 2024 was $590.1 million, and $769.7 million, respectively. Cash used in investing activities generally relates to purchases of automobile contracts."
— Consumer Portfolio Services, Inc., SEC annual report 10-K for fiscal year 2025, Item 7 "Liquidity and Capital Resources"
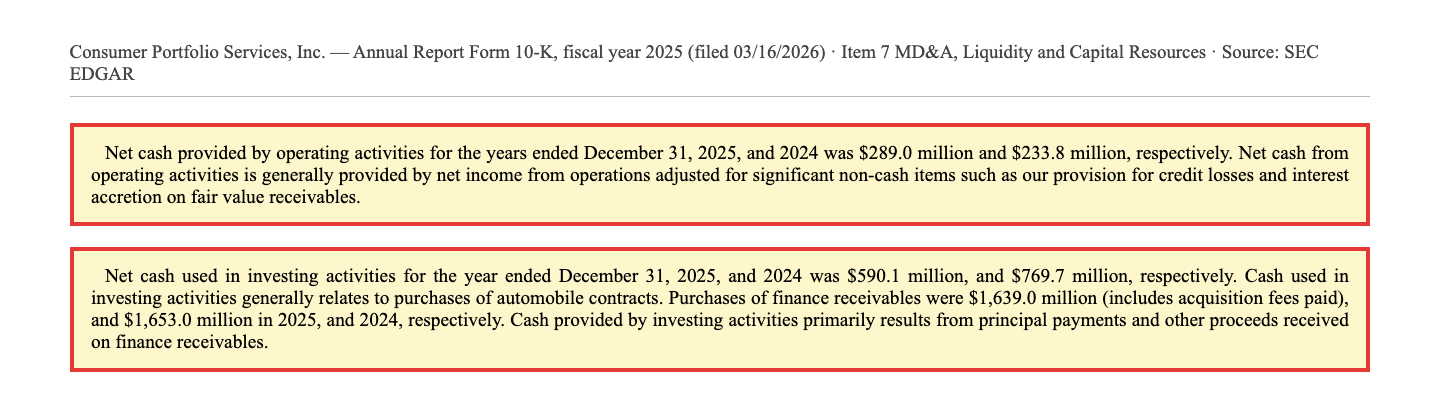
Add it up: $289 million came in from operations, $590 million flowed net into new loans, and the roughly $300 million gap was plugged by financing cash flow — $1,665 million of new securitization debt against $1,272 million of repayments, plus $65 million of fresh residual financing. This is not an accusation against CPS: that is exactly how a growing lender works, and the company discloses everything. The accusation goes to the metric: it treats loan purchases — the equivalent of a retailer's inventory purchases — as an "investment" and calculates them out of "free" cash flow. If CPS stopped buying new loans tomorrow, operating cash flow would stay high for a few years while the book melts away — and then hit zero. A screener that reports FCF/market cap for banks and loan-book companies is not flagging bargains; it is flagging business models the formula was never built for. The more honest yardsticks here: earnings, book value, credit quality. So let's continue.
Uncomfortable truth no. 2: $3.7 billion of debt, $6.9 million of unrestricted cash — and an assembly line that must not stop
How thin the cushion behind the big wheel really is, the quarterly report says in a single sentence:
"As of March 31, 2026, we had unrestricted cash of $6.9 million and $178.5 million aggregate available borrowings under our three warehouse credit facilities (assuming the availability of sufficient eligible collateral). As of March 31, 2026, we had approximately $5.3 million of such eligible collateral."
— Consumer Portfolio Services, Inc., SEC quarterly report 10-Q as of March 31, 2026, Item 2 "Liquidity and Capital Resources"
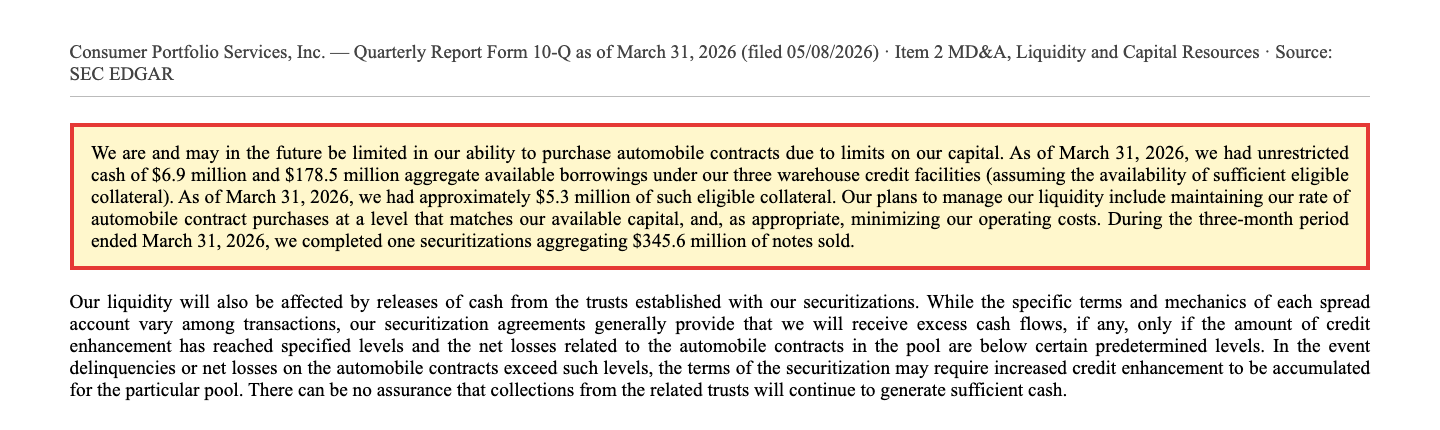
On the other side of the balance sheet, as of the same date, stand $3.67 billion of debt: $2,992 million of securitization notes, $467 million of warehouse lines, $181 million of residual interest financing, $28 million of subordinated notes — against $314 million of equity, nearly twelve times leverage. The annual report names the dependency itself, under the heading "Substantial Indebtedness": "We currently have and will continue to have a substantial amount of outstanding indebtedness" (10-K 2025). Two points in fairness. First: the lion's share is non-recourse to the parent — if a loan pool fails, the pledged loans of that specific trust absorb the hit first, not CPS as a whole. Second: the $166 million to $178 million of "restricted cash" sits as collateral inside the securitization trusts — money that belongs to CPS but is only released when the pools perform. And that is exactly where the catch sits: if credit performance deteriorates, the trusts hold on to the cash instead of releasing it — the 10-K explicitly calls those releases "a material portion of the cash that we use to fund our operations". And the assembly line has no pause button: four securitizations a year are the plan; from 2008 through 2010 and in April 2020 that market was temporarily shut — periods in which CPS had to throttle loan purchases "at times to merely nominal levels" (10-K 2025). A business model that depends on open capital markets every 90 days, running on $6.9 million of unrestricted cash — that is the price behind the dream metric.
Uncomfortable truth no. 3: 14.8 percent of the book is past due or on the tow truck — and almost half has already been deferred once
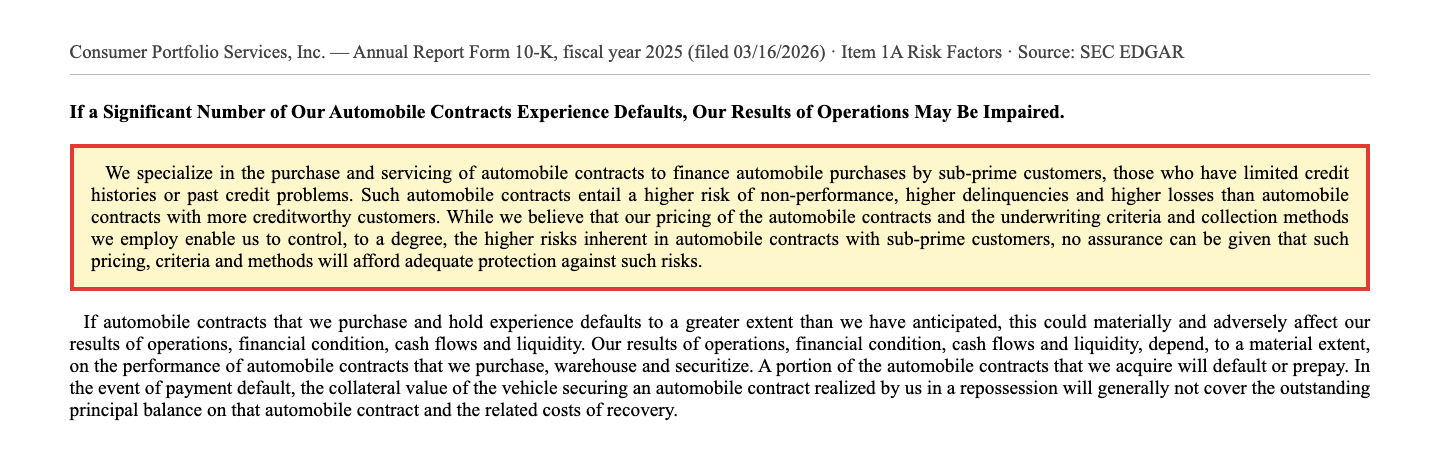
Which leaves the most important question for any lender: do the customers pay? The 10-K describes the business model itself with disarming clarity:
"We specialize in the purchase and servicing of automobile contracts to finance automobile purchases by sub-prime customers, those who have limited credit histories or past credit problems. Such automobile contracts entail a higher risk of non-performance, higher delinquencies and higher losses than automobile contracts with more creditworthy customers."
— Consumer Portfolio Services, Inc., SEC annual report 10-K for fiscal year 2025, Item 1A "Risk Factors"
The numbers behind it, all from the 10-K: as of December 31, 2025, loans totaling $447 million were more than 30 days past due (11.8 percent of the portfolio), a further $111 million sat in repossession (the car has been picked up but not yet auctioned) — together 14.8 percent of the book (prior year: 14.8 percent; end of 2023: 14.5 percent). Net charge-offs ran at 7.8 percent of the average portfolio in 2025 — after 7.6 percent in 2024 and 6.5 percent in 2023, so the direction is up. Translated: of every $100 lent out, nearly $8 did not come back in 2025 — the model only sustains that because customers pay average portfolio yields north of 11.4 percent (a figure already computed net of expected losses under fair value accounting). On top comes the deferral valve: 99,830 accounts carrying $1.69 billion of balances — about 45 percent of the portfolio — have received at least one "extension", a one-month postponement of the due payment; 58,326 accounts two or more. CPS classifies such extensions as "insignificant delays", and they keep loans out of the delinquency statistics. That is industry practice, transparently disclosed — and still the reason you should read the 14.8 percent as a floor: it is the delinquency ratio after the valve has been applied. Picture a landlord who routinely waives a month's rent for tenants in arrears: on paper his tenants pay on time — the question is what happens when he has to close the valve.
Uncomfortable truth no. 4: Earnings hinge on the company's own estimates — without the "marks", 2024 pre-tax income would have been just $6.4 million
The quietest uncomfortable truth sits in the accounting. Since 2018, CPS has carried new loans at fair value: the company estimates future cash receipts including expected losses and books interest at a smoothed yield. Sounds technical, but it has a punchline — periodic revaluations, called "marks", flow directly into revenue:
"Results for the years ended December 31, 2025, and 2024 include marks of $6.5 and $21.0 million, respectively, to the carrying value of the portion of the receivables portfolio accounted for at fair value. The marks are estimates based on our evaluation of the appropriate fair value and future earnings rate of existing receivables compared to recently acquired receivables and increases or decreases in our estimates of future net losses."
— Consumer Portfolio Services, Inc., SEC annual report 10-K for fiscal year 2025, Item 7 "Critical Accounting Estimates"
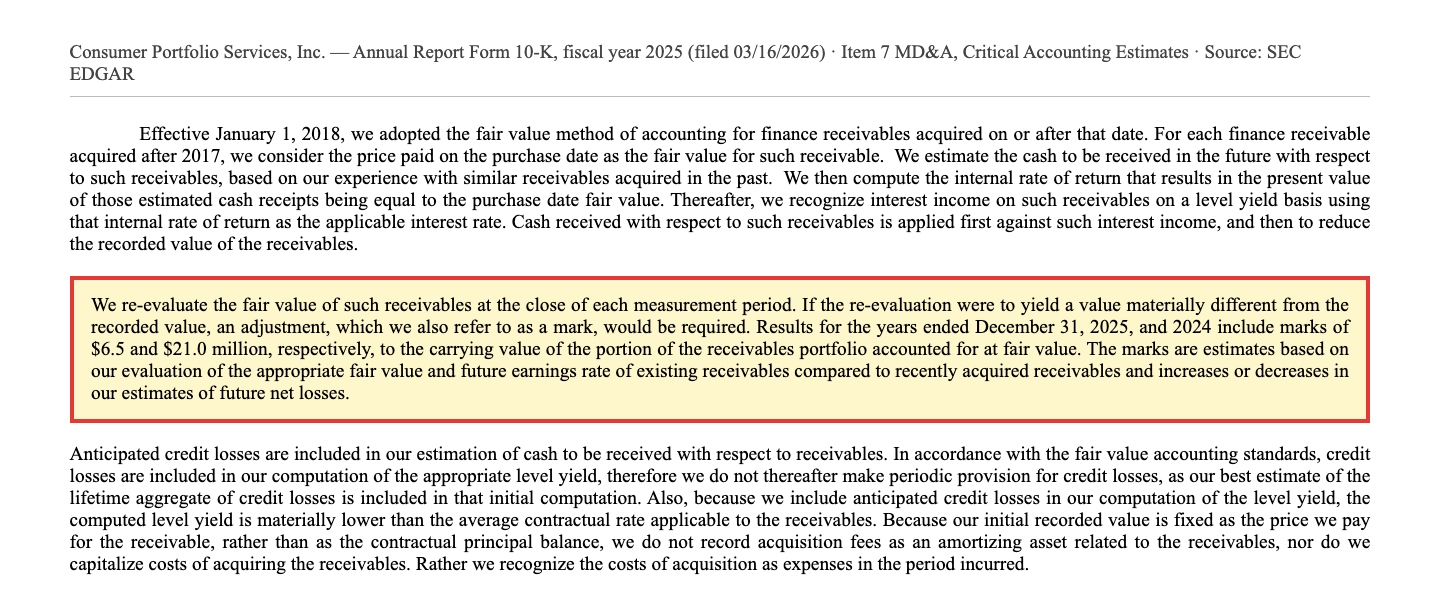
Now the counter-calculation no screener shows: pre-tax income was $28.0 million (2025) and $27.4 million (2024). Without the marks — $6.5 million and $21.0 million — that would have left $21.5 million (2025) and a meager $6.4 million (2024). Put differently: in 2024, three quarters of pre-tax income came from revaluing the company's own loan book based on its own estimates. All of it is legal, audited and disclosed in detail; the assumptions (magnitude and timing of charge-offs, discount rates) are laid out in the filing, and in the first quarter of 2026 the mark was zero — the $5.5 million profit was earned entirely without a write-up for the first time in a long while, a good sign. But as an investor you should know: under fair value accounting, the line between "earned" and "estimated" is a management judgment — and the same estimates that lift earnings today would have to depress them in a recession. Do not mistake the precision of the decimal places for certainty.
Valuation: a $210 million market cap for $314 million of book value — cheap for reasons
As of the July 8, 2026 data cut-off, CPSS traded around $9.50, for a market value of roughly $210 million on 21.7 million shares outstanding (March 31, 2026). Against that stand: book value of $314.4 million, or $14.49 per share (March 31, 2026) — so the stock trades at roughly 0.66 times book — and 2025 diluted earnings of $0.80 per share, about 12 times earnings; on the annualized first quarter of 2026, closer to 10 times. The price-to-sales ratio of about 0.5 means little in a lending business — revenues are gross interest, offset by $232 million of interest costs. Why the discount to book? You know the answers by now: earnings shrunk to a quarter, charge-offs trending up, a business model on the securitization drip, and earnings quality with an estimate component. Add quiet dilution: the diluted share count (24.1 million) includes more than 2 million shares from options and warrants — a gap of over 10 percent between basic and diluted. On the plus side: CPS consistently buys back its own stock — 942,550 shares in 2025 at an average of $9.20, clearly below book value, which mechanically raises book value per remaining share; the share count fell from 21.84 million to 21.70 million in a single quarter. The program has one blemish, though, documented in the related-party section: in 2024 the company bought 120,000 shares directly from its CEO, and in 2025 twice 100,000 shares directly from a director — partly without the required pre-approval of the audit committee ("subsequently ratified"). It fits the picture that management's 2025 say-on-pay vote drew only 62 percent approval. In short: the stock is measurably cheap — but it is cheap as a package of interest-rate leverage, credit risk and governance quirks, not as an overlooked cash-flow gem.
Opportunities and risks at a glance
What speaks for CPSS:
- Fourteen consecutive profitable fiscal years (2012 through 2025) in an industry that punishes cycles mercilessly — plus 34 years of management continuity and a refinancing assembly line proven across 107 securitizations since 1994 ($22.4 billion).
- The wheel is turning faster again: portfolio up 73 percent since the end of 2021 to $3.9 billion, revenue up 10.4 percent in 2025, Q1 2026 diluted earnings per share up 26 percent to $0.24 — and refinancing is getting cheaper: the April 2026 securitization priced at 5.51 percent after 8.48 percent in October 2022.
- Valuation cushion: roughly 0.66 times book value and about 12 times 2025 earnings (data as of July 8, 2026); buybacks below book (942,550 shares in 2025 at an average of $9.20) raise value per share.
- The scanner at least confirms the trend: stage-2 uptrend, price above the 50- and 200-day lines, Power Trend, Piotroski F-score of 7 of 9 (data as of July 8, 2026).
- Q1 2026 needed no fair value write-up (mark: zero) — earnings quality improved recently, and the Capital One warehouse line was expanded from $167.5 million to $390 million in April 2026.
What speaks against it:
- The scanner metric is a mismeasurement here: an "FCF/market cap of 143 percent" describes the throughput of a debt-financed loan book — not distributable money; unrestricted cash as of March 31, 2026: $6.9 million.
- Extreme leverage and capital markets dependency: $3.67 billion of debt on $314 million of equity (roughly 11.7 times); four securitizations a year are mandatory — and that market was temporarily shut from 2008 through 2010 and in April 2020.
- Credit quality under pressure: net charge-offs of 7.8 percent (2025) after 6.5 percent (2023), 14.8 percent of the book past due or in repossession, about 45 percent of the portfolio deferred at least once — in a recession all three levers move at the same time.
- The interest scissors: interest expense rose from $87.5 million (2022) to $232.0 million (2025) and crushed net income from $86.0 million to $19.3 million — the recovery depends on refinancing rates continuing to fall, which nobody guarantees.
- Earnings quality and governance: in 2024 roughly three quarters of pre-tax income came from fair value marks based on the company's own estimates; buybacks directly from the CEO and a director proceeded without pre-approval (ratified afterwards), and the 2025 say-on-pay vote drew only 62 percent approval.
A human conclusion
Back to the dream-metric trap from the beginning. Its core is not that screeners lie — our own screener reported CPSS correctly. Its core is that every metric has a context, and that the most seductive numbers appear precisely where the context is missing. "More free cash flow than market cap" was not a hidden gift at CPSS; it was a mismeasurement with an announcement: a lender whose inventory purchases disappear into the investing line. What remains after doing the math is an honest and genuinely interesting story — a sub-prime specialist run by the same CEO for 34 years, profitable for fourteen straight years, its earnings compressed to a quarter by the rate shock, now available at two thirds of book value just as refinancing turns cheaper. Against that stand 7.8 percent charge-offs and rising, a book of which almost half has already needed to catch its breath, and an assembly line that requires open capital markets every 90 days. So the honest question to you is not "How can something with a 143 percent FCF yield be too expensive?" — but rather: would you buy this company at two thirds of book value even if the scanner had never pinned a cash-flow medal on it? If yes, then buy it for the book value, the rate turn and the discipline — knowing that the next recession always hits sub-prime auto loans first. If no, the dream metric just handed you a lesson that was cheaper than any bad investment. What you make of it is your decision. And that is exactly as it should be.
Sources
All original documents used in this analysis — for your own reading:
- Consumer Portfolio Services, Inc. — SEC annual report 10-K for fiscal year 2025 (filed March 16, 2026)
- Consumer Portfolio Services, Inc. — SEC annual report 10-K for fiscal year 2024 (filed March 12, 2025)
- Consumer Portfolio Services, Inc. — SEC quarterly report 10-Q as of March 31, 2026 (filed May 8, 2026)
- Complete SEC filing history of Consumer Portfolio Services, Inc.: EDGAR overview (sec.gov)
- Fundamental data (metrics, quarterly series, valuation; data as of July 8, 2026), cross-checked against the SEC filings.
- Screener and rating data: in-house stock scanner (data as of July 8, 2026; FCF/market-cap rank verified on July 18, 2026).
Transparency & disclaimer: This analysis is a journalistic contextualization of publicly available information and is not investment advice, not a financial analysis in the regulatory sense and not a solicitation to buy or sell securities. Stock investments carry substantial risks up to and including total loss. All information without guarantee; the data cut-off is noted in the text. The author holds no position in CPSS shares at the time of publication.
Our Bottom Line at a Glance
- Business model & track record positive
- In sub-prime auto finance since 1991, $24.7 billion of loans purchased, 107 securitizations since 1994, fourteen consecutive profitable fiscal years (2012 through 2025) and 34 years of management continuity — the portfolio has grown 73 percent since the end of 2021 to $3.9 billion (10-K 2025).
- The scanner metric FCF/market cap negative
- The roughly 143 percent "FCF yield" (data as of July 8, 2026) is a mismeasurement of the business model: $289.0 million of operating cash flow (2025) stands against $1,639.0 million of loan purchases in investing cash flow and $335.9 million of fresh net financing; unrestricted cash as of March 31, 2026: $6.9 million (10-K 2025, 10-Q Q1 2026).
- Earnings & the rate turn neutral
- Net income compressed from $86.0 million to $19.3 million (2022 through 2025) as interest expense exploded to $232.0 million — but refinancing has been getting cheaper since 2024 (April 2026: 5.51 percent after 8.48 percent in October 2022), and Q1 2026 delivered a 26 percent EPS gain without any fair value write-up.
- Credit quality & leverage negative
- Net charge-offs of 7.8 percent and trending up, 14.8 percent of the book past due or in repossession, about 45 percent of the portfolio deferred at least once — on $3.67 billion of debt against $314 million of equity (roughly 11.7 times) and a model that needs four open securitization windows a year (10-K 2025, 10-Q Q1 2026).
- Valuation & capital allocation neutral
- Roughly 0.66 times book value and 12 times 2025 earnings (data as of July 8, 2026) are a real discount, and buybacks below book (942,550 shares at an average of $9.20) create value per share — tarnished by repurchases directly from the CEO and a director without pre-approval (subsequently ratified) and a 2025 say-on-pay approval of only 62 percent (10-K 2025, Item 13).
CPSS is not a cash-flow miracle but a highly leveraged sub-prime specialist with an honest price tag: for a lender, the FCF/market-cap scanner metric measures the throughput of the machine, not free money — what is real is two thirds of book value, fourteen profitable years and a rate cycle turning from headwind to tailwind, set against 7.8 percent charge-offs, nearly twelvefold leverage and a refinancing assembly line that presumes open capital markets. Whoever buys the stock buys the package — not the metric. Not investment advice.
What Our Rating Means
- If you don't own the stock
- As long as the question raised in the bottom line stays open, we see no basis for an entry.
- If you hold it in your portfolio
- Our findings offer no acute reason to sell — the checkpoints named remain decisive.
A journalistic assessment by our editorial team at the time of the deep dive, based on public sources — not investment advice and not a solicitation to buy or sell. Your personal circumstances (investment goals, risk capacity, taxes) cannot be taken into account. What our categories mean, how verdicts are formed, and what conflicts of interest exist →
Worth Noting
- CPSS reached our research list via rank 14 in the in-house FCF/market-cap scanner (as of July 18, 2026; scanner data as of July 8, 2026) — the analysis deliberately shows why this metric does not work as a buy signal for loan-book businesses such as banks and consumer lenders.
- Financials caveat: for lenders, operating and "free" cash flow are not measures of distributable money, because loan purchases run through investing cash flow and are debt-financed; what matters are earnings, book value, charge-off rates and refinancing costs.
- Price and valuation figures dated July 8, 2026 (about $9.50 per share, about $210 million market cap); analyses are evergreen, daily prices are not a buy argument.
Frequently Asked Questions
Consumer Portfolio Services (Nasdaq: CPSS) has been buying auto loans from U.S. dealers since 1991 — loans to customers with weak or damaged credit who cannot get bank financing (sub-prime), 90 percent of them for used cars — and services them itself. Funding comes from quarterly ABS securitizations (107 since 1994, roughly $22.4 billion) plus three warehouse credit lines. Managed portfolio at the end of 2025: $3.9 billion; revenue 2025: $434.5 million (+10.4 percent).
Because a lender's loan purchases — its true "inventory" — sit in investing cash flow and drop out of "free cash flow" entirely. CPS reported $289.0 million of operating cash flow in 2025 but bought $1,639.0 million of new loans and plugged the gap with fresh securitization debt (financing cash flow: +$335.9 million). Unrestricted cash as of March 31, 2026 was just $6.9 million — the dream metric measures throughput, not distributable money.
Considerably riskier than bank loans — the company's own annual report says they "entail a higher risk of non-performance, higher delinquencies and higher losses". As of December 31, 2025, 14.8 percent of the portfolio was over 30 days past due or in repossession; net charge-offs ran at 7.8 percent in 2025 (2023: 6.5 percent). Accounts carrying about 45 percent of the balances have received at least one payment extension. The offset: average portfolio yields of 11.4 percent.
Almost entirely with debt: as of March 31, 2026, $3.67 billion of liabilities ($2,992 million of securitization notes, $467 million of warehouse lines, $181 million of residual interest financing, $28 million of subordinated notes) stood against $314 million of equity — roughly 11.7 times. Most of it is non-recourse to the parent, but the model needs about four securitizations per year; in the crises of 2008 through 2010 and in April 2020 that market was temporarily closed.
Because of the rate shock: interest expense rose from $87.5 million (2022) to $232.0 million (2025) as zero-rate-era loans had to be refinanced at high-rate-era prices — the October 2022 securitization cost 8.48 percent after 2.54 percent in January 2022. Net income fell from $86.0 million (2022) to $19.3 million (2025). Since 2024 rates have been falling again (April 2026: 5.51 percent), and Q1 2026 showed diluted earnings per share up 26 percent.
Revaluations of the loan book carried at fair value that flow directly into revenue — based on the company's own estimates of future losses. In 2024 the mark was $21.0 million against only $27.4 million of pre-tax income (roughly three quarters); in 2025 it was $6.5 million of $28.0 million. In the first quarter of 2026 the mark was zero — the $5.5 million profit was earned without any write-up.
Optically yes: about $9.50 per share against book value of $14.49 per share (0.66 times book) and roughly 12 times 2025 earnings (data as of July 8, 2026), plus buybacks below book value. But the discount has reasons: 11.7 times debt leverage, rising charge-offs, capital markets dependency, fair value earnings components and governance question marks (buybacks directly from the CEO and a director without pre-approval; 2025 say-on-pay approval of only 62 percent).
Found an error?
Did you spot a factual error, an outdated number, or a typo in this deep dive? Let us know briefly — your report goes straight to the editorial team.