Q2 Holdings: $97 Million of Buybacks — and 76,000 Fewer Shares
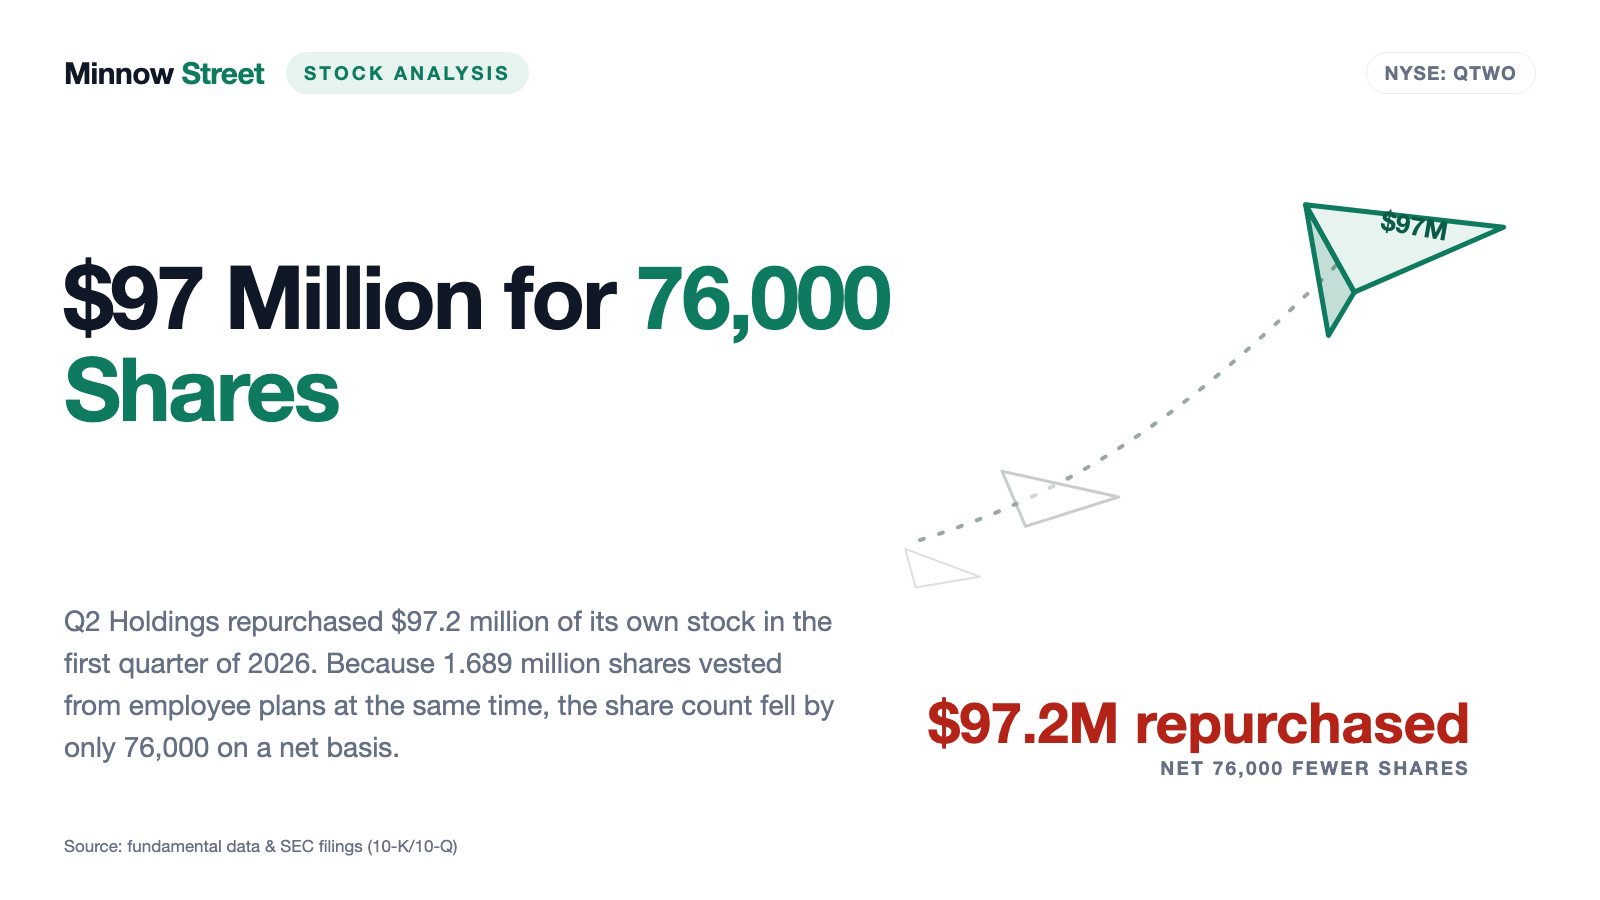
Q2 Holdings sells regional banks their online banking, and in 2025 it posted its first annual profit in years: $52.0 million of net income on $794.8 million of revenue, plus $201.5 million of operating cash flow. That is why our in-house stock scanner lists the shares on the Piotroski screen at 7 of 9 points. The quarterly report filed April 29, 2026, also shows what $97.2 million of buybacks actually achieved in the first quarter: the share count fell from 62.741 million to 62.665 million — a net 76,000 shares. Not investment advice, just the arithmetic of what a buyback really leaves behind.
 Thomas Mücke
Founder & Publisher
Thomas Mücke
Founder & Publisher
Chart
Interactive price chart (TradingView).
Note: pure fact-based analysis, not investment advice and not a solicitation to buy or sell. All figures without guarantee.
There is an investor trap that feels like a reward for patience: the turnaround reflex. You watch a company lose money for years, and then it finally flips into the black. That first profitable year feels like the moment the train leaves the station — "the numbers work now". The reflex is stubborn because it rests on a real observation. At Q2 Holdings, Inc. (NYSE: QTWO) the numbers really do work: 2025 brought the first annual profit in many years, $52.0 million of it, and the business pushed $201.5 million of cash through the door. That is why our in-house stock scanner lists the shares on the Piotroski screen at 7 of 9 points. And yet the stock roughly halved over the same stretch. So let us make a deal. Before you decide who is right — the books or the tape — we read together what the company itself filed with the U.S. securities regulator, the SEC: the annual report (10-K) for 2025, filed February 11, 2026, and the quarterly report (10-Q) for the period ended March 31, 2026, filed April 29, 2026. An SEC filing is honest under penalty of law. This one describes a solid software business, $97.2 million of buybacks that removed a net 76,000 shares, and a company that names artificial intelligence as a threat to its own demand.
What Q2 Holdings actually does — the banking app behind the bank
When you open your community bank's app, the bank did not build that app. It rents it. That is the business Q2 Holdings runs, and it runs it for the institutions American filings call "regional and community financial institutions": banks and credit unions too small to keep hundreds of engineers on staff, and too large to skip digital banking altogether. Q2 supplies the platform on which their customers hold accounts, move money, apply for loans and receive fraud alerts. Customers pay a subscription — software as a service, or in plain language: rent instead of purchase. That is why revenue arrives so evenly, and why a single weak quarter rarely looks like a collapse here.
The scale sits in the 2025 annual report. As of December 31, 2025, more than 1,200 financial institutions used at least one Q2 solution, including more than half of the 100 largest U.S. banks and more than half of the 100 largest U.S. credit unions, measured by total assets. 457 institutions had the full digital banking platform installed, carrying roughly 27.3 million registered end users (2024: 24.7 million; 2023: 22.0 million). More than $4.0 trillion in financial transactions ran across that platform during 2025. The catalog spans over 60 product offerings and more than 1,000 integrations with third parties.
Three further legs sit alongside the digital banking platform. The risk and fraud solutions — 850 customer accounts, per the report — flag suspicious payments and can be bought on their own. The digital lending and relationship pricing tools help banks originate loans and price whole relationships. And Helix is the banking-as-a-service platform through which financial technology startups can offer bank products without running a charter themselves — in everyday terms: Q2 rents out the kitchen, the startup writes the menu.
That frames the central tension of this analysis, and it runs through every chapter: the books have turned clean — but a large share of the freshly earned millions never reaches shareholders; it goes into offsetting the company's own employee stock plans. For how much a digital financial business depends on scale, see our analysis of Remitly.
How the stock reached our desk
The path ran through a metric named after the economist Joseph Piotroski. His F-Score is a nine-point test of the health of the books: it asks in turn whether a company earns a profit, generates cash, whether that profit is more than bookkeeping, whether leverage is falling, liquidity rising, whether no new shares were issued, and whether margin and asset turns improved. Each condition met is one point. QTWO scores 7 of 9 (data as of July 24, 2026). For context, because a bare number helps nobody: 7 is good, not spotless. A genuinely healthy company sits at 8 or 9; below 4 it gets uncomfortable. A 7 tells you: the direction is right, two doors still stick.
That places the stock in the U.S. section of our Piotroski screen, which held 16 U.S. names as of July 26, 2026. If you want to retrace it, open our in-house stock scanner and pick the screen Piotroski F-Score (7–9). Two honest caveats belong with that: these lists are recalculated daily, and where scores tie, the ordering is not stable.
The interesting part is the company that QTWO keeps on the other screens that same day. There are five more, and they nearly contradict one another. Turnaround candidates and fallen angels describe a stock that has fallen hard and might steady. Power trend, Pros 80% and Oliver Kell: Strength on Down Day describe price behavior. What none of them captures is relative strength: it reads 9 out of 99 — the weakest decile of the market. As of the July 24, 2026, data cut-off, the stock sat roughly 69 percent below its all-time high and roughly 51 percent lower over twelve months, while standing only about 8 percent above its twelve-month low.
Remember that contradiction; it is the thread of this piece: the books point up, the price points down. One of the two is wrong — or they are measuring different things. That is exactly what we look at next.
The numbers over the years — credit where credit is due
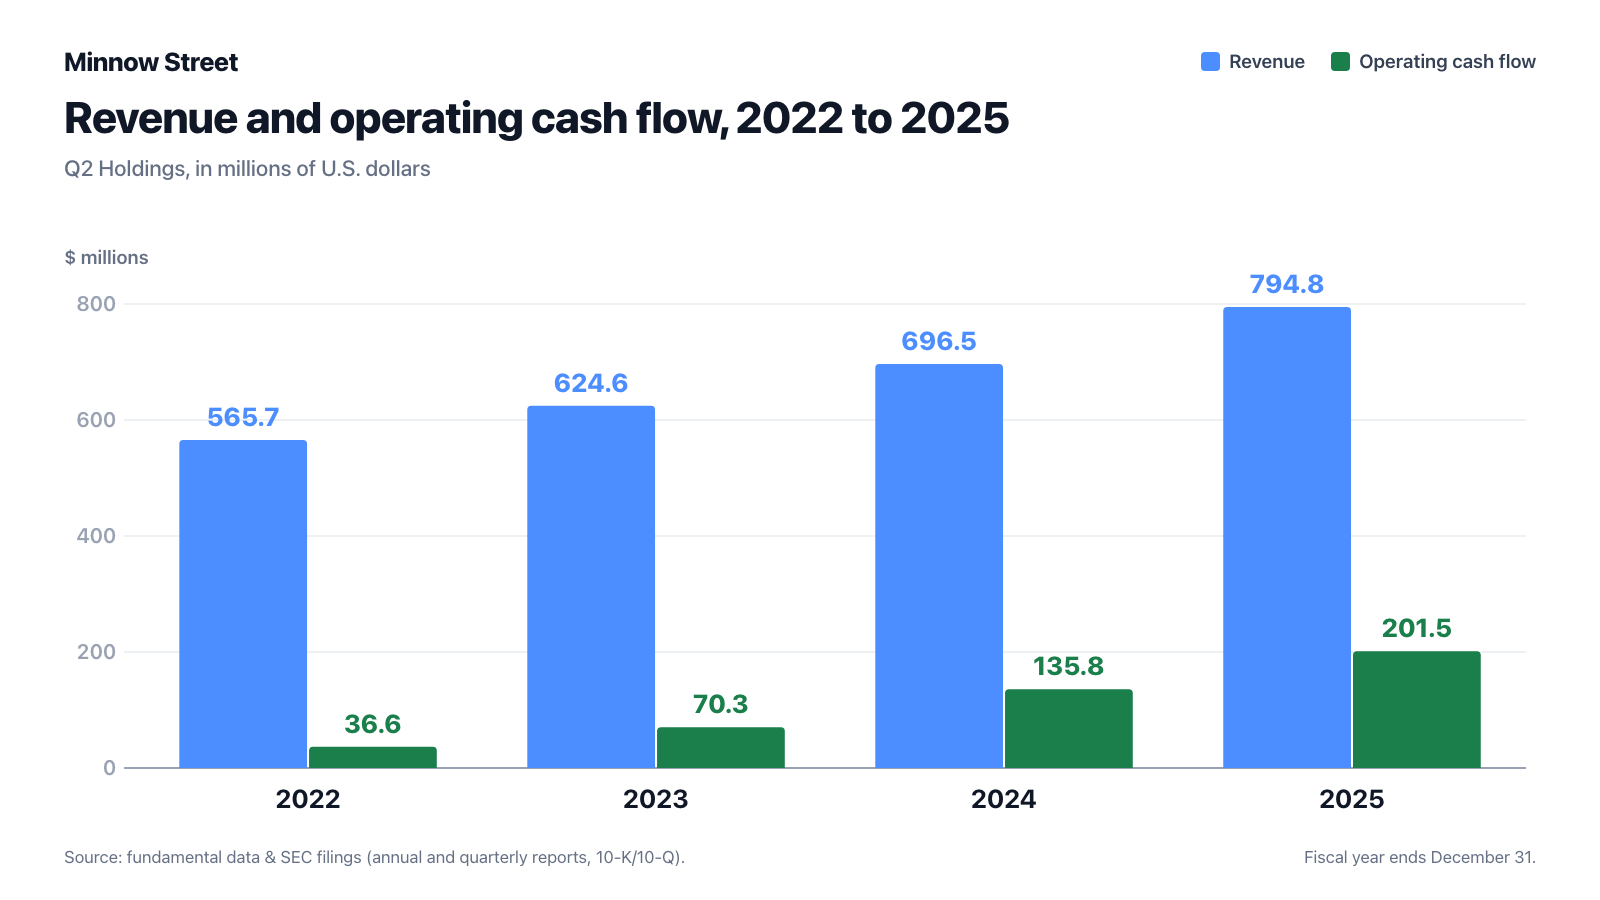
First the part that genuinely impresses, and it is more than the chart suggests. Revenue has grown for years without a single step back: $565.7 million (2022), $624.6 million (2023), $696.5 million (2024) and $794.8 million in 2025 — up 14.1 percent year over year. The second series is the more remarkable one: operating cash flow, the money the running business actually deposits before investment spending leaves again. It rose from $36.6 million (2022) through $70.3 million (2023) and $135.8 million (2024) to $201.5 million in 2025. That is more than a fivefold increase in three years.
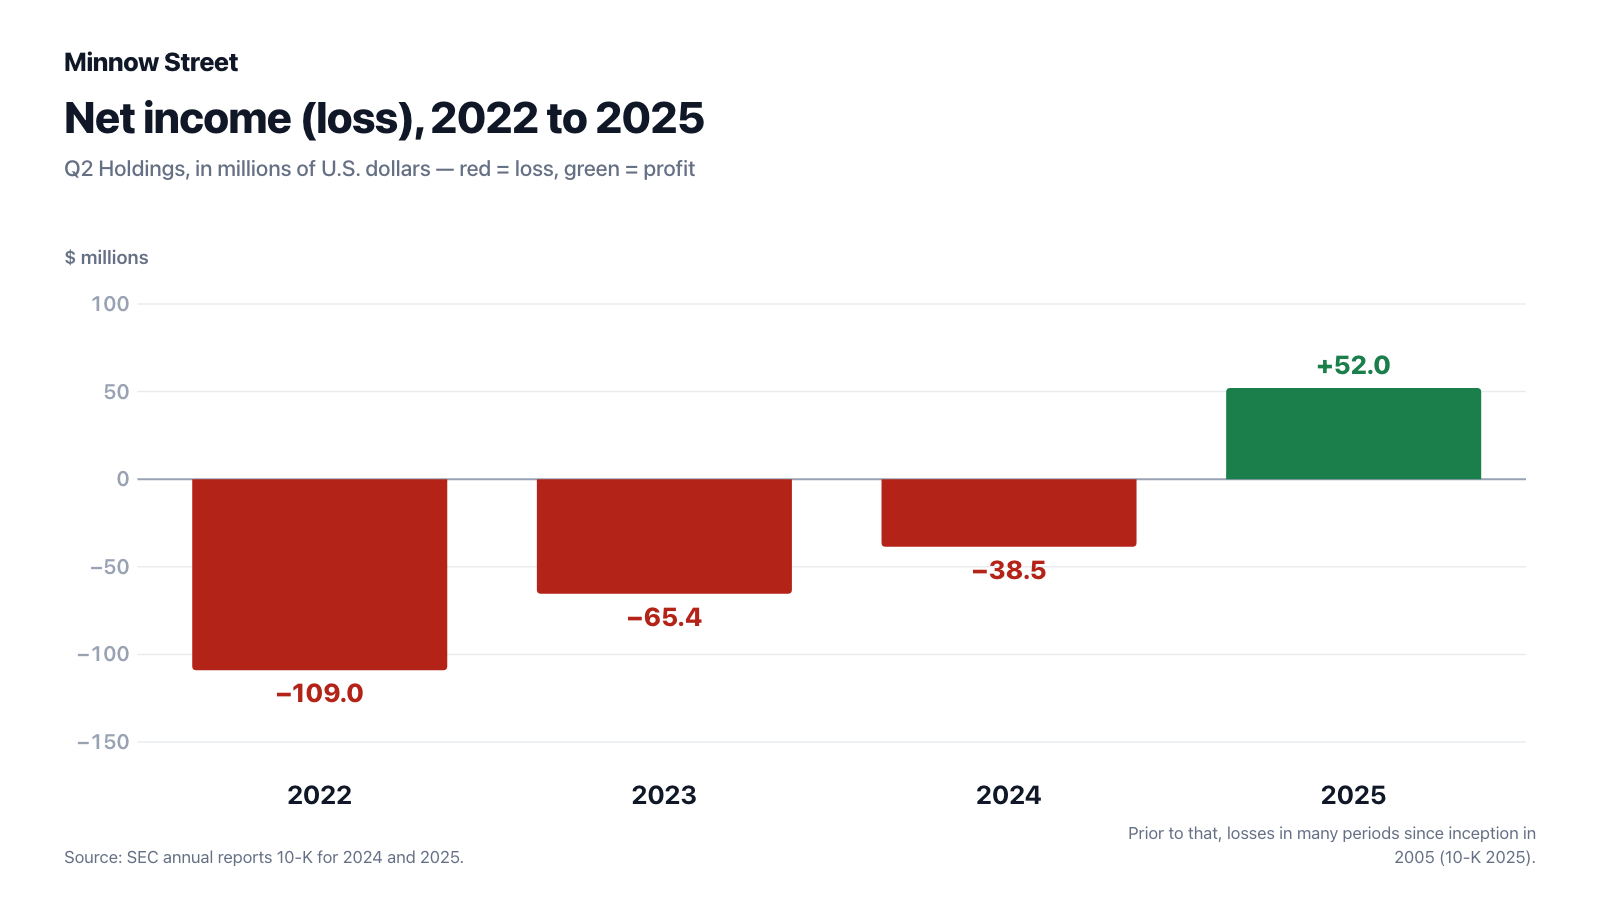
The actual event sits one line below. A $42.3 million operating loss in 2024 became $39.9 million of operating income in 2025, and the bottom line showed $52.0 million of net income — after losses of $38.5 million in 2024, $65.4 million in 2023 and $109.0 million in 2022. The filing names the reason for the long drought without dressing it up.
"We have incurred losses from operations in many periods since our inception in 2005. We incurred net losses of $38.5 million and $65.4 million for the years ended December 31, 2024 and 2023, respectively, and net income of $52.0 million for the year ended December 31, 2025. As of December 31, 2025, we had an accumulated deficit of $612.2 million."
— Q2 Holdings, Inc., SEC annual report 10-K for 2025, Item 1A "Risk Factors"
The first quarter of 2026 did not merely continue the trend, it accelerated it. Revenue rose to $216.5 million (prior-year quarter: $189.7 million, up 14.1 percent), operating income jumped from $2.2 million to $27.7 million, and net income from $4.8 million to $26.6 million — $0.40 per diluted share against $0.07. The subscription business carried it: subscription revenue rose 16.6 percent to $179.9 million while transactional revenue slipped to $17.8 million. Remaining performance obligations — contracted revenue not yet recognized — stood at roughly $2.74 billion as of March 31, 2026, more than three times a year of revenue, with about 53 percent expected to convert to revenue within 24 months.
What the filings say — the uncomfortable truths
So much for the sunny side. Now the lines the Piotroski score does not capture.
Uncomfortable truth No. 1: $97.2 million of buybacks, 76,000 fewer shares
A share repurchase is usually read as a courtesy to owners: the company buys its own shares off the market and retires them, so your slice of the pie grows. In October 2025 the board authorized a program of up to $150.0 million. In the first quarter of 2026 Q2 used it energetically, repurchasing 1.765 million shares for $97.2 million; all of them were retired. That works out to roughly $55 per share.
Now the line that reframes the exercise. The statement of changes in stockholders' equity in the same quarterly report tracks the share count: as of December 31, 2025, 62.741 million shares were outstanding. Subtract the 1.765 million repurchased — and add 1.689 million new shares that vested from employee stock plans in the same quarter. Result as of March 31, 2026: 62.665 million shares. A net reduction of 76,000 shares, or 0.12 percent. For $97.2 million.

This is not an accusation, it is arithmetic every investor should run once. The buyback did not grow the pie; it kept it from shrinking. Compare the prior-year quarter, which had no buyback: the count rose from 60.728 million to 62.304 million, up 2.6 percent in three months. Remember: when a buyback merely offsets dilution, it is not a distribution, it is a payroll expense settled in cash. The matching income-statement line is stock-based compensation, which came to $86.9 million in 2025 — 10.9 percent of revenue and 1.7 times the $52.0 million of net income.
Uncomfortable truth No. 2: the $304 million date, three months after the buyback
The timing of that buyback deserves a second look. As of March 31, 2026, current liabilities included $303.7 million of convertible notes — $304.0 million of remaining principal, a 0.75 percent coupon, issued in June 2019 and due June 1, 2026. A convertible note is a loan with an exchange right: the lender may demand shares instead of cash. Here at a conversion price of $88.61 per share. With the stock far below that in 2026, the right was worthless — the filing states explicitly that the if-converted value did not exceed the principal as of March 31, 2026, and that none of the notes had been converted since issuance. In plain terms: they had to be repaid in cash.
Q2 sized the need itself and declared it covered:
"As of March 31, 2026, our principal sources of liquidity were cash, cash equivalents and investments of $378.9 million. Based upon our current levels of operations, we believe that our cash flow from operations along with our other sources of liquidity, including our ability to access capital markets and available borrowings under our $125.0 million Revolving Credit Agreement, are adequate to meet our cash requirements for the next twelve months, including the repayment of our 2026 Notes upon maturity."
— Q2 Holdings, Inc., SEC quarterly report 10-Q as of March 31, 2026, "Liquidity and Capital Resources"

Two points belong here in fairness. First, Q2 has done exactly this before: in November 2025 it repaid the remaining $191.0 million of the predecessor notes in cash. Second, the math is still tight: $304.0 million leaves $378.9 million of liquidity, the business deposits a little over $50 million of operating cash flow per quarter, and $47.8 million of the buyback program was still open at the reporting date. Spending $97.2 million on your own shares with that date in the calendar is a deliberate choice — and the numbers that measure it sit in the next quarterly report: the cash balance (last reported at $342.3 million) and the line "Convertible notes, current portion" (last reported at $303.7 million), which should have disappeared.
Uncomfortable truth No. 3: the margin jumped because costs stood still
The first-quarter profit jump looks spectacular, and part of it is genuine scale. But the mechanics deserve a look. Cost of revenues — for a software company mostly implementation and support staff, cloud capacity and amortization — came to $88.6 million in the quarter against $88.7 million a year earlier. It fell 0.2 percent while revenue rose 14.1 percent. As a share of revenue it dropped from 46.8 percent to 40.9 percent, and gross margin jumped from 53.2 percent to 59.1 percent.
Where does that come from? The filing names the components itself: a $1.6 million decrease from higher capitalized implementation costs; a $1.2 million decrease because amortization of acquired technology ran out during the prior year; a $0.4 million decrease in personnel costs. Against that stood $1.9 million more amortization of capitalized software and implementation services and $1.1 million more in cloud and overhead costs. Capitalizing means an outlay does not hit the income statement but the balance sheet, to be amortized in slices later. That is permitted and common — but it pushes expense into the future. Across 2025 Q2 capitalized $21.3 million of software development, on top of the $154.3 million that ran through the income statement as research and development.
For you that means part of the margin jump is efficiency and part of it is calendar. The honest test question is whether a 40.9 percent cost ratio holds once the expired amortization no longer works as a year-over-year tailwind.
Uncomfortable truth No. 4: customers stay — a little less than before
In rented software the sale matters less than the renewal. Q2 measures that with two metrics. Net revenue retention shows how much revenue existing customers deliver the following year: 113 percent in 2025 (2024: 109; 2023: 108). Above 100 percent means the remaining customers spend more than the departing ones took away — a good sign. The second metric is revenue churn, and it points the other way: 5.2 percent in 2025, after 4.4 percent in 2024 and 6.1 percent in 2023.

Eight tenths of a percentage point sounds small. Measured against total annual recurring revenue of $921.4 million at the end of 2025, it is not: every point of churn equals a little over nine million dollars that has to be replaced each year before any growth even starts. The filing names consolidation among customers as one cause — when two community banks merge, one contract survives instead of two. For how much pressure those banks are under themselves, see our analysis of Banner Financial — the same customer group, seen from the other side.
Uncomfortable truth No. 5: the company names AI as a threat itself
Q2 uses machine learning in its own products — the fraud solutions, per the annual report, rely on "advanced analytics and machine learning techniques" and can be sold on a standalone basis. That makes the risk section of the same filing all the more notable. There, artificial intelligence is not just a tool but a threat to the business model:
"Additionally, AI, including generative AI and autonomous decisioning technologies, is evolving rapidly and may significantly alter how financial technology products and services are developed, distributed and consumed. AI-enabled offerings may reduce demand for our products and services, compress pricing, weaken customer relationships or shift value creation away from regulated financial institutions toward technology providers."
— Q2 Holdings, Inc., SEC annual report 10-K for 2025, Item 1A "Risk Factors"

No need to dramatize it — risk sections exist to write down uncomfortable things. But the sentence is unusually specific: it describes exactly the scenario in which a bank sources its customer-facing layer from an AI vendor rather than from Q2. Anyone trying to explain a falling share price against improving numbers will find at least part of the answer here.
Valuation — what the market pays for the turn
As of the July 24, 2026, data cut-off, market value stood at roughly $2.8 billion on 62,600,423 shares outstanding (cover page of the quarterly report, as of April 29, 2026). That yields orders of magnitude rather than point estimates: a price-to-sales ratio of about 3.4, a price-to-earnings ratio of about 42 on the trailing twelve months and about 19 on the estimate for the current year, plus a price-to-cash-flow ratio of about 13. For a software company growing 14 percent with recurring revenue, that is not a bargain price — but it is also not the valuation the same ticker carried through the loss years.
Two anchors from the filings help without quoting a daily price. First the buyback: Q2 paid roughly $55 per share in the first quarter of 2026. Second the insider sale notices (Form 144), which state the market value of the shares announced — the notice of June 10, 2026 lists 3,603 shares at a market value of $156,647.24, or roughly $43.48 per share; the notice of June 1, 2026, implied roughly $49.50. The company's own repurchases therefore sat well above what was paid a few weeks later. That $47.8 million of the program remains open is both an opportunity and a caution.
The professional view is friendlier than the market's: 17 analysts cover the name, with a mean price target of $72.18 as of the July 24, 2026, data cut-off. Such targets are opinions, not measurements — they say more about industry expectations than about the company. The other side is more telling: 8.6 percent of the float was sold short, and the fundamental data show 20 insider sale filings without a single purchase (data as of July 24, 2026). The balance sheet is comfortable: the equity ratio stood at 49 percent and the Altman Z-Score — an early-warning gauge for insolvency risk — at 2.99, in the grey zone just below the 3.0 usually treated as safe. One item deserves attention: $512.9 million of goodwill from earlier acquisitions, equal to 41 percent of total assets and 84 percent of equity. Goodwill is not a building or a machine; it is the premium paid in past takeovers, and it can be written down when expectations are not met.
Opportunities and risks at a glance
What speaks for Q2 Holdings:
- Recurring revenue with a documented order cushion: $2.74 billion of remaining performance obligations as of March 31, 2026, more than three times a year of revenue; net revenue retention of 113 percent in 2025.
- The turnaround has landed in the books: a first annual profit in 2025 ($52.0 million) after losses in many periods since inception in 2005, with $201.5 million of operating cash flow.
- Acceleration rather than fade: operating income rose from $2.2 million to $27.7 million in the first quarter of 2026, gross margin from 53.2 percent to 59.1 percent.
- Deeply embedded with customers: more than 1,200 financial institutions, including over half of the 100 largest U.S. banks and the 100 largest U.S. credit unions; replacing core banking software takes years.
- Solid balance sheet: $378.9 million of liquidity as of March 31, 2026, an undrawn $125.0 million revolver, a 49 percent equity ratio and no meaningful interest burden (0.75 percent coupon).
- Tax tailwind: roughly $458.8 million of U.S. federal net operating loss carryforwards as of December 31, 2025, available to shelter future income.
What speaks against it:
- The buyback mostly offsets dilution: $97.2 million in the first quarter of 2026 cut the share count by a net 76,000 shares (0.12 percent); stock-based compensation came to $86.9 million in 2025, 1.7 times the annual profit.
- A tight cash calendar: $303.7 million of convertible notes were current as of March 31, 2026 (due June 1, 2026), against $378.9 million of liquidity and a further $47.8 million of open buyback authorization.
- Part of the margin jump is calendar: expired amortization of acquired technology ($1.2 million) and higher capitalized implementation costs ($1.6 million) helped hold down cost of revenues in the first quarter of 2026.
- Churn rose to 5.2 percent in 2025 from 4.4 percent in 2024 — a little over nine million dollars per point against $921.4 million of recurring revenue.
- A self-declared AI risk: the 2025 annual report names AI-enabled offerings as potential demand and pricing pressure and as a force that could shift value creation from banks to technology providers.
- The market does not believe the turn yet: relative strength of 9 out of 99, roughly 69 percent below the all-time high, 8.6 percent of the float sold short, and 20 insider sale filings without a single purchase (data as of July 24, 2026).
- $512.9 million of goodwill equals 84 percent of equity — an item that can be written down if expectations disappoint.
A human bottom line
Back to the turnaround reflex. Its problem is not that it points at the wrong companies — Q2 Holdings did deliver. Revenue has grown for years without a step back, cash flow has more than quintupled in three years, and in 2025 the sign flipped. The problem with the reflex is that it confuses "the company earns money" with "I earn money". At Q2, exactly $97.2 million sat between those two sentences in the first quarter of 2026, and what came out was 76,000 fewer shares.
Buying QTWO therefore is not primarily buying a turnaround. It is buying a subscription business with deep customer roots, a clean balance sheet and one open operating question: does enough of the growing cash flow stay with shareholders when employee plans pushed 1.689 million new shares into the market in the first quarter of 2026 alone? The answer sits in a single line of every quarterly report — the share count. It costs you thirty seconds of arithmetic, and it is more honest than any price target.
So the honest question is not "is 7 of 9 good enough?" but: do you believe that a company which writes down itself that AI could reduce its demand will still hold its 1,200 bank customers — and that profit will grow faster than the number of shares it is divided among? If yes, you have a thesis, and the filings give you three clear checkpoints: share count, churn, cost ratio. If no, you had a score. What you make of it is your decision. And that is exactly as it should be.
Sources
Every original document used in this analysis — for you to read yourself:
- Q2 Holdings, Inc. — SEC quarterly report 10-Q as of March 31, 2026 (filed April 29, 2026)
- Q2 Holdings, Inc. — SEC annual report 10-K for 2025 (filed February 11, 2026)
- Q2 Holdings, Inc. — SEC annual report 10-K for 2024 (filed February 12, 2025), the basis for the 2022 comparatives
- Form 8-K of June 12, 2026 (Item 5.07, annual meeting results), proxy statement DEF 14A of April 29, 2026, Schedule 13G and 13G/A filings of April 29, April 30 and May 14, 2026, and Form 144 sale notices of May 14, June 1 and June 10, 2026: EDGAR filing history for CIK 0001410384 (sec.gov)
- Fundamental data (metrics, valuation, analyst and insider figures; data as of July 24, 2026), cross-checked against the SEC filings.
- Screen memberships: our in-house stock scanner, as of July 26, 2026; the lists are recalculated daily.
Transparency & disclaimer: This analysis is a journalistic contextualization of publicly available information. It is not investment advice, not a regulated financial analysis and not a solicitation to buy or sell securities. Equity investments carry substantial risk, including total loss. All information without warranty; the data cut-off is noted in the text. The author holds no position in Q2 Holdings shares at the time of publication.
Our Bottom Line at a Glance
- Business model and retention positive
- More than 1,200 financial institutions used at least one Q2 solution as of December 31, 2025, including over half of the 100 largest U.S. banks and the 100 largest U.S. credit unions. Remaining performance obligations stood at roughly $2.74 billion as of March 31, 2026, more than three times a year of revenue. No individual customer accounted for 10 percent or more of revenues in the first quarter of 2026.
- The turn in the income statement positive
- A $42.3 million operating loss in 2024 became $39.9 million of operating income and $52.0 million of net income in 2025 — after losses in many periods since inception in 2005. Operating cash flow rose to $201.5 million (2022: $36.6 million). In the first quarter of 2026 operating income jumped from $2.2 million to $27.7 million.
- What reaches the shareholder negative
- The $97.2 million of buybacks in the first quarter of 2026 cut the share count only from 62.741 million to 62.665 million — 76,000 shares, or 0.12 percent — because 1.689 million shares vested from employee plans at the same time. Stock-based compensation came to $86.9 million in 2025, 1.7 times the annual profit.
- Balance sheet and maturity neutral
- As of March 31, 2026, $378.9 million of liquidity and an undrawn $125.0 million revolver faced $304.0 million of convertible notes due June 1, 2026; with a conversion price of $88.61 far above the share price, cash repayment was the only route. Q2 had already retired the $191.0 million predecessor issue in cash in November 2025. The equity ratio stood at 49 percent and interest expense at $1.0 million for the quarter.
- Quality of the margin jump neutral
- Gross margin rose from 53.2 percent to 59.1 percent in the first quarter of 2026 because cost of revenues fell 0.2 percent to $88.6 million while revenue grew 14.1 percent. The filing cites, among other items, $1.2 million of expired amortization on acquired technology and $1.6 million of higher capitalized implementation costs — part of the jump is calendar, not only scale.
- Self-declared AI risk negative
- The 2025 annual report explicitly names AI-enabled offerings as potential demand and pricing pressure that could weaken customer relationships and shift value creation from regulated financial institutions toward technology providers. Meanwhile churn rose to 5.2 percent in 2025 from 4.4 percent in 2024.
Q2 Holdings is no longer a turnaround story; it is a company that has already delivered its turnaround: $794.8 million of revenue in 2025 (up 14.1 percent), a first annual profit of $52.0 million, $201.5 million of operating cash flow, $2.74 billion of remaining performance obligations and a balance sheet with a 49 percent equity ratio. The open question sits one level down: $97.2 million of buybacks in the first quarter of 2026 removed a net 76,000 shares because 1.689 million new shares vested from employee plans, and $86.9 million of stock-based compensation in 2025 faced $52.0 million of net income. Add rising churn of 5.2 percent and an AI risk the company wrote down itself. Not investment advice.
What Our Rating Means
Open questions
The business works in principle, but one material question is open. As long as it stays open, our findings do not carry a quality verdict.
The business clearly works: recurring revenue, $2.74 billion of remaining performance obligations, more than 1,200 institutions as customers, no single client above 10 percent of revenues, and a balance sheet that looked comfortable as of March 31, 2026, with $378.9 million of liquidity, an undrawn $125.0 million revolver and a 49 percent equity ratio. No substance risk is documented anywhere. What remains open is the operating core question: profitability is exactly one year old, part of the first-quarter margin jump came from expired amortization and higher capitalized implementation costs, churn rose to 5.2 percent in 2025, and most of the recent free cash went into offsetting the company's own employee stock plans. Hence yellow: a documented turn, an unproven durability. The decision is yours.
A journalistic assessment by our editorial team at the time of the deep dive, based on public sources — not investment advice and not a solicitation to buy or sell. Your personal circumstances (investment goals, risk capacity, taxes) cannot be taken into account. What our levels mean, how verdicts are formed, and what conflicts of interest exist →
Worth Noting
- Q2 Holdings reached our research list through our in-house stock scanner: the shares sit in the U.S. section of the Piotroski screen (F-Score 7 of 9; 16 U.S. hits as of July 26, 2026) and also among the turnaround candidates, the fallen angels, the power trend, Pros 80% and the Oliver Kell: Strength on Down Day screen. These lists are recalculated daily, and where scores tie the ordering is not stable.
- Name confusion: "Q2" here is the company name of the software provider from Austin, Texas, not shorthand for a second quarter. Through March 19, 2013, the company was named CBG Holdings, Inc.; the SEC file number CIK 0001410384 is authoritative. The stock is listed on the New York Stock Exchange and additionally on NYSE Texas.
- Valuation figures are dated and evergreen: the market value of roughly $2.8 billion (data as of July 24, 2026) was cross-checked against the share count from the quarterly report (62,600,423 shares as of April 29, 2026) and the price of roughly $43.48 per share documented in a Form 144 sale notice dated June 10, 2026; the deviation is about one percent. Analyses are evergreen; daily prices are not a buy argument.
Frequently Asked Questions
Q2 Holdings rents regional banks, credit unions and financial technology startups the software behind their online and mobile banking, along with fraud prevention, lending and the Helix banking-as-a-service platform. Customers pay a subscription. As of December 31, 2025, more than 1,200 financial institutions used at least one solution, with roughly 27.3 million end users registered on the digital banking platform.
The 2025 annual report puts it more carefully: the company says it has incurred losses from operations "in many periods" since its inception in 2005, reports net losses of $38.5 million and $65.4 million for 2024 and 2023, and net income of $52.0 million for 2025. The accumulated deficit still stood at $612.2 million as of December 31, 2025.
Because new shares appeared at the same time. Q2 repurchased and retired 1.765 million shares for $97.2 million in the first quarter of 2026. In the same quarter, 1.689 million shares vested from employee plans. On balance the count fell from 62.741 million to 62.665 million — 76,000 shares, or 0.12 percent.
Q2 issued $316.3 million of convertible notes in June 2019 with a 0.75 percent coupon, maturing June 1, 2026. After a partial repurchase in 2023, $304.0 million remained outstanding as of March 31, 2026. The conversion price of $88.61 sat far above the share price and the if-converted value did not exceed principal, so the notes had to be repaid in cash. Against that stood $378.9 million of liquidity and an undrawn $125.0 million revolver.
Remarkably little. The quarterly report as of March 31, 2026, states that no individual customer accounted for 10 percent or more of revenues in that quarter or the prior-year quarter, and none for 10 percent or more of accounts receivable. The risk lies less in one big client than in churn, which rose to 5.2 percent in 2025 from 4.4 percent in 2024.
The filings give no answer, but they do give hints. The 2025 annual report names AI-enabled offerings as potential demand and pricing pressure on the business. Add rising churn and the observation that $97.2 million of buybacks removed a net 76,000 shares. Relative strength stood at 9 out of 99 as of the July 24, 2026, data cut-off.
The F-Score is a nine-point test of the health of the books: profit, cash flow, quality of earnings, leverage, liquidity, share issuance, margin and asset turns. Seven points is good but not spotless — a genuinely healthy company sits at 8 or 9. The score says nothing about the price of the stock and nothing about entry timing.
The shares trade under the symbol QTWO on the New York Stock Exchange and additionally on NYSE Texas. The name is a trap: "Q2" here means the company from Austin, Texas, not the second quarter of a year. Through March 19, 2013, the company was named CBG Holdings, Inc.; the SEC files it under CIK 0001410384.
Found an error?
Did you spot a factual error, an outdated number, or a typo in this deep dive? Let us know briefly — your report goes straight to the editorial team.