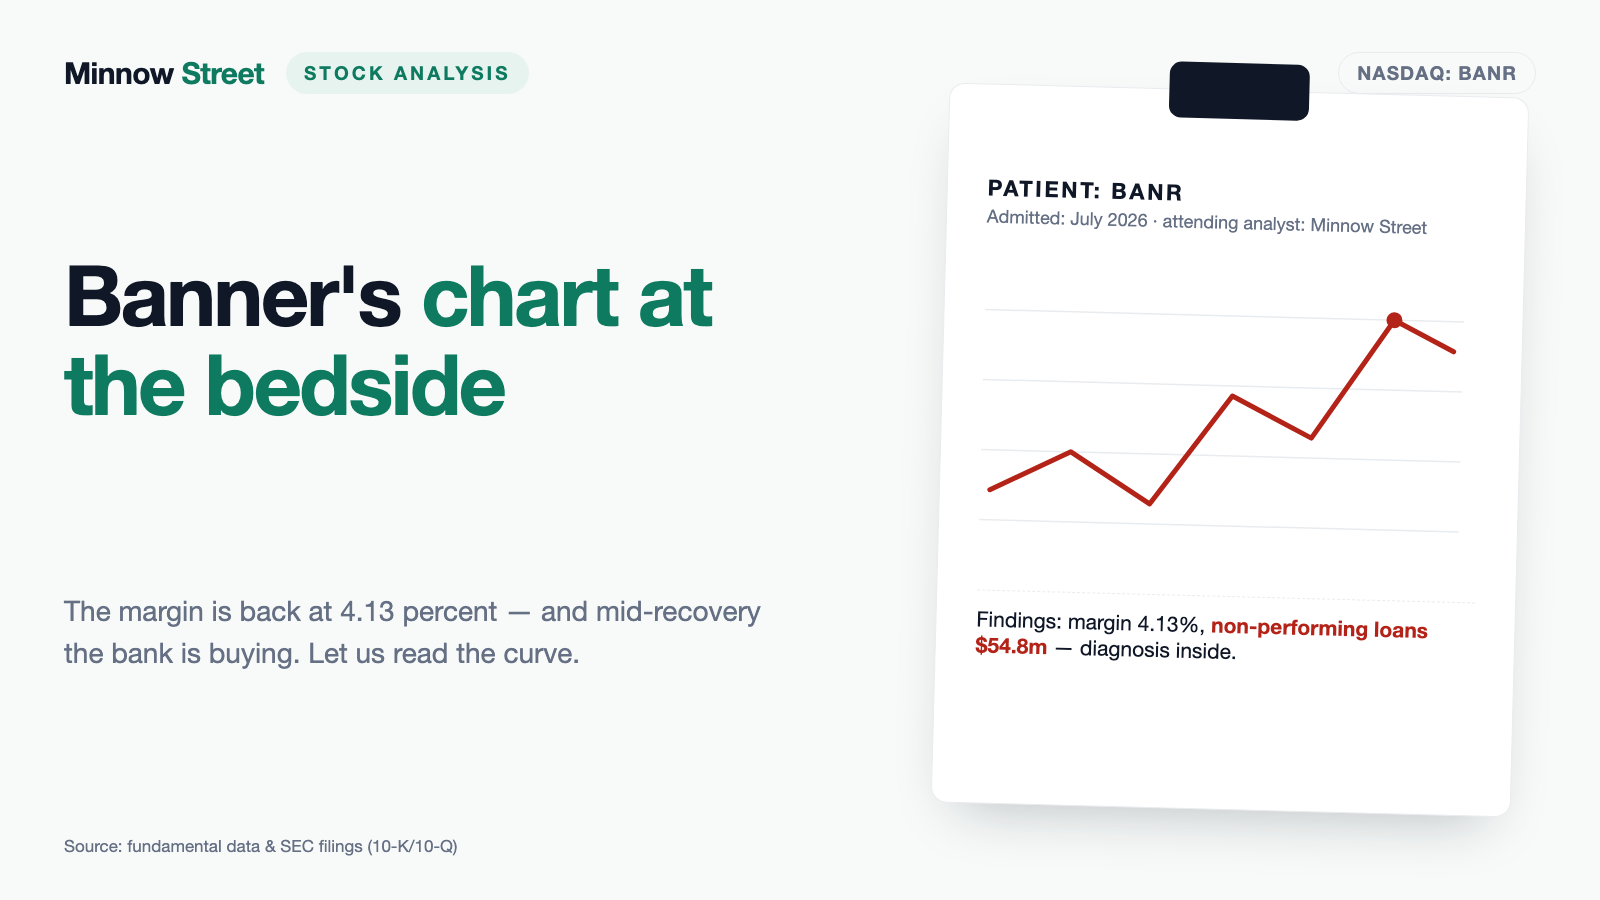
Banner Corporation: The Margin Is Back at 4.13 Percent — and Mid-Recovery the Bank Is Buying Its Neighbor
Banner Bank of Walla Walla is earning again: net interest margin up from 3.75 percent in 2024 to 4.13 percent in the second quarter of 2026, and 2025 net income up to $195.4 million. Our turnaround scanner put the stock on our research list on the morning of July 25, 2026 — and dropped it again the same evening, because the mandatory Altman Z score barely works on a bank balance sheet. Yet in the middle of that recovery, on April 30, 2026, the bank signed an acquisition that costs up to 2,699,587 new shares — and that gets decided on August 12, 2026. We read the filings before the votes are counted.
 Thomas Mücke
Founder & Publisher
Thomas Mücke
Founder & Publisher
Chart
Interactive price chart (TradingView).
Note: pure fact-based analysis, not investment advice and not a solicitation to buy or sell. All figures without guarantee.
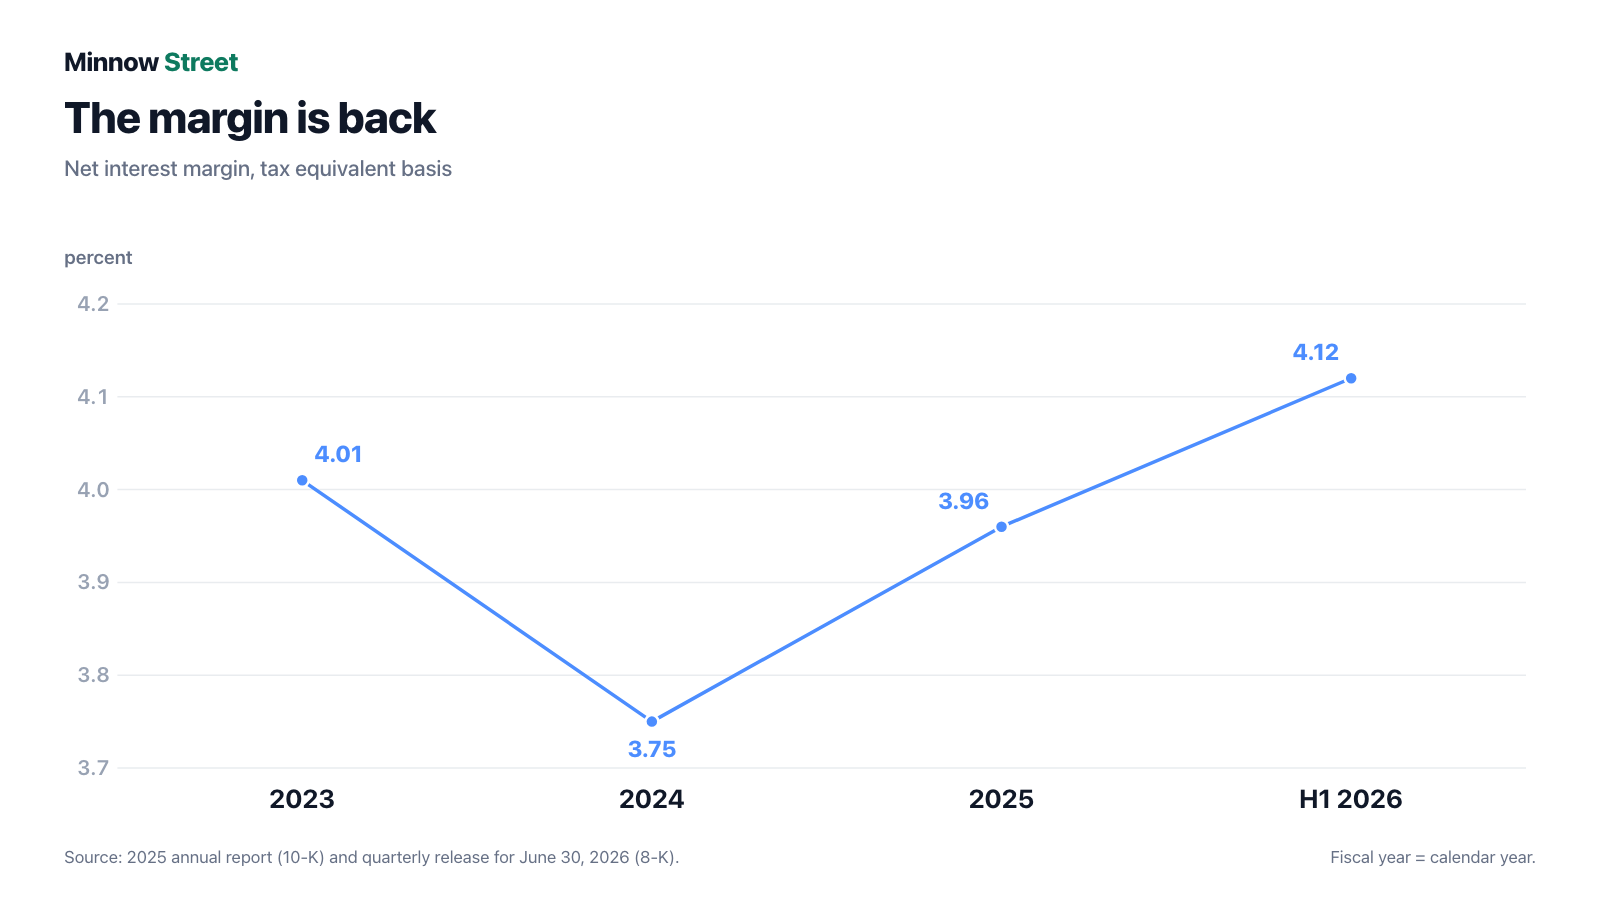
There is one investor trap that feels distinctly pleasant: the recovery trap. It works like this. You see a metric that fell for two years and is now rising again. Within seconds your head turns that into a story: "The patient is well again." What you do not ask in that moment is: who actually cured him — himself, or the weather? That is exactly the question at Banner Corporation (NASDAQ: BANR) of Walla Walla, Washington. The bank's net interest margin fell from 4.01 percent to 3.75 percent and now stands at 4.13 percent. Net income fell and rose to the same beat. So let us make a deal: before you attach the label "recovered", we read together what the bank itself told the U.S. securities regulator, the SEC — the annual report (10-K) for 2025, the quarterly report (10-Q) for March 31, 2026 and the earnings release for June 30, 2026. An SEC filing is honest under penalty of law. And this one describes a real recovery, a borrowed engine, an unrealized loss buried in equity — and an acquisition that gets decided on August 12, 2026.
What Banner actually does — a bank you can touch
Banner Corporation is the holding company for Banner Bank, a Washington state-chartered commercial bank that has been around for more than 135 years. No investment house, no crypto platform, no fintech: 135 branches in Washington, Oregon, Idaho and California, 1,943 full-time equivalent staff as of December 31, 2025, with 56 percent of the workforce in Washington State alone. Management calls the strategy the "super community bank model" — big enough for corporate clients, small enough that the branch manager knows the baker.
Bank metrics work differently from factory metrics, so here are the four terms you need for the rest of this piece:
- Net interest income — what the bank earns in interest minus what it pays in interest. That is its trading spread. For Banner it was $153.7 million in the second quarter of 2026 ($202.7 million of interest income less $48.9 million of interest expense).
- Net interest margin — that spread measured against interest-earning assets. Translated: what does the bank make on every dollar it puts to work? In the second quarter of 2026 it was 4.13 percent on a tax equivalent basis. For a U.S. regional bank that is a good number; the industry tends to sit closer to three or three and a half percent.
- Provision for credit losses — money set aside because the bank expects loans to sour. It reduces earnings before anything actually defaults. In the second quarter of 2026 it was $3.8 million.
- Core deposits — checking accounts, savings, money market balances: everyday client money that is cheap and mostly stays put. The opposite is certificates of deposit, which wander to the next best rate. At Banner, 89 percent of deposits are core deposits as of June 30, 2026 — the single strongest figure on the balance sheet.
The magnitudes as of June 30, 2026: $16.59 billion of total assets, $11.99 billion of loans ($11.83 billion net), $13.79 billion of deposits and $2.00 billion of common equity. The loan book splits into commercial real estate ($4.14 billion), commercial business loans ($2.58 billion), multifamily real estate ($855.9 million) and consumer loans ($827.0 million). And that brings us to the central tension of this analysis, which runs through every chapter: Banner's recovery is real and documented in figures — but its engine is the rate cycle, not a better business. And precisely now the bank is tying itself to an acquisition that dilutes it by just under 8 percent.
How the stock landed on our desk — and what the scanner really sees
We run roughly 3,500 stocks through our scanners every day. Banner reached our research list through the turnaround scanner: on the morning of July 25, 2026 it stood at rank 13 of the U.S. selection (62 hits), with a turnaround check of 7 out of 8 points. The model has four pillars: a drawdown of at least 50 percent from the all-time high, a balance sheet strong enough to survive the dry spell, four points for the operating turn (revenue direction, margin, cash flow, balance sheet healing) and four points for market confirmation (price above the 50-day line, relative strength, insider buying, institutional accumulation). The first two pillars are mandatory; a stock is listed only if it clears them and also scores at least 6 of the 8 points.
Open that scanner today, however, and Banner is no longer in it. On the evening of July 25, 2026, a few hours after we pulled the stock, the recomputation threw it off the list — which has shown 61 hits instead of 62 ever since. The turnaround check is not the reason; it still stands at 7 of 8 points. It is the second mandatory pillar, "survival secured": it requires an Altman Z score of at least 1.1, and the data set reports -0.74 for Banner. We are deliberately leaving that contradiction in and explaining it rather than tidying it away — it is the most instructive passage in this chapter.
The Altman Z score was developed in 1968 as a bankruptcy early-warning system for manufacturing companies. It works with quantities such as working capital and retained earnings relative to total assets — quantities a bank balance sheet simply does not have: at Banner the assets are almost entirely loans and securities, the liabilities almost entirely deposits. In that model nearly every bank ends up in the danger zone, regardless of its actual condition. And Banner's actual condition is solid: an 11.9 percent equity ratio, a common equity tier 1 ratio of 12.82 percent and a total capital ratio of 14.67 percent — "well capitalized" under U.S. banking rules (June 30, 2026). The lesson: a metric is only valid for the kind of balance sheet it was built for — and a scanner is an invitation to research, not a verdict. Banner does still appear in two of our other lists, "Benjamin Graham: Defensive Investor" and "David Dreman: Contrarian" (as of July 25, 2026). To repeat it yourself: open the scanner, set the country filter to "US", sort by the turnaround check column — these lists are recalculated daily, so a ranking is a dated snapshot and not a property of the company. Banner is the case in point.
That leaves the turnaround check itself — and it deserves an honest reading too, because 7 out of 8 sounds like more than it is. Seven of eight means seven ticks on a checklist that measures direction, not condition. A point for "the margin is rising again" says nothing about whether it is high enough. And the first pillar, the drawdown, lies far in the past at Banner: as of July 25, 2026 the stock trades just 2.95 percent below its 52-week high ($72.43 on July 16, 2026) and 21.04 percent above its 52-week low ($58.07 on March 20, 2026). The scanner is not looking at a fresh wound but at an old scar — the collapse of U.S. regional banks in the financial crisis, after which Banner did a one-for-seven reverse split in June 2011. Remember the principle: a turnaround scanner finds companies that are recovering; it does not tell you how much of the recovery is already in the price. For how quickly a healthy-looking set of bank metrics can hide an unusual mechanism, see our piece on Pathward Financial, where a 7.3 percent interest margin rested on deposits the bank does not own.
The numbers across the years — honestly credited
First what genuinely speaks for Banner, and there is plenty. The bank has been profitable in every single year, including the bad one. It has paid a dividend every quarter. And it came through the hardest stretch U.S. regional banks have faced since 2008 without an equity raise, without a fire sale and without suspending the payout.
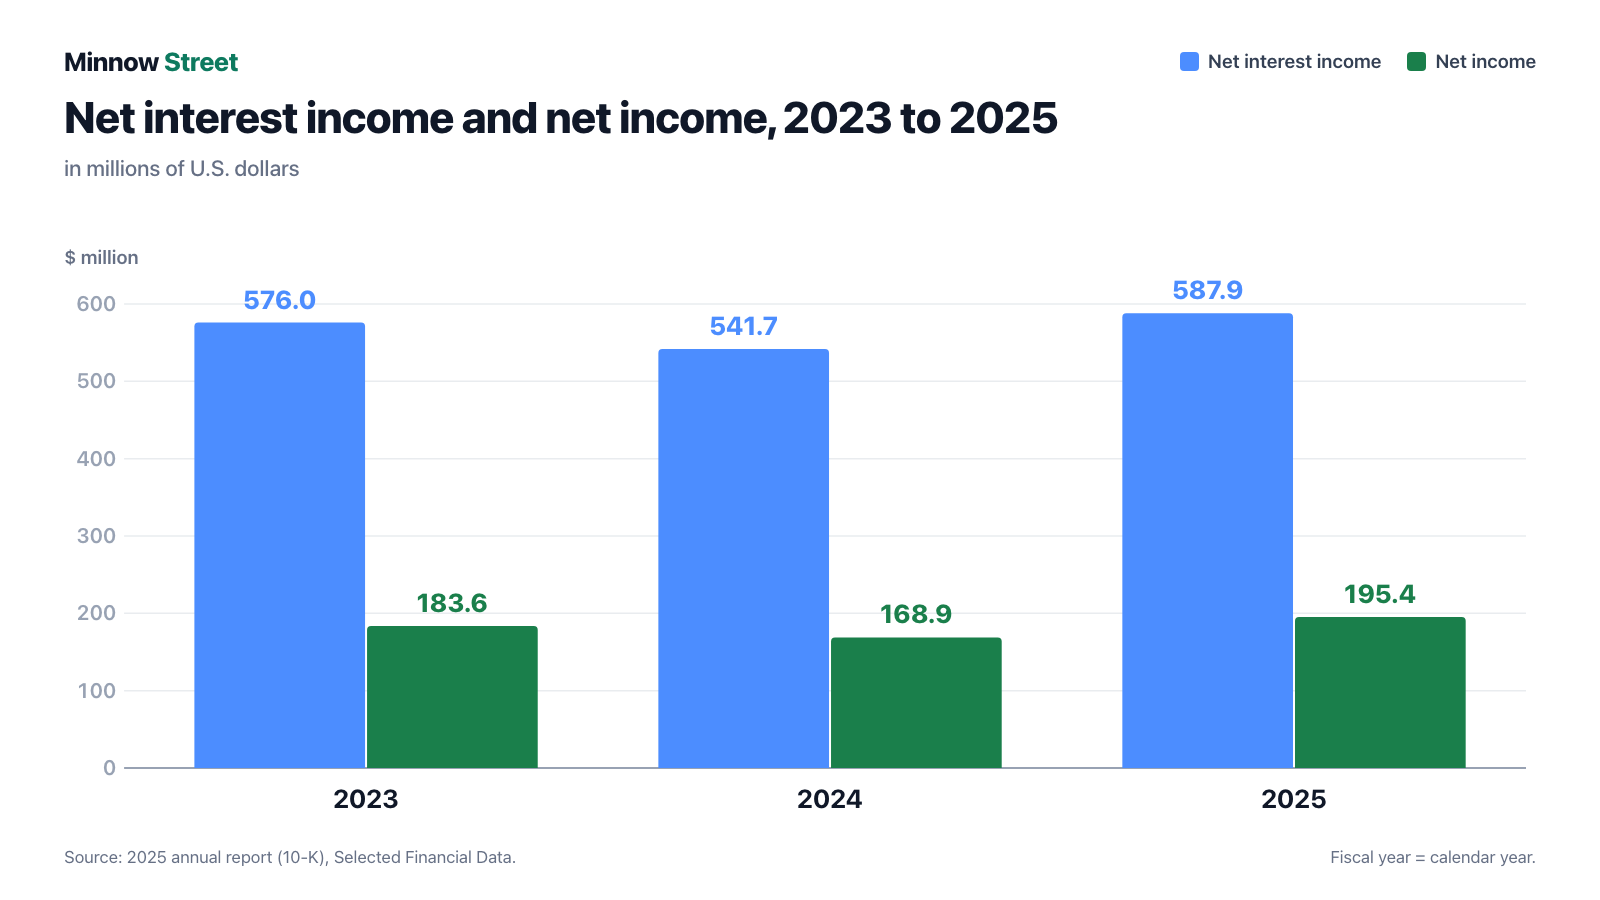
The ratios behind it, all from the 2025 annual report: return on average common equity was 11.94 percent (2023), 9.91 percent (2024) and 10.51 percent (2025). Return on average assets was 1.18, 1.07 and 1.21 percent. Put in context: a regional bank earning more than 1.0 percent on assets is doing fine; above 1.2 percent is good. Banner sits at 1.21 percent for 2025 and 1.20 percent in the second quarter of 2026 — solid, not spectacular. The efficiency ratio, meaning how many cents of expense one dollar of revenue costs, improved from 64.33 percent (2024) to 61.87 percent (2025). Again: fine. Genuinely efficient regional banks operate at 50 to 55 percent.
And capital is abundant. As of June 30, 2026 the common equity Tier 1 ratio stood at 12.82 percent, total capital at 14.67 percent and the Tier 1 leverage ratio at 11.79 percent — comfortably above the thresholds regulators use for the "well capitalized" label. Translated: Banner has buffer. For a regional bank that is the single most important statement there is, because what knocked over several U.S. institutions in 2023 was not bad business but thin capital against large unrealized losses.
Quarter by quarter the path looked like this: $45.1 million of net income (first quarter of 2025), $45.5 million (second), $53.5 million (third), $51.2 million (fourth), $54.7 million (first quarter of 2026) — and then $48.9 million in the second quarter of 2026. That last number is why we now open the uncomfortable truths.
What the filings say — the uncomfortable truths
Uncomfortable truth No. 1: the engine of the turn is the rate cycle, not management
Look at what actually happened between 2023 and 2025 — not at net income, but one level below it:
Interest income rose from $701.6 million (2023) through $766.1 million (2024) to $805.0 million (2025) — a calm, even climb. Interest expense, by contrast, exploded: from $125.6 million (2023) to $224.4 million (2024), up 79 percent in a single year, before easing to $217.0 million (2025). That jump is the 2024 trough. It has nothing to do with Banner: after the Federal Reserve raised rates, every regional bank suddenly had to pay for deposits that had previously cost almost nothing.
And the recovery comes from the same direction. Total deposit costs fell from 1.47 percent (second quarter of 2025) to 1.33 percent (second quarter of 2026), and the average rate paid on borrowings from 4.47 percent to 3.88 percent. The yield on the asset side was essentially unchanged over the same span — 5.40 against 5.41 percent. Translated: Banner earns more today because money has become cheaper, not because loans pay better. That is not a criticism of management, but it is a warning for the forecast: if the rate cycle turns again, the margin turns with it. Keep this in mind for the rest of the analysis: buying a regional bank always means buying a view on interest rates.
Uncomfortable truth No. 2: the second quarter of 2026 was weaker than the first
The headline of the July 22, 2026 release read $48.9 million of net income, $1.43 per diluted share. Against the year-earlier quarter ($45.5 million, $1.31) that is a 7.5 percent gain. Against the preceding quarter ($54.7 million, $1.60) it is a 10.7 percent decline. Three items explain the drop, and none of them is the margin — that actually rose from 4.11 percent to 4.13 percent:
- The credit provision swung by $4.6 million. In the first quarter of 2026 Banner released $796,000 (income); in the second it provided $3.8 million (expense).
- Non-interest expense rose by $5.4 million, from $102.6 million to $108.0 million — including $2.0 million more for information and computer data services (with a $924,000 write-off of the previous commercial loan origination software), $1.7 million more in salaries and benefits, $1.3 million more in advertising and $238,000 of merger-related expense.
- Non-interest income fell from $19.2 million to $18.2 million, mainly through a $1.8 million unfavorable shift in fair value adjustments.
The result: the efficiency ratio rose from 60.60 percent to 62.80 percent, and return on average assets fell from 1.37 percent to 1.20 percent. Banner's turn rests on the margin, not on the cost line — and the cost line pushed back in the second quarter of 2026.
Uncomfortable truth No. 3: $209.5 million of unrealized loss sits inside equity
Now the item most 2026-vintage bank balance sheets carry and few investors examine: accumulated other comprehensive loss. Behind it sit bonds the bank bought before rates rose and that have fallen in price since. As long as they are held, the loss stays on paper; if the bank sells them, it becomes real.
As of June 30, 2026 that item stood at negative $209.5 million, after negative $210.9 million (March 31, 2026), negative $208.0 million (December 31, 2025) and negative $244.4 million (June 30, 2025). It is shrinking — but slowly. Measured against $2.00 billion of common equity, that is a good tenth. Put differently: strip it out and equity would be 10.5 percent smaller. The average effective duration of the securities portfolio was 6.1 years as of June 30, 2026, down from 6.6 years a year earlier — the rule of thumb for how strongly the portfolio reacts to rate moves: roughly 6 percent of price movement per percentage point, in either direction.
Why this is still not an alarm: Banner does not need to sell those bonds. Deposits are stable (89 percent core), and liquidity reserves are large — $3.45 billion of additional borrowing capacity at the Federal Home Loan Bank and $1.64 billion at the Federal Reserve, plus $125.0 million of federal funds lines with other institutions as of June 30, 2026. That combination is exactly what the institutions that failed in 2023 lacked. Remember: an unrealized loss only turns dangerous when a bank is forced to realize it.
Uncomfortable truth No. 4: bad loans are growing faster than the reserve
Credit quality at Banner is still good — but not as good as a year ago, and the bank says so plainly:
"Coverage of non-performing loans remained strong at 295% at June 30, 2026, compared to 353% at March 31, 2026. The year-over-year decline from 373% at June 30, 2025 reflects a moderate increase in non-performing loans over the past year, while the allowance level has remained stable and commensurate with the portfolio's risk profile."
— Banner Corporation, Form 8-K of July 22, 2026, Exhibit 99.1, "Credit Quality"

In plain terms: non-performing loans rose from $43.0 million (June 30, 2025) through $45.4 million (March 31, 2026) to $54.8 million (June 30, 2026) — up 27 percent year over year. The allowance stayed almost unchanged at $161.8 million, or 1.35 percent of loans. That is why coverage fell from 373 percent to 295 percent. Total non-performing assets rose from $49.8 million to $60.5 million, or 0.36 percent of total assets.
Honesty requires the counter-check, and it is reassuring. Substandard loans — the step before default — fell from $235.0 million to $218.4 million in the same quarter. And actual net charge-offs in the second quarter of 2026 came to just $101,000, after $1.2 million in the prior quarter. Translated: more loans are sliding onto the watch list, but almost nothing is actually failing. In context: 0.36 percent of non-performing assets is a very good level — for a regional bank it only turns uncomfortable somewhere above 1 percent. Watching is still warranted, because 295 percent coverage is the point at which further deterioration costs money: if non-performing loans keep rising, the allowance has to rise with them, and that comes straight out of earnings.
Uncomfortable truth No. 5: the merger dilutes by just under 8 percent — and hangs on a vote
On April 30, 2026 Banner signed a merger agreement with Pacific Financial Corporation (OTCQX: PFLC) of Aberdeen, Washington, the holding company for the 55-year-old Bank of the Pacific. The key figures from the joint release: 18 branches and offices across western Washington and northern Oregon, $1.29 billion of assets, $762 million of loans and $1.14 billion of deposits, each as of March 31, 2026. Payment is entirely in stock: 0.2633 Banner shares per Pacific Financial share. Based on Banner's closing price on April 29, 2026 ($66.25), that implied $17.44 per share, or roughly $177 million in aggregate. Pacific Financial holders are expected to own about 7 percent of the combined company, which would carry roughly $18 billion of assets.
What that means for you as a Banner shareholder sits in the filing fee table to the Form S-4 of June 3, 2026: Banner registered up to 2,699,587 new shares there, calculated from a maximum of 10,252,895 Pacific Financial shares times 0.2633. Against 33,984,909 Banner shares outstanding on June 30, 2026, that is 7.9 percent of dilution — your slice of the pie shrinks by just under one thirteenth. In return, Banner expects the deal to add to earnings per share from 2027, excluding one-time transaction expenses.
The deal is not done, though, and the conditions are unusually specific:
"Banner's obligation to complete the Merger is also subject to the condition that Pacific Financial's Adjusted Equity (as defined in the Merger Agreement), as calculated 10 business days prior to the anticipated closing, be equal to or greater than $124,269,000, which was its Adjusted Equity as of March 31, 2026, and that holders of less than 10% of the outstanding shares of Pacific Financial Common Stock shall have exercised their dissenters' rights."
— Banner Corporation, Form 8-K of May 1, 2026, Item 1.01
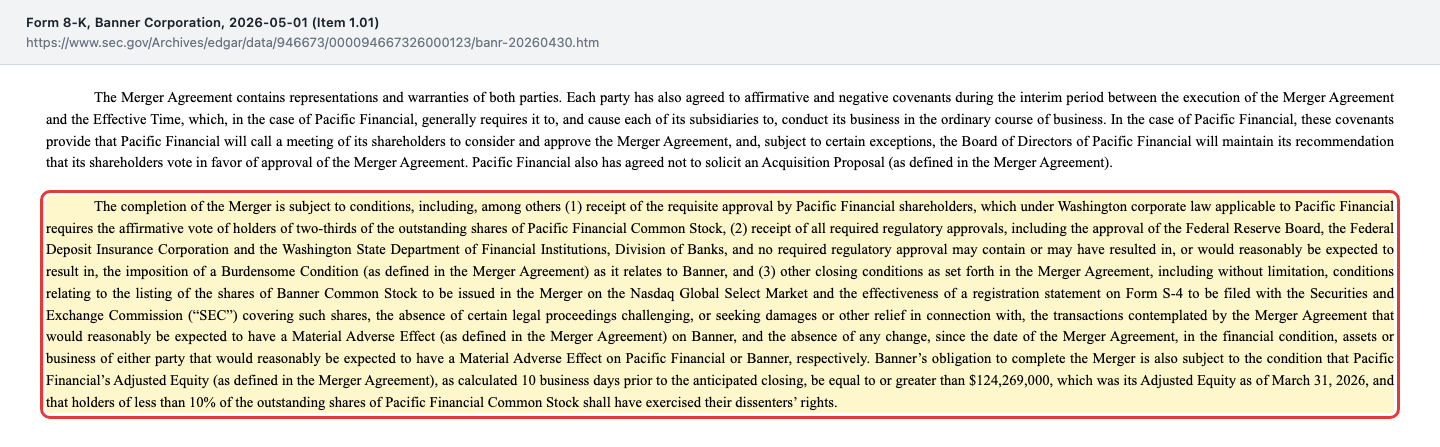
On top of that come approvals from the Federal Reserve Board, the Federal Deposit Insurance Corporation and the Washington State Department of Financial Institutions, Division of Banks — and the affirmative vote of two-thirds of all outstanding Pacific Financial shares. If Pacific Financial walks away to accept a better offer, a $6.3 million termination fee falls due. The target's directors and executive officers have contractually committed to vote their own shares in favor.
And the date is set. On July 20, 2026 Banner wrote directly to the Pacific Financial shareholders who had not yet voted:
"According to our latest records, we have not received your voting instructions for the Special Meeting of Shareholders of Pacific Financial Corporation, which is to be held on Wednesday, August 12, 2026. Please note that failing to vote will have the same effect as a vote against the proposed merger."
— Banner Corporation / Pacific Financial Corporation, Form 425 of July 20, 2026

Such a letter is routine — and still a piece of information. It shows that as of that date the parties were still gathering votes and that adjourning the meeting was explicitly on the table. For you it simply means this: August 12, 2026 is a date on which something gets decided for Banner.
What Banner itself writes about artificial intelligence
A brief look at a topic banks rarely address honestly. In its 2025 annual report Banner names artificial intelligence not as an opportunity but twice as competitive pressure — once in the competition section, once as a risk factor of its own:
"In addition, new technological developments, including the development and use of generative and agentic artificial intelligence, are rapidly evolving; we expect these technologies will continue to impact the competitive landscape, possibly to an increasing extent."
— Banner Corporation, SEC annual report 10-K for 2025, Item 1 "Competition"

The dedicated risk factor is blunter still: "If our competitors gain an advantage by using such technologies, our ability to compete effectively and our results of operations could be adversely impacted." That is why our AI rating files Banner under "threatened": the bank sells no AI and reports no AI revenue, yet names the technology itself as pressure on its core business — gathering deposits and making loans.
Valuation — what you pay for this bank
No daily prices, only dated magnitudes. As of July 25, 2026 the market capitalization is roughly $2.4 billion. We cross-checked that against the 33,984,909 shares outstanding and the last closing price documented in an SEC filing ($66.25 on April 29, 2026), which gives $2.25 billion — a gap of roughly 6 percent, which is not material.
Three ratios follow from it:
- Price-to-earnings roughly 11.4 on trailing twelve-month earnings of $6.19 per share. For a regional bank returning 1.2 percent on assets, that is neither cheap nor expensive — it is normal.
- Price-to-book roughly 1.17 on book value of $58.83 per share (June 30, 2026). On tangible book value of $47.82 — that is, after deducting the $373.1 million of goodwill from earlier acquisitions — it is roughly 1.4. That is the more honest number, because goodwill is not capital that absorbs losses.
- Dividend yield roughly 3 percent on the quarterly dividend of $0.52 (payable August 14, 2026 to holders of record on August 4, 2026), or $2.08 a year. The payout ratio was 34.2 percent of earnings in 2025 — plenty of headroom.
The professional view: five analyst firms cover the stock (two strong buy, one buy, two hold) with an average price target of $73.67 (data as of July 25, 2026). That is not far above where the stock already trades — the professionals largely regard the recovery as paid for.
Opportunities and risks at a glance
What speaks for Banner:
- Very stable funding: core deposits make up 89 percent of $13.79 billion, total deposit costs are only 1.33 percent (second quarter of 2026), and unused liquidity lines total roughly $5.2 billion.
- A thick capital cushion: common equity Tier 1 of 12.82 percent and total capital of 14.67 percent as of June 30, 2026 — far above regulatory thresholds.
- Very low actual losses: $101,000 of net charge-offs in the second quarter of 2026, non-performing assets at 0.36 percent of total assets.
- Loan growth without price concessions: $1.26 billion of loan originations in the second quarter of 2026 against $863.2 million in the prior quarter, at essentially unchanged loan yields.
- The acquisition brings a $1.14 billion deposit base in regions Banner wants to grow in anyway and is expected to add to earnings per share from 2027.
What speaks against it:
- The engine of the turn is the rate cycle: the margin rose because deposits got cheaper, not because loans pay more. That can reverse.
- Up to 2,699,587 new shares for the acquisition — 7.9 percent of dilution — with closing dependent on a vote on August 12, 2026 plus three regulators.
- $209.5 million of unrealized loss inside equity as of June 30, 2026, roughly a tenth of common equity, at a securities duration of 6.1 years.
- Non-performing loans up 27 percent year over year, with coverage down from 373 percent to 295 percent.
- Costs are running: non-interest expense of $108.0 million in the second quarter of 2026 and an efficiency ratio back at 62.80 percent — plus integration costs that have not yet been quantified.
- Commercial real estate concentration: $4.14 billion, or 35 percent of the loan book as of June 30, 2026 — a segment under heightened regulatory attention since 2023.
A human verdict
Back to the recovery trap from the opening. The patient in this chart really is getting better: the margin is rising, earnings are rising, capital is thick, deposits are loyal. Anyone who looked in 2024 and kept their nerve was proved right. Except — and this is the whole difference — a large part of the cure was the weather. Rates fell, deposits got cheaper, and the margin came back. Banner did nothing wrong; the bank came through the stretch with discipline. But it did not turn things around on its own strength alone.
And now it is adding a second task: an acquisition costing just under 8 percent of its own shares, whose closing depends on a vote on August 12, 2026, and whose integration will absorb money and attention — in precisely the year when the cost ratio is drifting up anyway. That can end well. U.S. regional banks have been consolidating for years, and whoever buys the neighbor instead of being bought gets a say in the outcome.
What you make of it is your decision. And that is exactly as it should be.
Sources
- Banner Corporation, SEC annual report 10-K for 2025 (filed February 25, 2026; Item 1 Business and Competition, Item 1A Risk Factors, Item 5, Selected Financial Data, consolidated financial statements)
- Banner Corporation, SEC quarterly report 10-Q for March 31, 2026 (filed May 5, 2026; balance sheet, statement of changes in equity, Note 14 "Subsequent Event", Part II Item 2)
- Banner Corporation, SEC Form 8-K of May 1, 2026 (Item 1.01, merger agreement with Pacific Financial Corporation)
- Joint press release of Banner and Pacific Financial, April 30, 2026 (Exhibit 99.1 to the Form 8-K)
- Filing fee table to the SEC Form S-4 registration statement of June 3, 2026 (Exhibit 107: up to 2,699,587 new Banner shares)
- SEC Form 425 of July 20, 2026 (proxy solicitation for the special meeting on August 12, 2026)
- Banner Corporation, earnings release for June 30, 2026 (Exhibit 99.1 to the SEC Form 8-K of July 22, 2026)
- All SEC filings of Banner Corporation (CIK 0000946673)
- Fundamental data (valuation ratios, analyst consensus, 52-week price range; data as of July 25, 2026)
This analysis is journalistic commentary on publicly available company filings. It is not investment advice, not a recommendation to buy or sell, and not a solicitation to buy or sell securities. Stocks can lose substantial value, up to and including the total loss of the capital invested. All figures come from the sources named above and carry the as-of dates stated there; they may have changed since. The author holds no position in the stock discussed at the time of publication.
Our Bottom Line at a Glance
- Funding & capital positive
- Core deposits make up 89 percent of $13.79 billion, and total deposit costs were 1.33 percent in the second quarter of 2026 against 1.47 percent a year earlier. Common equity Tier 1 of 12.82 percent and total capital of 14.67 percent as of June 30, 2026 sit far above regulatory thresholds; unused liquidity lines total roughly $5.2 billion.
- Earnings recovery positive
- Net interest margin rose from 3.75 percent (2024) through 3.96 percent (2025) to 4.13 percent in the second quarter of 2026, and annual net income from $168.9 million to $195.4 million. Return on average assets was 1.21 percent in 2025 — a good level for a regional bank.
- Quality of the turn neutral
- The engine is the rate cycle: interest expense jumped from $125.6 million to $224.4 million in 2024 and has been falling since, while the yield on interest-earning assets was essentially flat between the second quarter of 2025 and the second quarter of 2026 at 5.40 and 5.41 percent. The cost line moved against the bank most recently: non-interest expense of $108.0 million and an efficiency ratio of 62.80 percent in the second quarter of 2026, after $102.6 million and 60.60 percent in the prior quarter.
- Credit quality neutral
- Non-performing loans rose from $43.0 million to $54.8 million over twelve months, and allowance coverage fell from 373 percent to 295 percent as of June 30, 2026. Working the other way, substandard loans fell from $235.0 million to $218.4 million, and net charge-offs in the quarter came to just $101,000. Non-performing assets stand at 0.36 percent of total assets.
- Merger & dilution negative
- Up to 2,699,587 new shares are registered for the Pacific Financial Corporation acquisition agreed on April 30, 2026 — 7.9 percent of the 33,984,909 shares outstanding on June 30, 2026. Closing depends on a two-thirds vote of target shareholders on August 12, 2026, on approvals from the Federal Reserve, the FDIC and the Washington State Division of Banks, and on an adjusted equity floor of $124,269,000; the termination fee is $6.3 million.
- Unrealized losses & rate risk negative
- Equity carried $209.5 million of accumulated unrealized losses as of June 30, 2026 — a good tenth of the $2.00 billion of common equity. The effective duration of the securities portfolio is 6.1 years. On top of that, the bank took $320.0 million of Federal Home Loan Bank advances at an average 3.88 percent during the second quarter of 2026, after carrying none at March 31, 2026.
Banner Corporation is the recovery trap in its purest form: the rebound is real and documented in every figure — net interest margin from 3.75 percent (2024) to 4.13 percent in the second quarter of 2026, annual net income from $168.9 million to $195.4 million, common equity Tier 1 of 12.82 percent, 89 percent core deposits. But its engine is the rate cycle, not a better business: interest expense is falling while the loan yield stands still. And mid-recovery Banner is acquiring Pacific Financial Corporation for up to 2,699,587 new shares — 7.9 percent of dilution, decided on August 12, 2026. Add $209.5 million of unrealized losses inside equity and non-performing loans up 27 percent over twelve months. Not investment advice.
What Our Rating Means
Open questions
The business works in principle, but one material question is open. As long as it stays open, our findings do not carry a quality verdict.
Buying today means buying a solid, thickly capitalized regional bank at 1.17 times book value — and at the same time two open questions, each with a date attached. First: does the merger clear the vote on August 12, 2026, and what does integration cost? Second: does the margin hold once deposits stop getting cheaper? Watching here means checking the next filings for three numbers. What is the net interest margin (Q2 2026: 4.13 percent)? Where do non-performing loans and their coverage stand ($54.8 million, 295 percent)? And do Federal Home Loan Bank advances still sit at $320.0 million, or back at zero? Anyone here for the $2.08 annual dividend will find it well cushioned at a payout ratio of just 34.2 percent. The decision is yours.
A journalistic assessment by our editorial team at the time of the deep dive, based on public sources — not investment advice and not a solicitation to buy or sell. Your personal circumstances (investment goals, risk capacity, taxes) cannot be taken into account. What our levels mean, how verdicts are formed, and what conflicts of interest exist →
Worth Noting
- Banner reached our research list through our in-house stock scanner "Turnaround Candidates": rank 13 in the U.S. selection (62 hits), turnaround check 7 of 8, on the morning of July 25, 2026. By the evening of that same day the stock had dropped out of this scanner, which has shown 61 hits since. The decisive factor was not the turnaround check, which still stands at 7 of 8, but the mandatory pillar "survival secured": it requires an Altman Z score of at least 1.1 while the data set reports -0.74 for Banner. The Altman Z was built for industrial balance sheets and says little about a bank — Banner has an 11.9 percent equity ratio, a 12.82 percent common equity tier 1 ratio and counts as "well capitalized" under U.S. banking rules. The stock does still appear in the "Benjamin Graham: Defensive Investor" and "David Dreman: Contrarian" scanners (as of July 25, 2026). Scanner lists are recalculated daily, so the ranking is a dated snapshot. The turnaround check measures the direction of metrics, not their level — seven of eight ticks say nothing about whether a metric is high enough.
- Bank metrics are not comparable to industrial metrics: a bank's "revenue" is the sum of net interest income and non-interest income ($172.0 million in the second quarter of 2026), not the $202.7 million of interest income. Gross margin, free cash flow or net debt have no meaningful equivalent at a lender; what matters is net interest margin, capital ratios, credit provisions and deposit mix.
- Data and recency: the most recent periodic report is the quarterly report (10-Q) for March 31, 2026, filed May 5, 2026. Every document filed after it was reviewed — the Form 8-K of May 22, 2026 (annual meeting), the Form S-4 registration statement of June 3, 2026 with its amendment of June 15, the notice of effectiveness of June 16, the 424B3 prospectus of June 17, the Form 425 of July 20 and the Form 8-K of July 22, 2026 with results for June 30, 2026. The share count comes from the most recent document naming one (33,984,909 as of June 30, 2026). Valuation figures are magnitudes as of July 25, 2026, not daily prices.
Frequently Asked Questions
Banner Corporation is the holding company for Banner Bank, a commercial bank based in Walla Walla, Washington. It runs 135 branches across Washington, Oregon, Idaho and California and employed about 1,943 full-time equivalent staff as of December 31, 2025. As of June 30, 2026 it held $16.59 billion of total assets, $11.99 billion of loans and $13.79 billion of deposits. The business is classic banking: gather deposits, make loans.
Because the key metric for a bank has turned. Net interest margin fell from 4.01 percent (2023) to 3.75 percent (2024), then climbed through 3.96 percent (2025) to 4.13 percent in the second quarter of 2026. Net income followed: $183.6 million (2023), $168.9 million (2024), $195.4 million (2025). Our in-house stock scanner therefore ranked the stock 13th in the U.S. selection of its turnaround candidates on the morning of July 25, 2026, with a turnaround check of 7 out of 8 points. By that evening it had dropped out of the scanner — not because of the turnaround check, which still stands at 7 of 8, but because of the mandatory Altman Z score: the scanner requires at least 1.1, and the data set reports -0.74 for Banner. The Altman Z was built for industrial balance sheets and says little about a bank; with an 11.9 percent equity ratio and a 12.82 percent common equity tier 1 ratio, Banner is not a restructuring case.
On April 30, 2026 Banner agreed to buy Pacific Financial Corporation (OTCQX: PFLC), the holding company for Bank of the Pacific with $1.29 billion of assets. Payment is in stock: 0.2633 Banner shares per Pacific Financial share, roughly $177 million in aggregate. Target shareholders vote on August 12, 2026 and two-thirds of all outstanding shares must approve. Approvals from the Federal Reserve, the FDIC and the Washington State Division of Banks are also required. Closing is expected in the third quarter of 2026.
Banner has registered up to 2,699,587 new shares with the U.S. securities regulator, the SEC (filing fee table to the Form S-4 registration statement of June 3, 2026). Measured against the 33,984,909 shares outstanding on June 30, 2026, that is 7.9 percent. Pacific Financial holders are expected to own roughly 7 percent of the combined company. Banner expects the deal to add to earnings per share from 2027, excluding one-time transaction expenses.
Good, but not as good as a year ago. Non-performing loans rose from $43.0 million (June 30, 2025) to $54.8 million (June 30, 2026), and allowance coverage fell from 373 percent to 295 percent. Working the other way: substandard loans, the step before default, fell from $235.0 million to $218.4 million, and actual net charge-offs in the second quarter of 2026 came to just $101,000. Non-performing assets amount to 0.36 percent of total assets.
That is accumulated other comprehensive loss: bonds the bank bought before rates rose that have fallen in price since. As of June 30, 2026 the item stood at negative $209.5 million — a good tenth of the $2.00 billion of common equity. As long as the bank holds the securities, the loss stays on paper. The effective duration of the portfolio was 6.1 years as of June 30, 2026.
Yes. For the second quarter of 2026 the board declared $0.52 per share, payable August 14, 2026 to holders of record on August 4, 2026. Annualized that is $2.08. In 2025 Banner paid $1.94 per share in total, at a payout ratio of 34.2 percent of earnings.
Banner sells no AI and reports no AI revenue. In its 2025 annual report the bank names generative and agentic artificial intelligence twice as competitive pressure — in the competition section and as a risk factor of its own. It states there that if competitors gain an advantage through such technologies, its ability to compete and its results of operations could be adversely impacted. Our AI rating therefore files Banner under "threatened".
Found an error?
Did you spot a factual error, an outdated number, or a typo in this deep dive? Let us know briefly — your report goes straight to the editorial team.