F&G Annuities & Life: Free cash flow is bigger than the market value — but it does not belong to shareholders
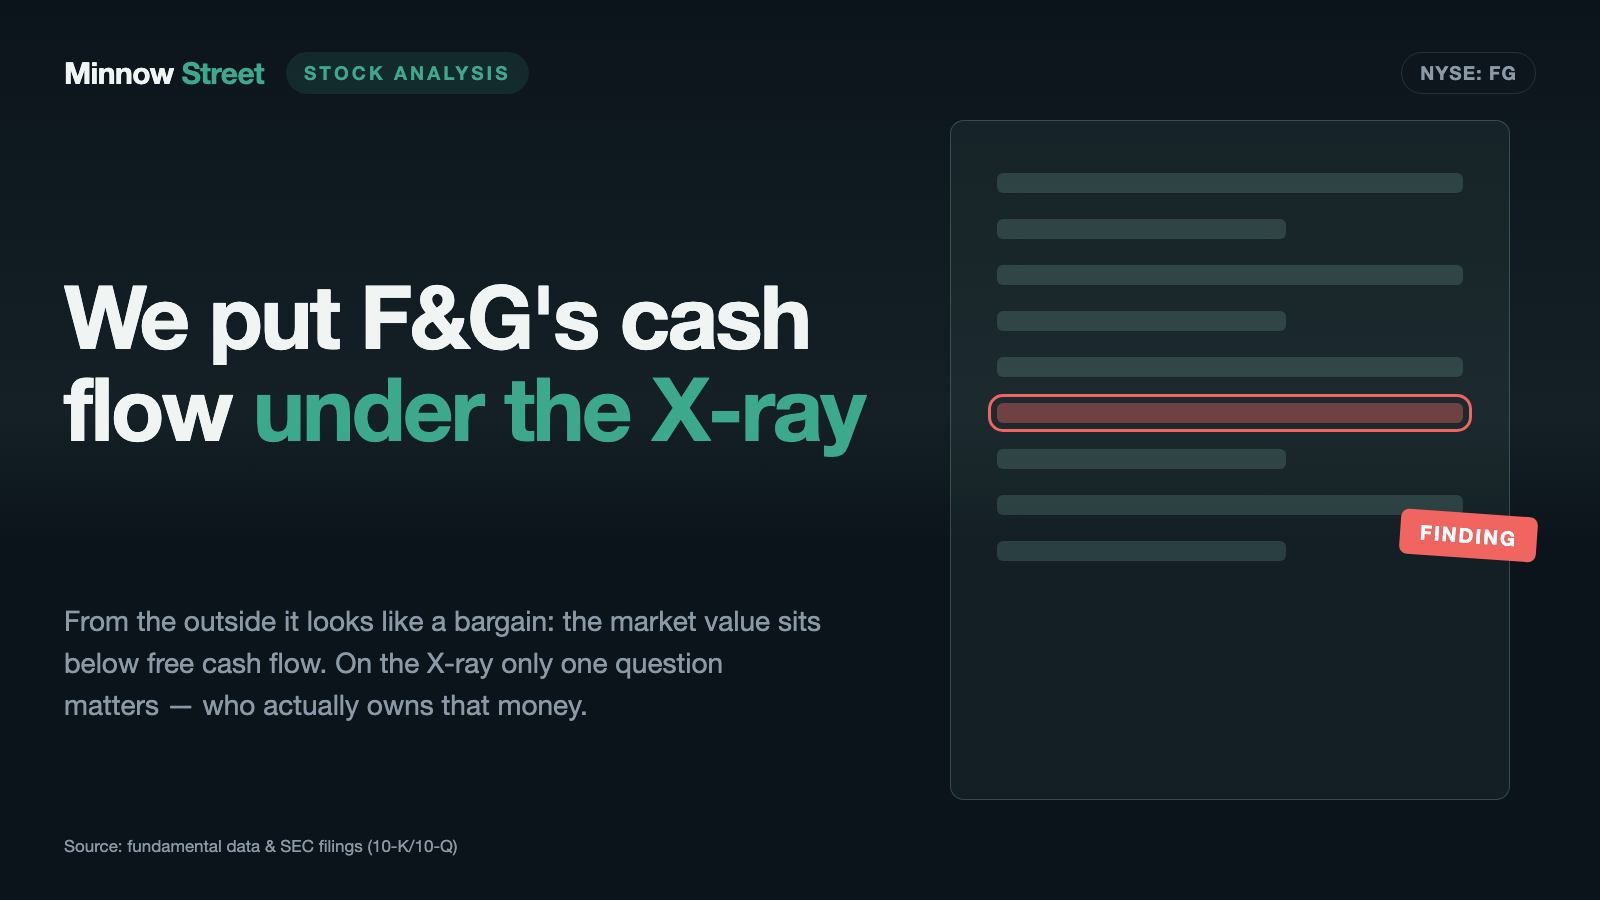
On paper it is the cheapest stock in sight: F&G Annuities & Life carries a market value of roughly $3.93 billion and reported free cash flow of $4,666 million for 2025. A price-to-free-cash-flow ratio below one — the company arithmetically earns its own price in less than a year. The statement of cash flows in its annual report to the U.S. securities regulator, the SEC, shows where the money comes from: $3,277 million from the change in funds withheld from reinsurers, $1,710 million from the build-up of future policy benefits. Net earnings were $271 million. This analysis works through who actually owns the money in an annuity writer's till.
 Thomas Mücke
Founder & Publisher
Thomas Mücke
Founder & Publisher
Chart
Interactive price chart (TradingView).
Note: pure fact-based analysis, not investment advice and not a solicitation to buy or sell. All figures without guarantee.
There is an investor trap that needs neither greed nor panic — only a till that is full. Call it the cashier’s trap. Picture a supermarket checkout on a Saturday: forty thousand dollars pass through, the receipt roll runs long, the drawer is overflowing. Whose money is it? Not the person sitting in front of it. At an annuity writer the picture is the same, only larger and far harder to read — and the statement of cash flows does not tell you on its own which part of the money is allowed to stay. At F&G Annuities & Life (NYSE: FG), an annuity and life insurer based in Des Moines, Iowa, that statement shows operating cash flow of $4,681 million for 2025. The market value on July 25, 2026 was roughly $3.93 billion. On paper this is a company that pays for itself in under a year.
So let us make a deal: before you file a number like that under bargain, we read through the lines it is built from. Everything that follows comes from mandatory filings with the U.S. securities regulator, the SEC — the annual report (10-K) for 2025, the quarterly report (10-Q) for the period ended March 31, 2026, and three current reports (8-K) filed after it. No recommendation, no price target. Just the question of who owns the money in the till.
What F&G Annuities & Life actually does — the company that sells retirement promises
At heart F&G sells one thing: certainty in exchange for time. A customer hands over money today, the company promises payments later. The shape of the promise is what separates the products.
- Indexed annuities (FIA and RILA) — the largest business. The customer pays in, the crediting rate is tied to a stock index but with a floor: no loss when the index falls, in return only a capped share of the rise. F&G invests the money in bonds and buys options with a small slice to fund the index credit. Sales were $6,703 million in 2025.
- Fixed rate annuities (MYGA) — the savings account of the insurance world: a fixed rate over a fixed term. Sales of $3,794 million in 2025.
- Indexed universal life (IUL) — death benefit cover with a savings element, $190 million in 2025.
- Pension risk transfer (PRT) — a company wants its pension obligations off the books, pays F&G a lump sum, and F&G pays the pensions from then on. $2,126 million in 2025.
- Funding agreements — institutional deposits, partly through notes issued for the purpose, partly through the Federal Home Loan Bank system. $1,825 million in 2025.
The money is made on the spread: F&G invests at one rate and credits the customer a lower one. In 2025 average assets under management of $55,384 million produced a yield of 5.12 percent (2024: 5.27 percent, 2023: 4.80 percent). The book has grown since Fidelity National Financial (NYSE: FNF) acquired the business on June 1, 2020, from $26.5 billion to $57.6 billion (December 31, 2025), and gross sales from $4.5 billion to $14.6 billion. That is no small thing — more on it shortly.
A word about the owner, because it is half the story: FNF listed F&G in December 2022 by distributing roughly 15 percent of the shares, then distributed a further 12 percent to its own shareholders on December 31, 2025. After that FNF held about 70 percent of the common stock. Roughly 34.7 million of the 132.5 million shares trade freely (as of July 25, 2026). A majority holder is not a problem in itself — you simply want to know it is there.
How the stock landed on our desk
Through our price-to-free-cash-flow ranking. It sorts every stock with positive free cash flow and a price-to-free-cash-flow ratio of at most 10 by exactly that measure — cheapest first. The measure itself is a division: market value divided by free cash flow over the last four quarters. Free cash flow is what is left in the till after all investment — in theory the money available for dividends, buybacks or debt reduction. A value of 10 means ten years of that cash flow equal today’s price. A value below 1 means barely a year.
On July 26, 2026, F&G Annuities & Life sat at number 15 in the U.S. selection of that ranking, with a displayed value of 0.7. The list shows the 25 strongest matches; on that day 544 stocks met the criteria. Directly above F&G sat the auto lender Consumer Portfolio Services, and higher up the property lender Ready Capital — the top of this list leans conspicuously toward finance, and that is no accident. One caveat: these lists are recalculated daily, so the rank and the match count are a dated snapshot, not a property of the stock.
Let us redo the arithmetic so it can be checked. The 2025 annual report shows operating cash flow of $4,681 million against $15 million of additions to property, equipment and capitalized software. Free cash flow, then: $4,666 million. Against a market value of roughly $3,928 million (as of July 25, 2026) that gives 0.84. Cross-check on the market value: 132,484,990 shares outstanding per the quarterly report cover page (as of April 30, 2026) times the $29.65 closing price of July 24, 2026 equals $3,928 million — the figure holds.
And now the question that governs everything at an annuity writer: where does that cash inflow come from?
The numbers over the years — given their due
Before the dissection, what genuinely impresses. In 2020 F&G was a mid-sized annuity writer with $26.5 billion under management and $4.5 billion of annual sales. Five and a half years later the books show a portfolio of $57.6 billion (December 31, 2025) and gross sales of $14.6 billion. That is a compound annual growth rate in assets under management of roughly 17 percent over six years — the annual report names precisely that figure.
The growth rode on better financial strength ratings after the FNF acquisition: S&P and Fitch upgraded to A− in June 2020, Moody’s to A3 in July 2023, A.M. Best to A in January 2024. For an annuity writer that is not cosmetic but the ticket to the table: distributors and pension trustees check the credit before they hand over a retirement promise.
The earnings side has turned as well. Total revenues rose from $4,500 million (2023) to $5,744 million (2024) and $5,731 million (2025). Net earnings swung from a loss of $58 million (2023) to a profit of $642 million (2024) and $271 million (2025). Because the raw GAAP number at an insurer is thrown around by derivative valuations, F&G also reports adjusted net earnings: $335 million (2023), $546 million (2024), $482 million (2025). In the first quarter of 2026 the figure was $110 million against $91 million a year earlier.
What the filings say — the uncomfortable truths
No. 1: Four in five cash flow dollars are someone else’s money
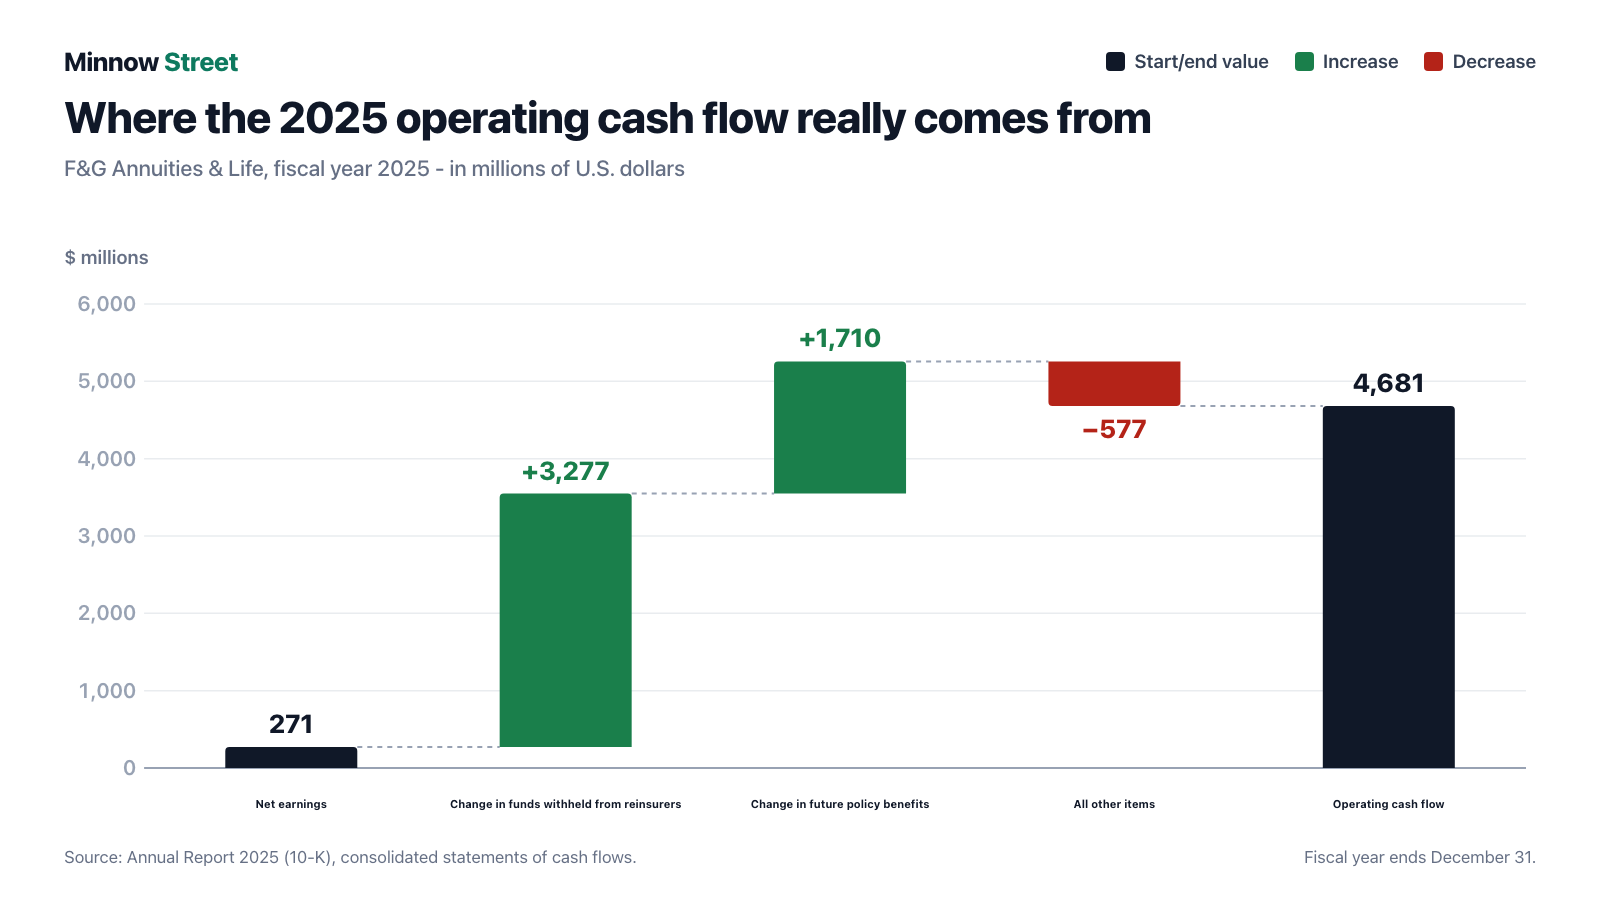
The consolidated statement of cash flows in the 2025 annual report starts with net earnings of $271 million and works up to operating cash flow of $4,681 million. Two lines cover almost the whole distance:
- Change in funds withheld from reinsurers: +$3,277 million. F&G cedes part of its business to reinsurers but keeps the related assets on its own balance sheet. The money sits with F&G; economically it belongs to the ceded obligation.
- Change in future policy benefits: +$1,710 million. This is the build-up of the reserve for annuities F&G will have to pay one day — chiefly from the pension risk transfer business, where the premium is booked as revenue and the obligation sits beside it as a non-cash expense.
Together: $4,987 million — more than the entire $4,681 million of operating cash flow. Every other adjustment together comes to minus $577 million.
Interestingly, the customer deposits into annuity contracts — $11,575 million in 2025 — do not sit in operating cash flow at all. They appear under financing activities, right beside withdrawals of $8,763 million. That is the correct treatment: these deposits are liabilities, not revenue. F&G spells it out in the filing itself.
"Annuity, IUL, funding agreement and non-life contingent PRT sales are not derived from any specific GAAP income statement accounts or line items and should not be viewed as a substitute for any financial measure determined in accordance with GAAP. Sales from these products are recorded as deposit liabilities (i.e., contractholder funds) within the Company's consolidated financial statements in accordance with GAAP."
— F&G Annuities & Life, Inc., Form 10-Q for the quarter ended March 31, 2026, "Non-GAAP Financial Measures"

What does that mean for the metric? A price-to-free-cash-flow ratio below one at an industrial company means it generates its own market value in spendable cash within a year. At an annuity writer it mostly means: the book is growing. Stop the growth — fewer new contracts, more old ones running off — and the number turns without anything about the business getting better or worse. A line worth keeping: growing obligations look like profit in the statement of cash flows.
What actually reached the owners sits a few lines further down: $137 million of dividends and $10 million of share repurchases in 2025. That is roughly 3 percent of the reported free cash flow.
No. 2: Alternative investments have missed for three years
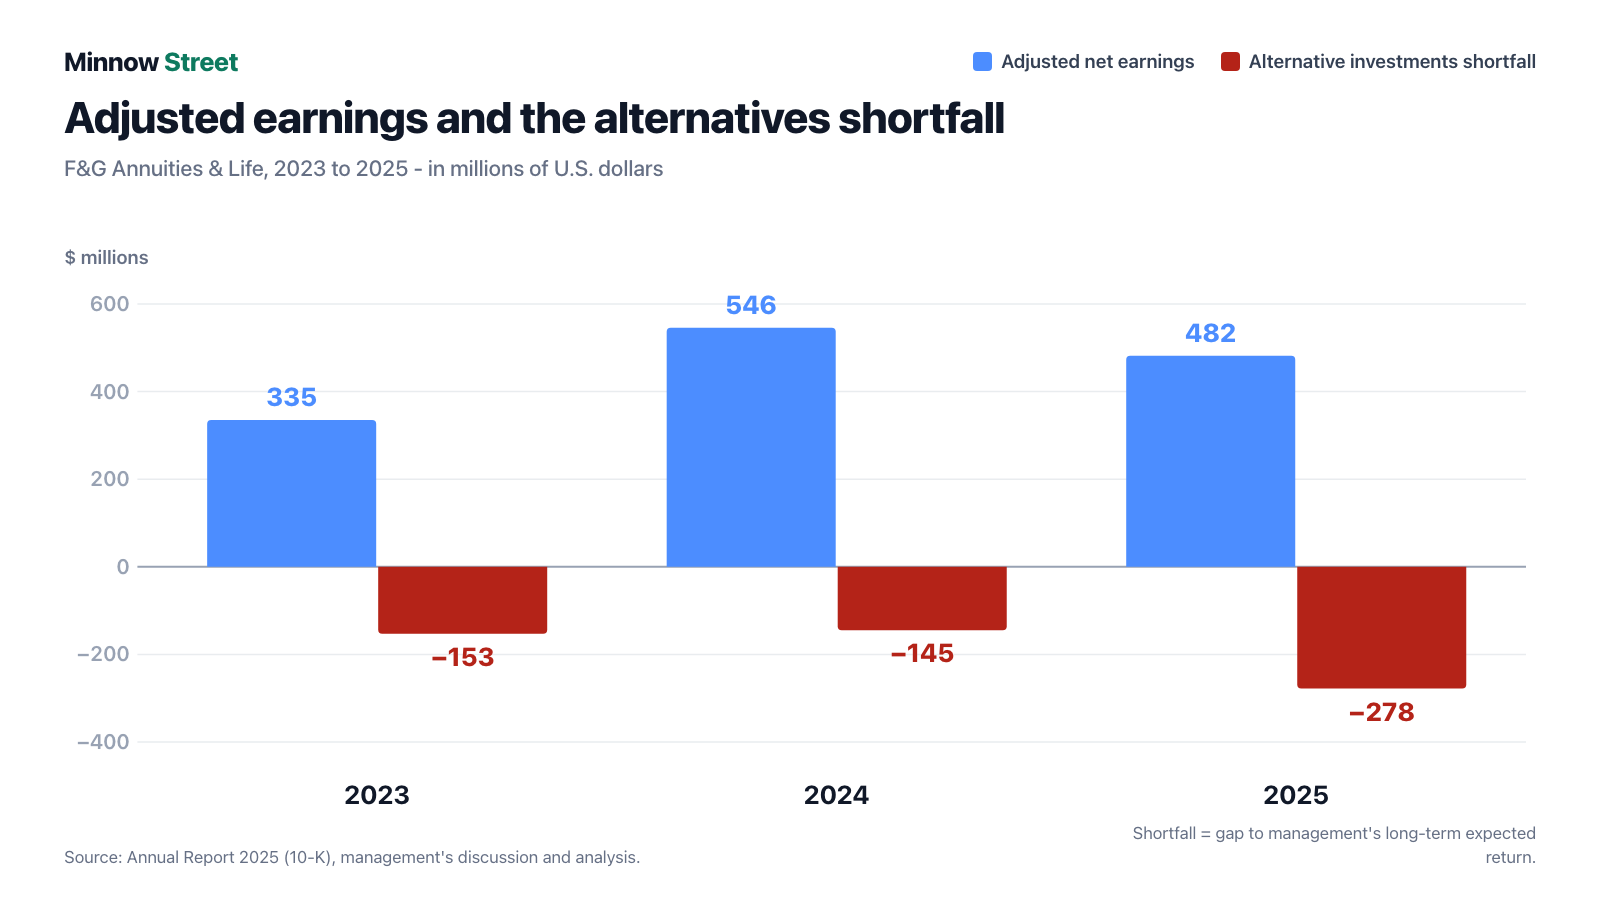
Part of the portfolio sits in funds, joint ventures and limited partnerships — "alternative investments" in the filings. They are supposed to earn more than bonds. They have not for years. The 2025 annual report names the shortfalls against management’s long-term expected return in three consecutive years:
"Adjusted net earnings of $482 million for the year ended December 31, 2025 included income from a $16 million reinsurance true-up adjustment, $10 million tax valuation allowance benefit, and $4 million of actuarial reserve release. Investment income from alternative investments was $278 million below management's long-term expected return of approximately 10%."
— F&G Annuities & Life, Inc., Form 10-K for 2025, management's discussion and analysis

The same report names a $145 million shortfall for 2024 and $153 million for 2023. The 2025 gap equals 58 percent of adjusted annual earnings. Put differently: had the alternatives delivered what management expects over the long run, adjusted earnings would have been more than half again as high.
And it continues. In the first quarter of 2026 the quarterly report shows a $44 million gap to the midpoint of a long-term expected return of roughly 12 to 14 percent. On July 8, 2026 — four weeks ahead of the regular quarterly report — F&G filed out of cycle with preliminary figures for the second quarter of 2026: investment income from alternative investments of $56 million to $66 million pre-tax. The midpoint equals an annualized return of roughly 6 percent and sits $65 million pre-tax, or $51 million post-tax, below the current long-term expectation of approximately 12 percent. Companies rarely file out of cycle because the number is pleasing.
No. 3: Part of the capital ratio rests on regulatory waivers
Insurers are not measured on the equity in the consolidated balance sheet but on a separate regulatory calculation: risk-based capital (RBC). For the main subsidiary FGL Insurance that ratio was about 430 percent as of December 31, 2025 (410 percent in 2024, 451 percent in 2023) against a self-imposed target of 400 percent. At first glance, comfortable.
The regulatory footnote in the quarterly report shows what part of that capital rests on. Individual valuation rules depart from the general rulebook with the approval of the relevant regulator — in Iowa, in Vermont and in the Cayman Islands. The report quantifies the effect: the prescribed and permitted practices increased statutory capital and surplus by $249 million, both as of March 31, 2026 and as of December 31, 2025. And it says what would happen without them:
"Without such permitted statutory accounting practices, Corbeau Re's risk-based capital would have fallen below the minimum regulatory requirements as of March 31, 2026 and December 31, 2025."
— F&G Annuities & Life, Inc., Form 10-Q for the quarter ended March 31, 2026, Note O

The report carries the same sentence for the Cayman Islands subsidiary F&G Cayman Re. For FGL Insurance itself and for Raven Re it explicitly does not apply — both would clear the minimum without the special treatments. For scale: $249 million equals 5.2 percent of total equity of $4,804 million (December 31, 2025). It is approved, disclosed and not unusual in the industry. It is still capital from a valuation rule rather than from the business.
No. 4: From December 31, 2026 a rule change costs roughly 10 points of capital ratio
The same July 8, 2026 filing carries a second figure, and it has a date:
"The Company estimates that applying the new NAIC CLO RBC factors, that take effect on December 31, 2026, to Fidelity & Guaranty Life Insurance Company's ("FGL Insurance") June 30, 2026 CLO portfolio (including both broadly syndicated loans and middle market loans) could reduce FGL Insurance's December 31, 2026 pro forma estimated U.S. RBC ratio by approximately 10 percentage points."
— F&G Annuities & Life, Inc., Form 8-K of July 8, 2026, Item 7.01

A CLO is a securitized pool of corporate loans: a vehicle buys hundreds of them and issues notes in several ranks against the pool. Annuity writers like them because they yield more than government bonds. U.S. insurance regulators have rewritten the capital charge. The arithmetic: 430 percent starting ratio, 400 percent target — a 30-point cushion, of which roughly 10 disappear through a rule change. No alarm, but a third of a buffer.
No. 5: The parent holds the strings — and converts in January 2027
FNF does not only hold about 70 percent of the common stock. On January 12, 2024 the parent also subscribed 5,000,000 preferred shares for $250 million — the 6.875 percent Series A Mandatory Convertible Preferred Stock. Those shares convert automatically on January 15, 2027 into between 0.9456 and 1.1111 common shares each, depending on the average price over the 20 trading days beforehand. That is between 4.73 million and 5.56 million new common shares against 132.5 million existing ones — your slice of the pie shrinks by up to 4.2 percent, and the parent’s share rises accordingly.
While the preferred dividend runs, it also ranks ahead: under the terms, no dividend may generally be paid on the common stock and no common shares acquired unless all preferred dividends have been declared and paid. In practice that is uncritical today — the preferred dividend of roughly $17 million a year is being serviced — but it is a ranking worth knowing.
Part of the picture too: the leadership is rearranging itself. On June 16, 2026 F&G announced that Chris Blunt would step down as chief executive on June 30, 2026 to focus on his roles as a director and as chief executive of the subsidiary Peak Altitude Equity, LLC. His successor is Conor Murphy, until then president and chief financial officer. The new chief financial officer, Michael Bailey, starts on August 3, 2026; until then chief accounting officer Mark Wiltse holds the role on an interim basis. Two changes at the top in six weeks is not a scandal, but it is not background noise either.
Valuation — what the market is asking today
Roughly $3.93 billion of market value (as of July 25, 2026) stands against book equity of $4,749 million as of March 31, 2026. That puts the price-to-book ratio at about 0.85 — the market values the company below its book. The trailing price-to-earnings ratio is roughly 7.7, price to sales roughly 0.65.
A discount to book is no outlier for an annuity writer. It has three defensible reasons. First, a large part of the book value moves with interest rates: equity contains a cumulative unrealized loss on bonds of $2,500 million (March 31, 2026, after $1,951 million at December 31, 2025). If rates rise further, that item grows. Second, earning power hangs on the alternative investments, which have trailed expectations for three years. Third, the float is small: roughly 34.7 million tradable shares out of 132.5 million means thin turnover and sharper price swings.
The professionals’ view is correspondingly cautious — and extremely thin: two firms cover the stock, both at hold, and the average price target of $27 (as of July 25, 2026) sits below the $29.65 closing price of July 24, 2026. With two opinions that is a footnote rather than a consensus. The Altman Z-score, elsewhere a popular solvency gauge, carries no meaning at insurers — the formula was built for industrial companies with inventories and working capital.
Opportunities and risks at a glance
What speaks for F&G:
- The book has grown at double digits for six years: assets under management from $26.5 billion (June 2020) to $57.6 billion (December 31, 2025), gross sales from $4.5 billion to $14.6 billion.
- The spread carries: a 5.12 percent yield on average assets under management in 2025 against a liability duration of roughly five years; 96 percent of fixed maturity securities carry the two highest regulatory credit designations (December 31, 2025).
- The valuation is low: about 0.85 times book and roughly 7.7 times trailing earnings (as of July 25, 2026). If the alternative investments deliver again, it flows straight into earnings.
- Capital is being returned, if in small doses: a quarterly dividend of $0.25 (declared May 6, 2026), a new repurchase program of $100 million through March 31, 2029, plus a Rule 10b5-1 trading plan in place since March 30, 2026.
- The sale of the Bermuda subsidiary F&G Life Re on March 1, 2026 brought roughly $102 million in cash plus a 19.9 percent interest in the buyer and a pre-tax gain of about $14 million.
What speaks against it:
- The free cash flow that put the stock in our ranking is roughly four-fifths the build-up of obligations. With a flat book it disappears without anything changing in the business.
- Alternative investments have been under plan for a third consecutive year — $278 million in 2025, equal to 58 percent of adjusted annual earnings. On the company’s own preliminary math the second quarter of 2026 will miss by roughly $65 million pre-tax again.
- Permitted statutory accounting practices carry $249 million of statutory capital; without them two subsidiaries would sit below minimum capital (March 31, 2026).
- From December 31, 2026 new NAIC factors for CLO holdings cost roughly 10 percentage points of the capital ratio on the company’s own estimate — against a 30-point cushion to its own target.
- The unrealized bond loss inside equity grew within one quarter from $1,951 million to $2,500 million (December 31, 2025 to March 31, 2026).
- Concentrated ownership with a thin float: FNF holds about 70 percent, roughly 34.7 million shares trade freely, and the preferred conversion on January 15, 2027 adds up to 5.56 million new shares.
- A double leadership change: new chief executive from June 30, 2026, new chief financial officer from August 3, 2026.
A human bottom line
Back to the till. The cashier on Saturday had a full drawer and still no good day — one says nothing about the other. At F&G Annuities & Life it is the same confusion, only in billions: the metric that washed this stock to the top of our ranking does not measure how much the company earns but how fast its obligations grow. This is not manipulation — it sits openly in the statement of cash flows, and F&G writes into its own filing that the customer money is a liability.
What remains is a soundly grown annuity writer with a $57.6 billion book, a workable spread, a valuation below book — and three building sites that fit into one sentence: the income is not arriving where it was planned, and the capital cushion is thinning rather than thickening. None of it is an emergency. All of it has a date on which you can look it up.
Buying here means buying a low multiple of book and the hope that the alternatives eventually deliver. Waiting means having the second-quarter figures on August 5, 2026 and the annual report with the new capital ratio in spring 2027 — both without extrapolation, both with real numbers. Either is defensible. What you make of it is your decision. And that is exactly as it should be.
Sources
- F&G Annuities & Life, Inc. — Form 10-Q for the quarter ended March 31, 2026 (filed May 7, 2026)
- F&G Annuities & Life, Inc. — Form 10-K for 2025 (filed February 26, 2026)
- F&G Annuities & Life, Inc. — Form 8-K of July 8, 2026 (preliminary alternative investment income, NAIC CLO factors)
- F&G Annuities & Life, Inc. — Form 8-K of June 16, 2026 (chief executive and chief financial officer transition)
- F&G Annuities & Life, Inc. — Form 8-K of April 1, 2026 (Rule 10b5-1 repurchase plan)
- SEC EDGAR — all filings by F&G Annuities & Life, Inc. (CIK 0001934850)
- Source: fundamental data & SEC filings (annual and quarterly reports, 10-K/10-Q) — metrics, share count and analyst coverage, as of July 25, 2026
This analysis is journalistic commentary on publicly available mandatory filings. It is not investment advice and not a solicitation to buy or sell securities. Shares can fall to zero; with roughly 34.7 million freely tradable shares there is an elevated liquidity risk. At life and annuity insurers the value of equity depends heavily on interest rate and credit markets and can move sharply within a single quarter. All figures come from the sources named above and carry the as-of dates stated there. The author holds no position in F&G Annuities & Life, Inc. at the time of publication.
Our Bottom Line at a Glance
- Growth of the book positive
- Assets under management rose from $26.5 billion at the Fidelity National Financial acquisition in June 2020 to $57.6 billion as of December 31, 2025, and gross sales from $4.5 billion to $14.6 billion. The 2025 annual report names a compound annual growth rate in assets under management of 17 percent over six years. Ratings upgrades carried it: S&P and Fitch to A− in June 2020, Moody's to A3 in July 2023, A.M. Best to A in January 2024.
- Origin of free cash flow negative
- Of $4,681 million in operating cash flow during 2025, $3,277 million comes from the change in funds withheld from reinsurers and $1,710 million from the build-up of future policy benefits — together $4,987 million, more than the entire amount. Net earnings were $271 million; owners received $137 million of dividends and $10 million of share repurchases. The metric measures growth in the book, not earning power.
- Alternative investments negative
- Investment income from alternative investments fell short of management's long-term expected return by $153 million in 2023, $145 million in 2024 and $278 million in 2025 (10-K 2025). The 2025 shortfall equals 58 percent of adjusted annual earnings of $482 million. The first quarter of 2026 was $44 million short; for the second quarter of 2026 F&G reported preliminarily on July 8, 2026 an annualized return of roughly 6 percent and a $65 million pre-tax shortfall.
- Regulatory capital negative
- The estimated U.S. capital ratio of the main subsidiary FGL Insurance was about 430 percent as of December 31, 2025 against a 400 percent target. Prescribed and permitted practices raised statutory capital by $249 million (March 31, 2026 and December 31, 2025) — without them the subsidiaries Corbeau Re and F&G Cayman Re would sit below minimum regulatory capital. From December 31, 2026 new NAIC factors for CLO holdings cost roughly 10 percentage points of the ratio on the company's own estimate.
- Ownership and dilution neutral
- Fidelity National Financial holds about 70 percent of the common stock (December 31, 2025); roughly 34.7 million of 132.5 million shares trade freely (as of July 25, 2026). The parent's 5,000,000 preferred shares convert automatically on January 15, 2027 into between 0.9456 and 1.1111 common shares each, meaning up to 5.56 million new shares or 4.2 percent. While the preferred dividend is unpaid, no common dividend may generally be paid.
- Valuation neutral
- Roughly $3.93 billion of market value (as of July 25, 2026) stands against $4,749 million of equity as of March 31, 2026 — a price-to-book ratio of about 0.85 at a trailing price-to-earnings ratio of roughly 7.7. The discount has reasons: equity contains a cumulative unrealized bond loss of $2,500 million (March 31, 2026, prior quarter $1,951 million). Two analyst firms cover the stock, both at hold with an average price target of $27.
F&G Annuities & Life has more than doubled assets under management since June 2020, from $26.5 billion to $57.6 billion, and earns a workable spread of 5.12 percent (2025). But the $4,666 million of free cash flow that lifted the stock to number 15 in our price-to-free-cash-flow ranking is $4,987 million the build-up of obligations to policyholders and reinsurers — net earnings were $271 million. Add three documented findings: alternative investments under plan for a third consecutive year, $249 million of statutory capital resting on regulatory waivers, and a rule change on December 31, 2026 that costs roughly 10 percentage points of capital ratio. Not investment advice.
What Our Rating Means
Open questions
The business works in principle, but one material question is open. As long as it stays open, our findings do not carry a quality verdict.
Amber here stands for documented substance findings without acute danger to the business. On the positive side sit a book that has grown at double digits for six years to $57.6 billion (December 31, 2025), a 5.12 percent yield on average assets under management, and a main subsidiary capital ratio of about 430 percent above its own 400 percent target. Against that stand three findings from the filings: investment income from alternative investments is under plan for a third consecutive year (2025: −$278 million, equal to 58 percent of adjusted earnings), $249 million of statutory capital rests on regulatory waivers without which two subsidiaries would fall below minimum capital, and from December 31, 2026 new NAIC factors for CLO holdings cost roughly 10 of the 30 points of cushion above the capital target. None of it is existential; all of it is verifiable on a stated date.
A journalistic assessment by our editorial team at the time of the deep dive, based on public sources — not investment advice and not a solicitation to buy or sell. Your personal circumstances (investment goals, risk capacity, taxes) cannot be taken into account. What our levels mean, how verdicts are formed, and what conflicts of interest exist →
Worth Noting
- Hook: rank 15 in our in-house price-to-free-cash-flow ranking (U.S. selection), displayed value 0.7, as of July 26, 2026. The list shows the 25 strongest matches; on that day 544 stocks met the criteria. The lists are recalculated daily — the rank and the match count are a snapshot.
- As-of dates: SEC figures per December 31, 2025 (Form 10-K, filed February 26, 2026) and March 31, 2026 (Form 10-Q, filed May 7, 2026); metrics, share count and analyst coverage as of July 25, 2026. Filings after the quarterly report were reviewed: Form 8-K of June 16, 2026 (leadership change), June 25, 2026 (annual meeting) and July 8, 2026 (preliminary figures).
- Risk of confusion: the symbol FG is also used on Canada's TSX Venture Exchange by Falcon Gold Corp., a mineral explorer with no connection to this company. The same SEC filer number, 0001934850, also carries the notes FGN and FGSN on the New York Stock Exchange. Identification is unambiguous through the exchange (NYSE) and ISIN US30190A1043. F&G should also not be confused with its majority owner Fidelity National Financial (FNF) or with the similarly named fund manager Fidelity Investments, to which it has no connection.
- Metric caveat: at life and annuity insurers the Altman Z-score and classical working capital ratios carry no meaning, because the formulas were built for industrial companies. The relevant measures are new business premiums, investment income and the regulatory capital ratio.
- Takeover check: through July 26, 2026 the SEC filings contain no merger agreement, no tender offer and no delisting — not even from majority owner FNF, which in fact reduced its stake on December 31, 2025 by distributing roughly 12 percent of the shares.
Frequently Asked Questions
F&G Annuities & Life, Inc. is a U.S. annuity and life insurer based in Des Moines, Iowa. It sells fixed indexed annuities, fixed rate annuities and indexed universal life insurance, and serves institutional clients with pension risk transfer solutions and funding agreements. The money is made on the spread between what the portfolio earns and what is credited to policyholders. As of December 31, 2025 it managed $57.6 billion and employed 1,173 full-time equivalents.
Because the operating cash flow of a growing annuity writer mostly reflects the build-up of obligations. Of $4,681 million in operating cash flow during 2025, $3,277 million came from the change in funds withheld from reinsurers and $1,710 million from the build-up of future policy benefits. Net earnings were $271 million. The metric here measures growth in the book, not earning power.
No. The quarterly report for the period ended March 31, 2026 states explicitly that sales of annuities, indexed universal life and funding agreements are recorded as deposit liabilities under U.S. accounting rules. The $11,575 million of customer deposits in 2025 therefore sit under financing activities. Only life-contingent pension risk transfer business is booked as premium revenue — $2,108 million in 2025.
After distributing a further 12 percent of the shares to its own shareholders on December 31, 2025, Fidelity National Financial (NYSE: FNF) held about 70 percent of F&G common stock. FNF also holds 5,000,000 preferred shares from a $250 million subscription dated January 12, 2024, which convert automatically on January 15, 2027 into between 0.9456 and 1.1111 common shares each.
The estimated U.S. risk-based capital ratio of the main subsidiary FGL Insurance was about 430 percent as of December 31, 2025, after 410 percent in 2024 and 451 percent in 2023; the company's own target is 400 percent. Note that permitted statutory accounting practices raised statutory capital by $249 million as of March 31, 2026 — without them the subsidiaries Corbeau Re and F&G Cayman Re would fall below minimum capital.
On that date new NAIC capital factors for collateralized loan obligations take effect. On July 8, 2026 F&G estimated that these factors could reduce FGL Insurance's estimated U.S. risk-based capital ratio at December 31, 2026 by roughly 10 percentage points on a pro forma basis. The final impact depends on the credit ratings and the tranches held at that time.
No. Through July 26, 2026 the SEC filings contain no merger agreement, no tender offer and no delisting or deregistration filing (Form 25 or Form 15). Fidelity National Financial has in fact reduced its stake through the December 31, 2025 distribution. The common stock and the two notes, FGN and FGSN, continue to trade on the New York Stock Exchange.
The symbol FG is also used on Canada's TSX Venture Exchange by Falcon Gold Corp., a mineral explorer with no connection to this company. The same SEC filer number, 0001934850, also carries the notes FGN and FGSN on the New York Stock Exchange. Identification is unambiguous through the exchange (NYSE) and the security identifier ISIN US30190A1043.
Found an error?
Did you spot a factual error, an outdated number, or a typo in this deep dive? Let us know briefly — your report goes straight to the editorial team.