MYR Group Stock: On the Grid Since 1891, Up 171 Percent in a Year — and Its Own Buyback Program Expired Unused
MYR Group has been wiring America since 1891 — high-voltage lines, substations, data centers. In our in-house stock scanner, the stock lights up 22 filters at once, from the stage-2 trend to a perfect Piotroski F-Score of 9 (data as of July 10, 2026; momentum run of July 17, 2026). We read the annual reports (10-K) for 2024 and 2025 and the quarterly report (10-Q) as of March 31, 2026: a record year with $3.66 billion in revenue, a 2024 margin accident on solar job sites, 57 percent fixed-price contracts — and a $75 million repurchase program that expired unused while the stock nearly tripled. Not investment advice — just the note that management last bought its own shares around $117 and has kept its hands in its pockets since.
 Thomas Mücke
Founder & Publisher
Thomas Mücke
Founder & Publisher
Chart
Interactive price chart (TradingView).
Note: pure fact-based analysis, not investment advice and not a solicitation to buy or sell. All figures without guarantee.
There is an investor trap that catches two kinds of people at once: the anchor trap. It works like this: your brain memorizes a price — and from then on it judges the distance to that anchor instead of the business. If you saw MYR Group Inc. (Nasdaq: MYRG) a year ago at roughly a third of today’s price, your reflex now says “too expensive, that train has left.” If you first spotted it this week in the leaders list, you see a gain of 171 percent in twelve months and an all-time high within sight (data as of July 10, 2026) — and you want to jump aboard before the train pulls further away. Both verdicts are about a number in the rearview mirror. Neither has opened a single annual report. So let’s make a deal: before you settle for either reflex, we read together what the 135-year-old grid builder itself reported, under penalty of law, to the U.S. securities regulator, the SEC — the annual reports (10-K, the audited yearly filings of U.S.-listed companies) for 2024 and 2025 and the quarterly report (10-Q) as of March 31, 2026. Those filings contain a record quarter — but also a margin trauma and a footnote about the company’s own buyback program that should make you pause. In the end, you decide for yourself.
What MYR Group actually does — and for whom
MYR Group is something like America’s electrical trade shop at corporate scale: not a power producer, not a utility, but the company that — with 9,000 people, crane trucks and splicing crews — builds and repairs the infrastructure everything flows through. The annual report says it in a sentence few listed companies can write: “We have operated in the transmission and distribution industry since 1891” — founded as L.E. Myers (the SEC’s EDGAR database still lists the historical name “MYERS L E CO GROUP”). Today the business runs in two segments. Transmission & Distribution (T&D), $2.00 billion of 2025 revenue: high-voltage transmission lines, substations, distribution networks, clean energy projects and emergency storm restoration — customers are investor-owned utilities, cooperatives and developers across the United States and Ontario. Commercial & Industrial (C&I), $1.66 billion: the complete electrical fit-out of large construction projects — and the list in the quarterly report begins, not by accident, with “data centers,” followed by airports, hospitals, stadiums, factories and water treatment plants, mostly as a subcontractor to large general contractors in the western United States and Canada. The company is run from Thornton, near Denver, by Rick Swartz, who joined MYR in 1982 as a project foreman and has been CEO since 2017. Of the roughly 9,000 employees, 7,200 are craft workers, about 85 percent of them union members — mostly with the electrical workers’ union IBEW, across more than 300 local chapters. And why is the market suddenly treating a line builder like a growth stock? The company’s own outlook says it plainly:
“We believe the increasing demand for electricity associated with additional power requirements, driven by increased electrification associated with new technologies, including the emergence and adoption of artificial intelligence technologies as well as increased power needs connected to the reshoring of manufacturing, will require significant investment by our customers in both of our reporting segments.”
— MYR Group Inc., SEC quarterly report 10-Q as of March 31, 2026, Item 2 “Outlook”
Translated into a picture: AI builds data centers, data centers need power, power needs wires — and MYR Group lays the wires and fits out the halls. That is the shovel-seller position in the AI boom, two links removed from the chips. Which brings us to the central tension of this analysis, running through every chapter: a rock-solid century-old trade business with genuine tailwinds and record numbers — priced as if nothing in project construction could ever go wrong again, less than two years after the last margin accident. How the same power boom reads at other specialists is something we have dissected at Solaris Energy (mobile power for data centers) and at the solar-connectivity maker Shoals.
Where the stock shows up in our scanner
We run roughly 3,500 stocks through our scanners every day. MYR Group landed on the research list via the momentum/stage-2 run of July 17, 2026 — and shows one of the broadest confluence signatures that run can produce: 22 hits as of the July 10, 2026 data cut. On the trend side, the hits stack up: stage-2 uptrend per Stan Weinstein (price above a rising 200-day average), RS leader ≥90 (the stock beats 90 percent of the market; its relative strength rating is 95), near 52-week high, RS new highs, the Mark Minervini trend criteria, Gary Antonacci dual momentum and a Pradeep Bonde breakout signal. Behind them: up 83 percent in three months, 121 percent in six, 171 percent over twelve — with only about 3 percent left to the all-time high (all data as of July 10, 2026). What makes this case remarkable is that the quality filters join in: institutional accumulation (11 funds added recently, 6 trimmed), quality growth, the Altman-Z balance sheet fortress (an early-warning bankruptcy score built from several balance sheet ratios — MYR sits around 6.9, far above the danger zone that starts below 1.8) and a Piotroski F-Score of 9 of 9 — the nine-point health check of the books stands at the maximum a company can score (quarter ended March 31, 2026). The scanner’s fundamental grade: B. Only one filter family is completely absent: everything labeled “cheap” — the trailing P/E sits around 53. To replicate it yourself: open the MYR Group stock page or browse the stage-2 scanner. Remember the constellation: when trend and quality filters cheer together and only the valuation filters stay silent, the question is not whether the company is good — it is what you are paying for the goodness.
The numbers over the years — honestly appraised
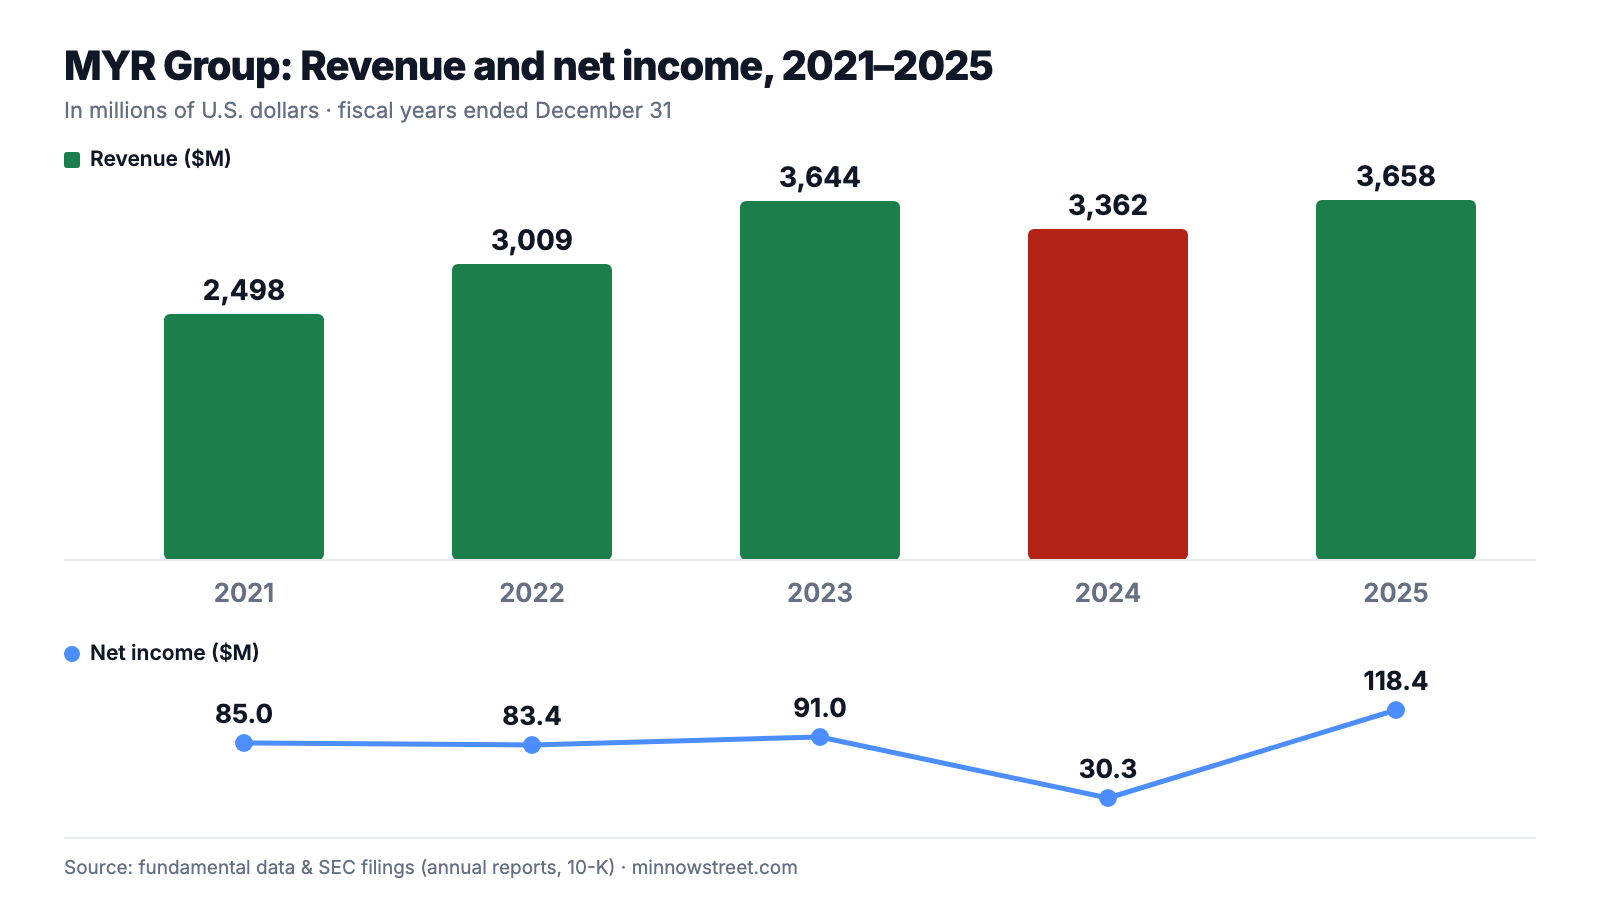
First, what genuinely impresses — and here that is quite a lot. Revenue grew from $2.50 billion in 2021 to $3.66 billion in 2025, nearly half again as much in four years, without major acquisitions. Net income reached a company record of $118.4 million in 2025, gross margin recovered from 8.6 to 11.6 percent, and operating cash flow practically exploded — from $87.1 million (2024) to $326.6 million: the company did not just earn the money, it collected it, as projects were billed out and advance payments came in. Both segments nearly doubled their operating income in 2025: T&D to $157.6 million (margin 7.9 after 3.7 percent), C&I to $97.2 million (5.9 after 3.2 percent).
And then came the first quarter of 2026, the one that electrified the momentum buyers — the quarterly report records it dryly: “Revenues increased $166.8 million, or 20.0%, to $1.00 billion for the three months ended March 31, 2026 from $833.6 million for the three months ended March 31, 2025” (10-Q as of March 31, 2026). It is only the second quarter in company history above the billion-dollar mark — after the fourth quarter of 2023 — with a gross margin of 13.4 percent (prior year: 11.6), net income doubled to $46.8 million and $2.99 in diluted earnings per share. Both segments ran at record margins: 9.7 percent operating margin in T&D, 8.1 percent in C&I. Backlog stood at $2.84 billion, up 7.6 percent year over year. Add a detail that delights balance sheet purists: during the quarter MYR paid its revolving credit line down almost entirely — as of March 31, 2026, just $9.4 million of remaining debt (equipment notes) stood against $163.2 million in cash.
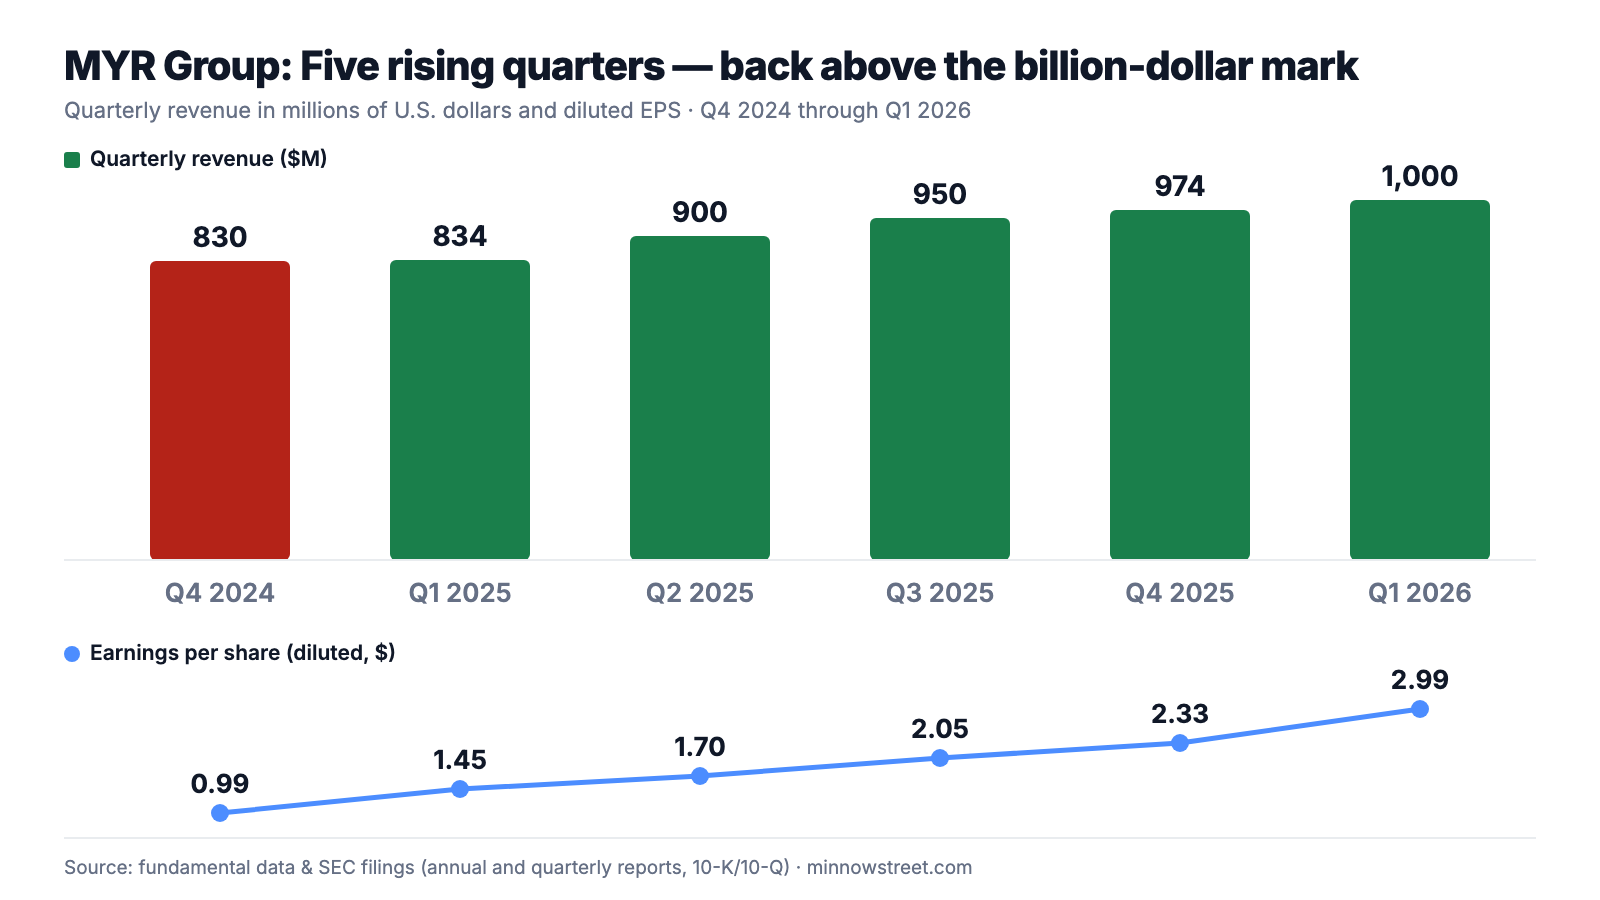
If you only saw these two charts, you would understand the 22 scanner hits immediately. But the left chart contains one red bar, and that bar has a story you need to know before you extend the right chart into the future. Which brings us to the uncomfortable truths.
What the filings say — the uncomfortable truths
Uncomfortable truth no. 1: 2024 showed how fast margins vanish here — solar job sites cost two thirds of the profit
In 2023, MYR Group earned $91.0 million. In 2024, on just 8 percent less revenue, $30.3 million was left — down 67 percent. What happened? The annual report for 2024 lays it out in the segment discussion:
“During the year ended December 31, 2024, significant estimated gross profit changes negatively impacted operating income as a percentage of revenues by 5.7% with 5.5% of the impact related to losses on certain clean energy projects that have reached mechanical completion. Losses on these projects were primarily related to contractual disputes, labor and project inefficiencies, higher labor and contract related costs and unfavorable weather conditions.”
— MYR Group Inc., SEC annual report 10-K for 2024, Item 7 “Management’s Discussion and Analysis,” Transmission & Distribution segment
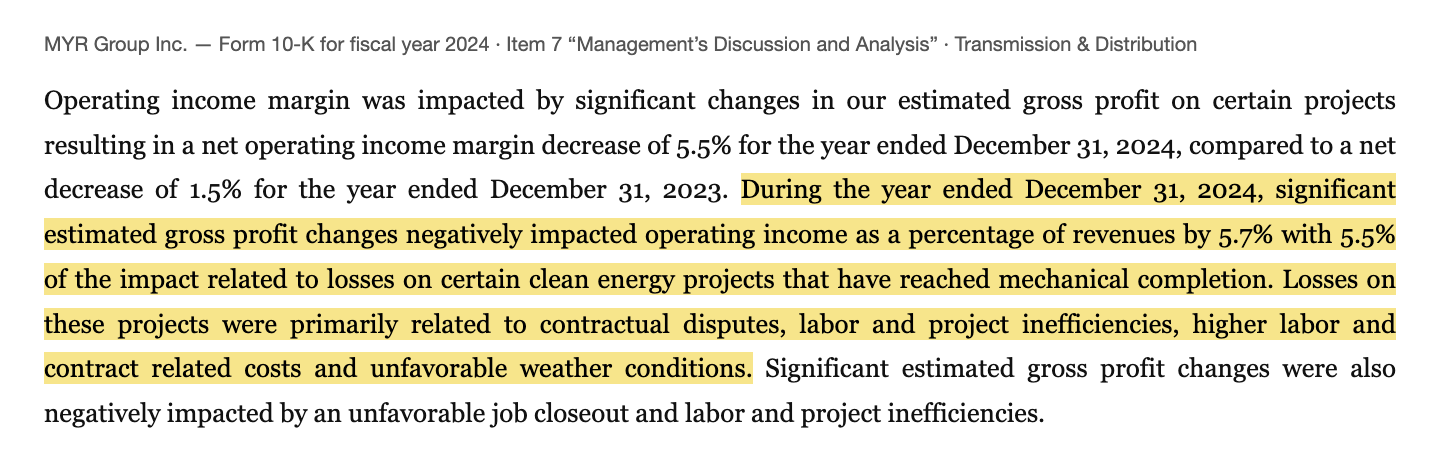
The word “estimated” is the key to the entire business model. MYR accounts for large projects under the cost-to-cost method: the profit of a multi-year project is booked proportionally while construction is under way — based on an estimate of total cost. If a job site goes off the rails, the company must not only cancel future profits but claw back already booked profits in one stroke. That is exactly what happened in 2024, when solar projects ran into disputes, delays and rain. In fairness: management finished the projects instead of dragging them out, the solar legacy was worked off in 2025, and the record margins of the first quarter of 2026 show the business as it can run. But remember the mechanism: at a project builder, reported profit is always also a bet on how the job site ends — and 2024 showed what the bet looks like when it is lost.
Uncomfortable truth no. 2: 57 percent of revenue is fixed-price — cost overruns stay with MYR
Why could so much margin disappear in 2024 in the first place? Because MYR bids most of its work at fixed prices — and the annual report for 2025 names the risk of that contract form with unusual clarity:
“Fixed-price and unit-price contracts typically have higher potential margins; however, they hold a greater risk in terms of profitability because cost overruns may not be recoverable. […] Fixed-price contracts accounted for 57.0% of total revenue for the year ended December 31, 2025, including 34.3% of our total revenue for our T&D segment and 84.5% of our total revenue for our C&I segment.”
— MYR Group Inc., SEC annual report 10-K for 2025, Item 1 “Business,” Contract Types
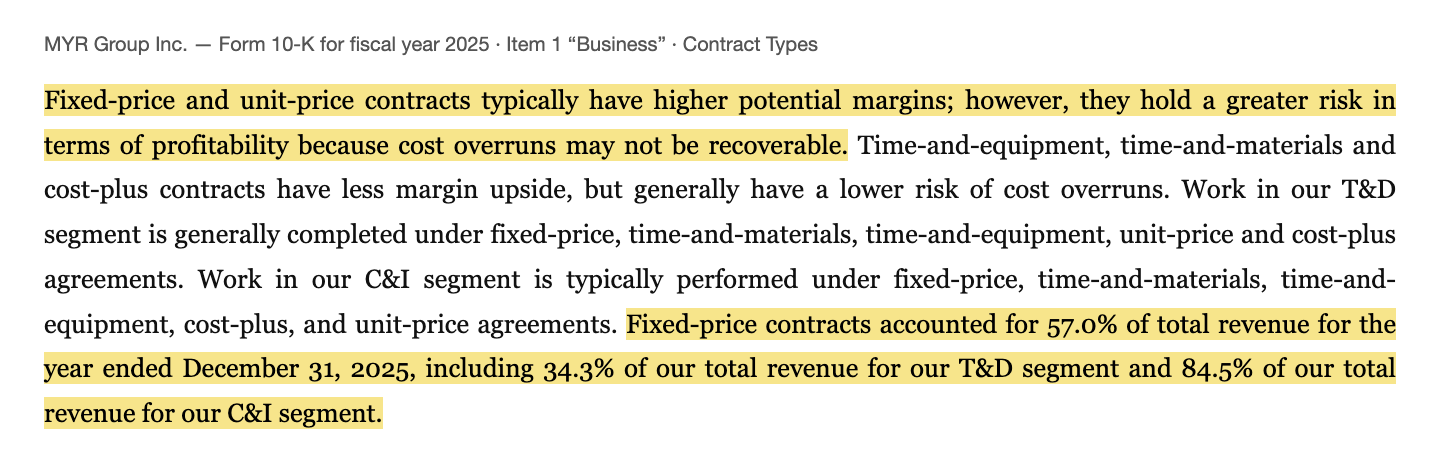
A fixed-price contract is like a contractor’s quote for your kitchen remodel: once the number is on paper, every surprise behind the wall belongs to the contractor. Note the distribution: of all places, the C&I segment — the one with the data centers, the one growing fastest — runs 84.5 percent of its revenue at fixed prices. Two amplifiers come from the same filing: materials, tariffs and above all wages are rising (85 percent of the craft workforce is under collective bargaining agreements that expire between 2026 and 2028 and must be renegotiated), and even in the record year 2025 there were negative estimate changes of 2.4 gross margin points, only partly offset by positive surprises of 1.0 point. The fair counterpoint: fixed prices are the industry norm, they enable the higher margins MYR is currently harvesting, and a backlog progressing “at higher contractual margins,” in management’s words, is precisely why 2025 and early 2026 were so strong. But remember the asymmetry: today’s higher margins and tomorrow’s write-downs come from the same contract form.
Uncomfortable truth no. 3: Backlog covers less than nine months of revenue — and the filing itself warns against the metric
The growth story needs resupply, and the gauge for that is backlog: $2.84 billion as of March 31, 2026, up 7.6 percent year over year. Sounds comforting — until you lay the number next to revenue: MYR now generates about $3.8 billion in twelve months. So the backlog covers less than nine months, and in the growth-critical T&D segment it actually declined by $37.5 million during the first quarter of 2026. Before you turn that into a catastrophe, though, read what the company itself says about this metric — in the risk factors of the annual report:
“Given these factors and our method of calculating backlog, our backlog at any point in time may not accurately represent the revenue that we expect to realize during any period, and our backlog as of the end of a fiscal year may not be indicative of the revenue we expect to earn in the following fiscal year and should not be viewed or relied upon as a stand-alone indicator.”
— MYR Group Inc., SEC annual report 10-K for 2025, Item 1A “Risk Factors”
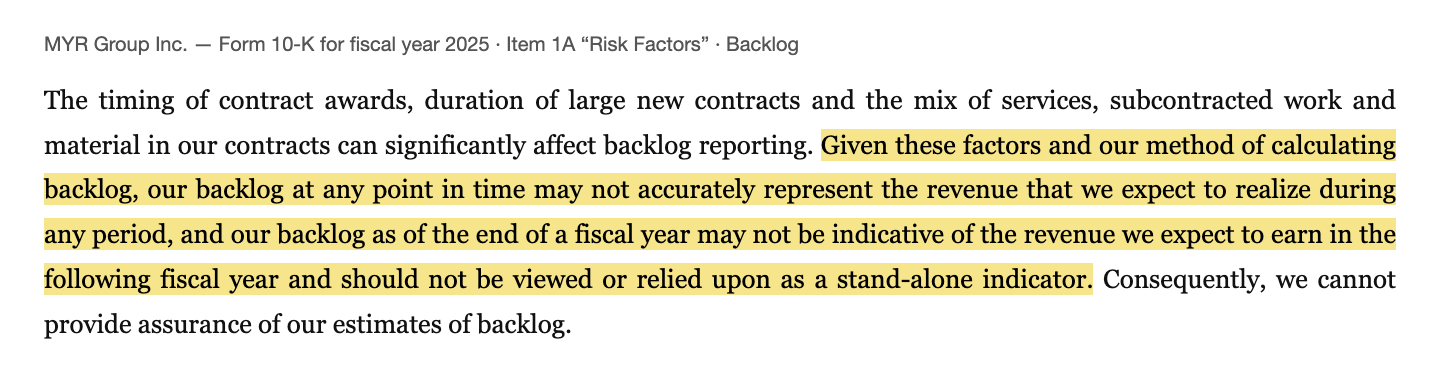
The reason for the warning is technical — and it cuts both ways: for many master service agreements (framework contracts that often run one to four years), MYR only counts the next three months of projected revenue in backlog, although the relationship runs far longer; a chunk of the recurring maintenance and storm business structurally never shows up. Conversely, backlog guarantees nothing: awards can be trimmed or canceled, usually without MYR having a claim to the full value. What remains for you as a reader: for a stock that nearly tripled in twelve months, a backlog growing 7.6 percent delivers only a normal ration of new future so far — the buyers’ real bet rides on the large projects that have not even been awarded yet. Of the $2.84 billion, $2.54 billion is expected to be worked off within twelve months; $167.5 million is MYR’s proportionate share of joint venture contracts.
Uncomfortable truth no. 4: Management bought its own stock at $117 — and let the new program expire unused above $400
There is a passage in the annual report for 2025 that says more about the valuation than any analyst model. The backstory: in 2024 and 2025, MYR bought back its own shares aggressively — $75 million each year, about 1.28 million shares in total at average prices of $116.54 and $117.33. In July 2025 the board approved a new $75 million program. And then:
“We did not purchase any shares of common stock in October, November or December of 2025. As of December 31, 2025, the Company had $75.0 million of funds available to repurchase shares of the Company’s common stock under the Repurchase Program. The Repurchase Program expired on February 4, 2026.”
— MYR Group Inc., SEC annual report 10-K for 2025, Item 5 “Issuer Purchases of Equity Securities”
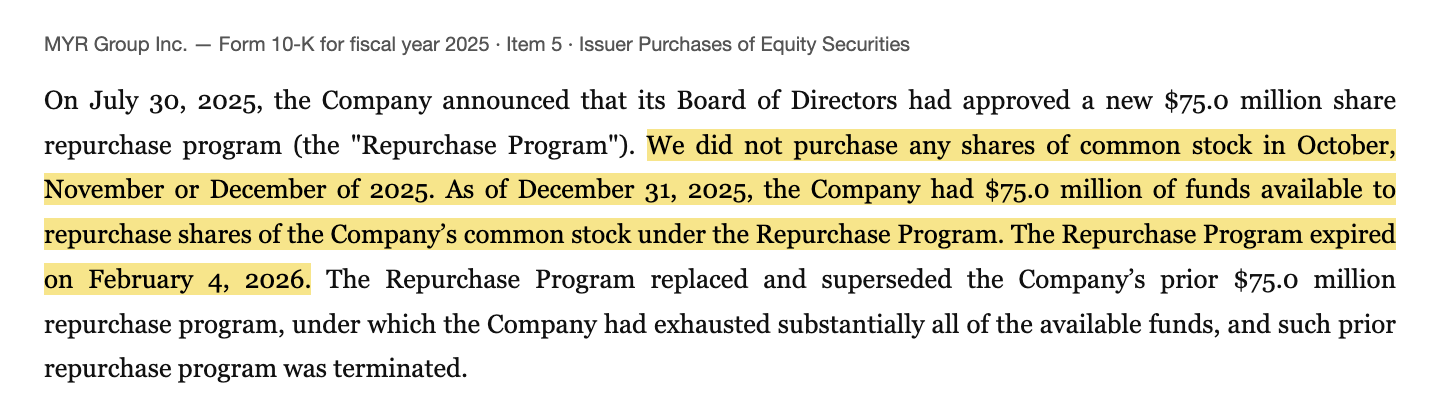
Read this soberly, without conspiracy: buyback programs are authorizations, not obligations, and a company getting more careful after its stock has nearly tripled is a sign of discipline rather than weakness — the same discipline at $117 is what made long-term holders rich. MYR pays no dividend, by the way (“We have not historically paid dividends and currently do not expect to pay dividends,” 10-Q as of March 31, 2026). But the message for a new buyer is uncomfortable enough to spell out: the same leadership that knows this business best last found its own stock worth buying around $117 — and at the prices since fall 2025, it no longer did. The insider picture from our scanner fits: zero purchases, one sale (data as of July 10, 2026). Whoever gets in today buys at terms at which the board preferred to let its own program lapse.
Valuation: $7.8 billion of market value for a trade business with a 3 to 5 percent net margin
In early July 2026 the MYR Group share cost about $487, putting the market value at roughly $7.8 billion (data as of July 10, 2026). Against the trailing twelve-month profit of a good $142 million ($9.07 per share), that is a price-to-earnings ratio around 53 — for a construction and installation group that historically traded closer to 15 to 25 times earnings. The price-to-sales ratio of about 2 sounds harmless but is not: at a 3.2 percent net margin (2025), only a nickel of every revenue dollar sticks. And the price-to-book ratio around 11 ($702.8 million of equity as of March 31, 2026) prices the company’s assets like a software firm’s — yet they consist of crane trucks, receivables and $114 million of goodwill. The optimists’ counter-math goes like this: analysts (five estimates, consensus “buy,” mean rating 1.2) expect around $11.47 in earnings per share for the current year — estimates were raised by more than 20 percent within four weeks — and $13.18 for the following year; that compresses the P/E to about 42 and 37, respectively. If the grid and data center cycle runs for years and the cost-to-cost discipline holds, the company grows into part of this valuation — the return on equity around 23 percent and the perfect Piotroski score prove that operationally, almost everything is going right. Except: a P/E around 53 leaves no room for “almost.” One more year like 2024 — and the stock would optically trade at 150 times earnings. Ownership, to close: institutions hold the large majority (recently 11 funds adding versus 6 trimming), insiders just under 2 percent (data as of July 10, 2026); the share count fell from 16.8 million (2023 average) to 15.6 million thanks to the old buybacks.
Opportunities and risks at a glance
What speaks for MYR Group:
- Structural tailwind with documentary evidence: the company’s own quarterly report names the power hunger of AI data centers, electrification and reshoring as investment drivers for customers in both segments (10-Q as of March 31, 2026, “Outlook”) — and the C&I contract list begins with “data centers.”
- Record momentum in the business, not just the stock: Q1 2026 up 20 percent to $1,000.4 million in revenue, 13.4 percent gross margin, net income doubled, both segments at record operating margins (9.7/8.1 percent).
- A textbook balance sheet: $163.2 million in cash against $9.4 million of remaining debt (March 31, 2026), the $490 million credit facility nearly untouched ($460.5 million available), Altman-Z around 6.9, Piotroski 9 of 9, 2025 operating cash flow of $326.6 million.
- Proven self-repair: the troubled 2024 solar projects were finished rather than dragged out; 2025 became the record year, and the 2024/2025 capital returns ($150 million of buybacks at prices around $117) look excellently timed in hindsight.
- 135 years of repeat business: utility relationships under master service agreements, emergency storm restoration work, more than 300 IBEW locals as a skilled-labor pipeline — entry barriers no startup can replicate.
What speaks against it:
- The valuation prices in perfection: trailing P/E around 53 (about 42 on current-year estimates), price-to-book around 11, up 171 percent in twelve months — for a project business with a 3 to 5 percent net margin (data as of July 10, 2026).
- Fixed-price asymmetry: 57 percent of revenue at fixed prices (C&I: 84.5 percent), cost overruns “may not be recoverable”; even in the record year 2025, negative estimate changes cost 2.4 gross margin points (10-K for 2025).
- 2024 as proof of the drop height: clean energy losses (contract disputes, inefficiencies, weather) wiped out 5.5 percentage points of T&D margin — group net income fell 67 percent. The mechanism (cost-to-cost estimates) is unchanged.
- Backlog without proof of an explosion: $2.84 billion (+7.6 percent), less than nine months of revenue coverage, T&D backlog down in Q1 2026; the 10-K itself warns against reading backlog as a stand-alone indicator.
- The captains have stopped buying: the $75 million repurchase program expired unused on February 4, 2026, the last buybacks averaged $117.33; no dividend, insiders recently at zero purchases and one sale (data as of July 10, 2026). Plus wage rounds ahead: the collective bargaining agreements expire between 2026 and 2028.
A human conclusion
Back to the anchor trap from the opening. Both reflexes — “too expensive, the train has left” and “quick, get on before it pulls away” — share the same construction flaw: they anchor on the price. The filings offer a better anchor, and it is less comfortable than either reflex. MYR Group is not an inflated story stock but one of America’s most solid trade businesses: 135 years on the grid, practically debt-free, a record quarter, a perfect Piotroski score — and the power hunger of AI data centers stands as a demand driver in the company’s own quarterly report, not in some promoter’s pitch deck. But the same stack of filings documents what the price currently ignores: a business model in which 57 percent of revenue runs at fixed prices and one rainy solar year can cost two thirds of the profit; a backlog growing a sober 7.6 percent while the stock nearly tripled; and a leadership team that last considered its own shares worth buying at $117 — and let its new repurchase program lapse without a word at today’s prices. So the honest question for you is not “Is MYR Group a good company?” — it is, the evidence stands above. The question is: do you want to pay 53 times an earnings stream that demonstrably shrank to a third in a single bad project year? If yes, do it with open eyes and a plan for the day a 10-Q once again speaks of “significant estimate changes.” If no, the stock stays on the watchlist — quality does not disappear just because you wait for a better price. What you make of it is your decision. And that is exactly as it should be.
Sources
All original documents used in this analysis — for your own reading:
- MYR Group Inc. — SEC annual report 10-K for 2025 (filed February 25, 2026)
- MYR Group Inc. — SEC annual report 10-K for 2024 (filed February 26, 2025; clean energy project losses)
- MYR Group Inc. — SEC annual report 10-K for 2023 (filed February 28, 2024; 2021/2022 comparison figures)
- MYR Group Inc. — SEC quarterly report 10-Q as of 03/31/2026 (filed April 29, 2026)
- Complete SEC filing history of MYR Group Inc.: EDGAR overview (sec.gov)
- Quarterly revenue series: SEC XBRL data (companyconcept “RevenueFromContractWithCustomerExcludingAssessedTax,” CIK 0000700923), retrieved July 17, 2026.
- Fundamental data (metrics, quarterly series, valuation, analyst estimates; data as of July 10, 2026), cross-checked against the SEC filings.
- Screener and rating data: in-house stock scanner (data as of July 10, 2026; momentum/stage-2 run of July 17, 2026).
Transparency & disclaimer: This analysis is a journalistic contextualization of publicly available information and is not investment advice, not a financial analysis in the regulatory sense, and not a solicitation to buy or sell securities. Stock investments carry substantial risks up to and including total loss. All information without guarantee; the data cut-off is noted in the text. The author holds no position in MYR Group shares at the time of publication.
Our Bottom Line at a Glance
- Demand & order book positive
- The quarterly report (10-Q as of 03/31/2026) explicitly names AI data centers, electrification and reshoring as investment drivers for customers; Q1 2026 grew 20 percent to $1,000.4 million — only the second billion-dollar quarter in company history. The $2.84 billion backlog (+7.6 percent), however, grows far more slowly than the share price.
- Profitability & balance sheet positive
- Record year 2025 ($118.4 million net income, $326.6 million operating cash flow), gross margin recovered from 8.6 to 11.6 percent and 13.4 percent in Q1 2026; $163.2 million cash against $9.4 million remaining debt, Piotroski 9 of 9, Altman-Z around 6.9, return on equity around 23 percent (data as of July 10, 2026).
- Project & fixed-price risk negative
- 57 percent of revenue at fixed prices (C&I: 84.5 percent), cost overruns per the 10-K "may not be recoverable"; 2024 proved the drop height: clean energy losses erased 5.5 percentage points of T&D margin and group net income fell 67 percent. Even in the record year 2025, negative estimate changes cost 2.4 gross margin points; the collective bargaining agreements (85 percent of craft workers) expire between 2026 and 2028.
- Valuation negative
- P/E around 53 trailing and around 42 on the current-year estimate, price-to-book around 11, price-to-sales around 2 on a 3 to 5 percent net margin (data as of July 10, 2026) — historically high multiples for a cyclical project business; the company's own last buybacks averaged $117.33 (2025).
- Market technicals & capital allocation neutral
- A stage-2 uptrend, relative strength of 95, 22 scanner hits, institutional accumulation (11 adding, 6 trimming) and only about 3 percent to the all-time high meet a management team that let its $75 million repurchase program expire unused on February 4, 2026, and pays no dividend — the trend strength is real, and so is the leadership's price verdict on its own stock (10-K for 2025, Item 5).
MYR Group is the rare combination of century-old trade business and momentum leader: on the grid since 1891, practically debt-free, a record quarter with 20 percent growth, Piotroski 9 of 9 — and the power hunger of AI data centers stands as a demand driver in its own quarterly report. Against that stand a business model that rests 57 percent on fixed prices and lost two thirds of its profit in a single solar year (2024), a backlog growing at a merely normal pace, and a share price at 53 times trailing earnings — a level at which the leadership preferred to let its own buyback program lapse. Whoever invests here buys first-class execution at a price that assumes flawlessness. Not investment advice.
What Our Rating Means
- If you don't own the stock
- As long as the question raised in the bottom line stays open, we see no basis for an entry.
- If you hold it in your portfolio
- Our findings offer no acute reason to sell — the checkpoints named remain decisive.
A journalistic assessment by our editorial team at the time of the deep dive, based on public sources — not investment advice and not a solicitation to buy or sell. Your personal circumstances (investment goals, risk capacity, taxes) cannot be taken into account. What our categories mean, how verdicts are formed, and what conflicts of interest exist →
Worth Noting
- MYRG landed on the research list via the momentum/stage-2 run of our in-house stock scanner on July 17, 2026; the 22 hits and all metrics carry the July 10, 2026 data cut.
- Scanner metrics (P/E, P/B, Piotroski, Altman-Z, fundamental grade) use trailing twelve-month figures; the 2024 margin slump has rolled out of them, and a future project accident is naturally not yet in them.
- Price and valuation figures dated July 10, 2026 (about $487 per share, about $7.8 billion market value); analyses are evergreen, daily prices are not a buy argument.
Frequently Asked Questions
MYR Group Inc. (Nasdaq: MYRG) of Thornton, Colorado, is an electrical specialty contractor that has worked on power grids since 1891. Its Transmission & Distribution segment builds and maintains high-voltage lines, substations and distribution networks (2025 revenue: $2.00 billion), while Commercial & Industrial handles the electrical fit-out of data centers, airports, hospitals and factories ($1.66 billion). Total 2025 revenue: $3.66 billion, net income $118.4 million.
Three forces work together: first, the quarterly report (10-Q as of March 31, 2026) explicitly names rising electricity demand from AI data centers, electrification and reshoring as investment drivers for its customers. Second, after the 2024 margin slump MYR delivered five successively stronger quarters — most recently 20 percent revenue growth and doubled net income. Third, the market bought the recovery: up 171 percent in twelve months to near the all-time high (data as of July 10, 2026).
Losses on clean energy (mostly solar) projects cost the T&D segment 5.5 percentage points of operating margin, per the annual report (10-K for 2024) — caused by contractual disputes, labor and project inefficiencies, higher costs and unfavorable weather. Group net income collapsed from $91.0 million to $30.3 million even though revenue fell only 8 percent. By 2025 the projects were finished, and a record year followed.
Fixed-price contracts accounted for 57.0 percent of 2025 revenue — and 84.5 percent in the data center-heavy C&I segment. The annual report (10-K for 2025) warns that cost overruns "may not be recoverable." Because profits are booked during construction under the cost-to-cost method, based on estimates, troubled projects can erase previously reported profits retroactively — even in the record year 2025, negative estimate changes cost 2.4 gross margin points.
Very solid: as of March 31, 2026, $163.2 million in cash stood against just $9.4 million of remaining debt, and $460.5 million of the $490 million credit facility was available. Equity was $702.8 million, and 2025 operating cash flow reached $326.6 million. The Piotroski F-Score is a perfect 9 of 9 and the Altman-Z around 6.9 (data as of July 10, 2026) — far outside any danger zone.
By classic yardsticks, yes: the trailing price-to-earnings ratio is around 53 and price-to-book around 11 (data as of July 10, 2026) — historically high for a contractor with a 3.2 percent net margin (2025). On the current-year analyst estimate of about $11.47 per share, the P/E drops to roughly 42. For context: the company's own last buybacks (2025) ran at an average of $117.33 per share.
MYR Group pays no dividend and, per its quarterly report, does not expect to. It repurchased $75 million of stock in each of 2024 and 2025 (average prices of $116.54 and $117.33). The new $75 million program approved in July 2025, however, expired on February 4, 2026, without a single share bought (10-K for 2025, Item 5) — with the stock nearly tripled, management held back.
Found an error?
Did you spot a factual error, an outdated number, or a typo in this deep dive? Let us know briefly — your report goes straight to the editorial team.