Microsoft Stock: Profit Grew 31 Percent — Free Cash Flow Grew 2.8 Percent
Microsoft earned $98.0 billion in the nine months ended March 31, 2026, up 31 percent from a year earlier. Free cash flow — the money left after every investment — went from $46.0 billion to $47.3 billion, a rise of 2.8 percent. In between sit $80.1 billion of datacenter spending, a $4.5 billion book gain from the dilution of the OpenAI stake, and $62.9 billion of finance lease liabilities that now exceed every bond the company has issued. We read the filings line by line — and follow the profit to see where it goes before it reaches a shareholder.
 Thomas Mücke
Founder & Publisher
Thomas Mücke
Founder & Publisher
Chart
Interactive price chart (TradingView).
Note: pure fact-based analysis, not investment advice and not a solicitation to buy or sell. All figures without guarantee.
The trap is called familiarity
Let us make a deal. Before we talk about Microsoft, I will admit that I fell into this trap myself, and you probably have too. It is called familiarity, and it works like this: when a company's name means nothing to us, we read its filings with tweezers. When a company makes the software we open every morning, has risen for forty years and ranks among the five most valuable businesses on earth, we skim the headline — "record profit" — and put the report down.
That is exactly where it gets interesting. Because Microsoft's latest quarterly report to the U.S. securities regulator, the SEC, contains a headline and a second number that nobody puts on a front page. The headline: in the nine months ended March 31, 2026, net income rose 31 percent to $98.0 billion. The second number: free cash flow — the money genuinely left over after every investment — went from $46.0 billion to $47.3 billion. That is 2.8 percent.
Remember this tension, because it runs through every chapter: Microsoft's profit is growing faster than it has in years — but the money that ends up freely available is barely growing at all. In between sit billions of dollars of datacenters. Let us read where the difference comes from.
Table of contents
- What Microsoft actually does
- How the stock landed on our desk
- The numbers over the years — honestly appraised
- What the filings say — the uncomfortable truths
- Valuation: what you pay for this company
- Opportunities and risks at a glance
- A human conclusion
- Sources
What Microsoft actually does
Microsoft sells three things at heart, and the annual report sorts them into three segments. First, productivity software on subscription: Microsoft 365 with Word, Excel, Teams and Outlook, plus LinkedIn and the business software Dynamics. Second, cloud infrastructure: Azure — rented computing power and storage inside Microsoft's datacenters — alongside the classic server products. Third, the consumer side: Windows, devices, Xbox and search advertising.
In the nine months ended March 31, 2026, the $241.8 billion of revenue split as follows: Productivity and Business Processes $102.1 billion, Intelligent Cloud $98.5 billion, More Personal Computing $41.2 billion. The largest single product line is server products and cloud services at $92.3 billion (prior-year period $70.6 billion), followed by Microsoft 365 commercial at $74.1 billion.
An everyday image for Azure, in case the word cloud still feels vague: rather than putting servers in their own basement, companies rent computing power from Microsoft — the way you can lease a car instead of buying one. You pay for what you use; Microsoft handles hardware, power and maintenance. Which is precisely why Microsoft has to pay for that hardware, that power and those buildings first — years before the rental income arrives in full. That is the economic core of this analysis.
Microsoft's fiscal year ends on June 30. "Fiscal year 2026" therefore covers July 2025 through June 2026, not calendar 2026. Comparing Microsoft with Alphabet or other calendar-year reporters shifts everything by six months — an error that appears in comparison tables surprisingly often. One note on currency: fiscal year 2026 ended June 30, 2026, and the corresponding annual report (Form 10-K) had not been filed as of July 29, 2026. The most recent complete filing is therefore the quarterly report (Form 10-Q) as of March 31, 2026, filed April 29, 2026. Every nine-month figure in this article comes from it.
How the stock landed on our desk
This time it was not a scanner hit. Our stock scanners filter on metrics — cheap valuation, high Piotroski score, momentum — and that is exactly why the best-known heavyweights fall through systematically: they are rarely cheap. When we counted on July 28, 2026 how many of the 100 largest U.S. stocks by market value already had a deep-dive analysis here, 88 did not. Microsoft was the largest of them, ranked fifth at roughly $2,890 billion of market value (data as of July 28, 2026).
That is an honest statement about our own method. A scanner built to find bargains does not find blue chips. Follow the scanners alone and you end up with a portfolio full of semiconductor laggards and none of the companies that carry the index. So we are working the list from the top down — starting with the one whose filings give the most.
The numbers over the years — honestly appraised
Start with what genuinely impresses. In fiscal year 2025 (ended June 30, 2025), Microsoft grew revenue 15 percent to $281.7 billion, operating income 17 percent to $128.5 billion and net income 16 percent to $101.8 billion. For comparison, the two preceding years: $245.1 billion of revenue and $88.1 billion of profit in fiscal 2024, $211.9 billion and $72.4 billion in fiscal 2023.
An operating margin of 45.6 percent means, in plain terms: of every $100 of revenue, $45.60 remains as operating profit. For context, a solid industrial company sits at 10 to 15 percent, a very good one at 20. Microsoft is exceptional on this measure, and has been for years.
The cloud business grew strongly in fiscal 2025 as well: Microsoft Cloud reached $168.9 billion (up 23 percent) after $137.7 billion in fiscal 2024 and $111.6 billion in fiscal 2023; Azure alone grew 34 percent. In the nine months ended March 31, 2026 it accelerated: Azure up 40 percent, Microsoft Cloud at $155.1 billion against $122.2 billion in the prior-year period.
Now the second set of numbers — the same years, but the cash flow statement. This is where the tension first shows:
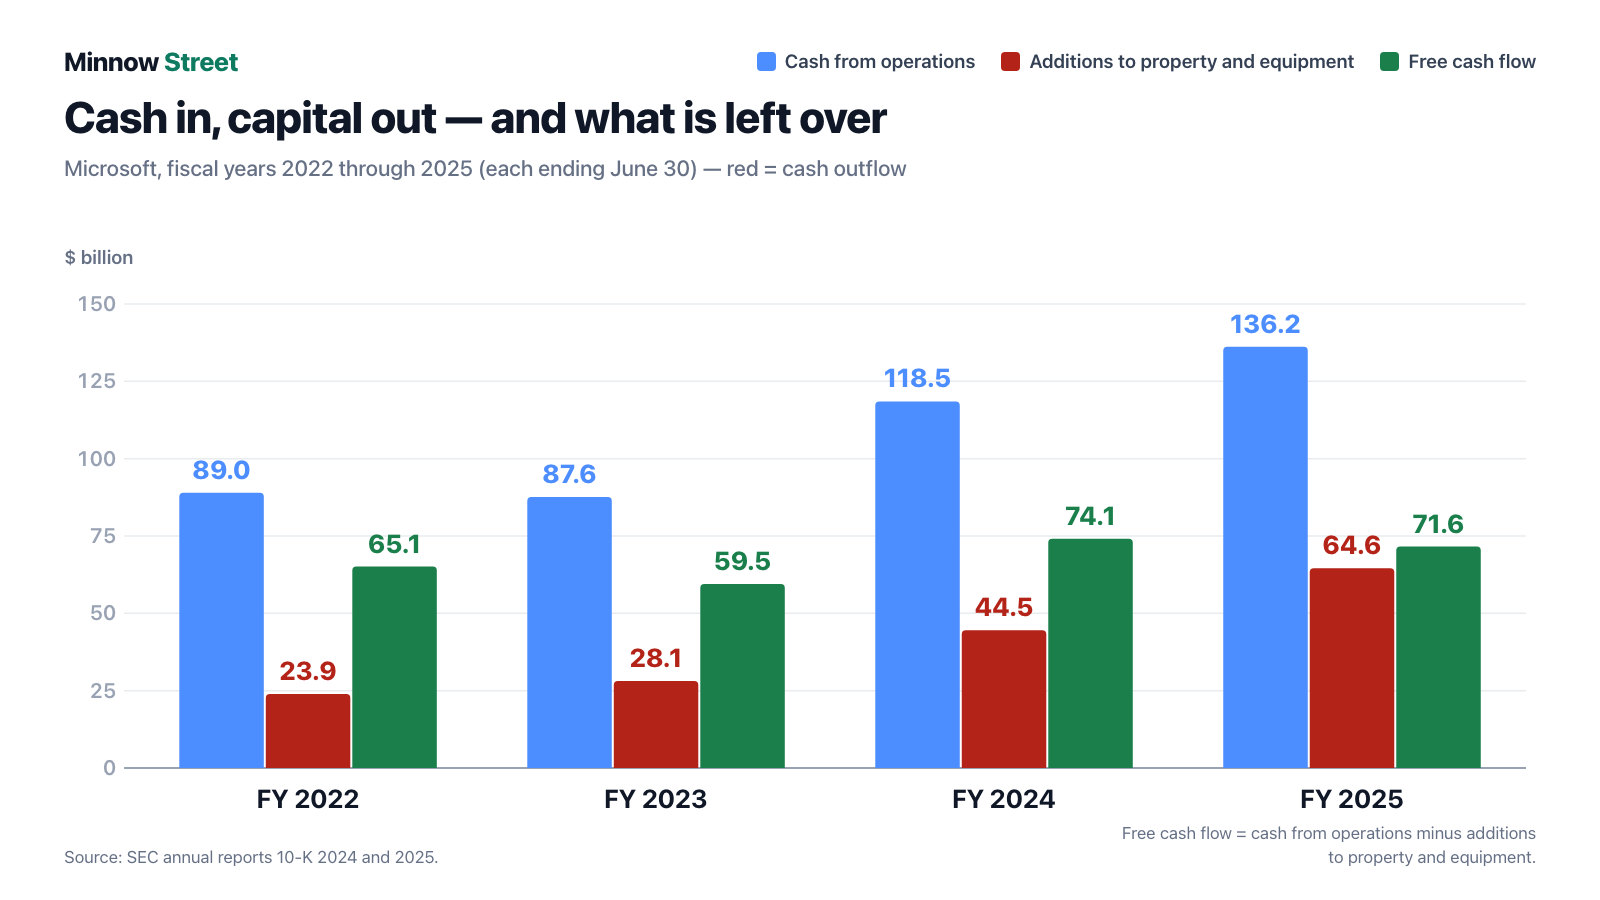
The figures in detail, all from the Form 10-K filings for fiscal 2024 and 2025:
| Fiscal year (ended June 30) | Cash from operations | Additions to property and equipment | Free cash flow |
|---|---|---|---|
| 2022 | $89.0 billion | $23.9 billion | $65.1 billion |
| 2023 | $87.6 billion | $28.1 billion | $59.5 billion |
| 2024 | $118.5 billion | $44.5 billion | $74.1 billion |
| 2025 | $136.2 billion | $64.6 billion | $71.6 billion |
Read the last column once more. Profit rose 16 percent in fiscal 2025 — free cash flow fell 3.3 percent. That is the first decline in this series, and it is not an outlier but the start of a pattern. As a share: in fiscal 2022 capital spending consumed 27 percent of operating cash flow; in fiscal 2025 it was 47 percent.
What the filings say — the uncomfortable truths
Uncomfortable truth no. 1: $80.1 billion went into concrete, servers and cable in nine months
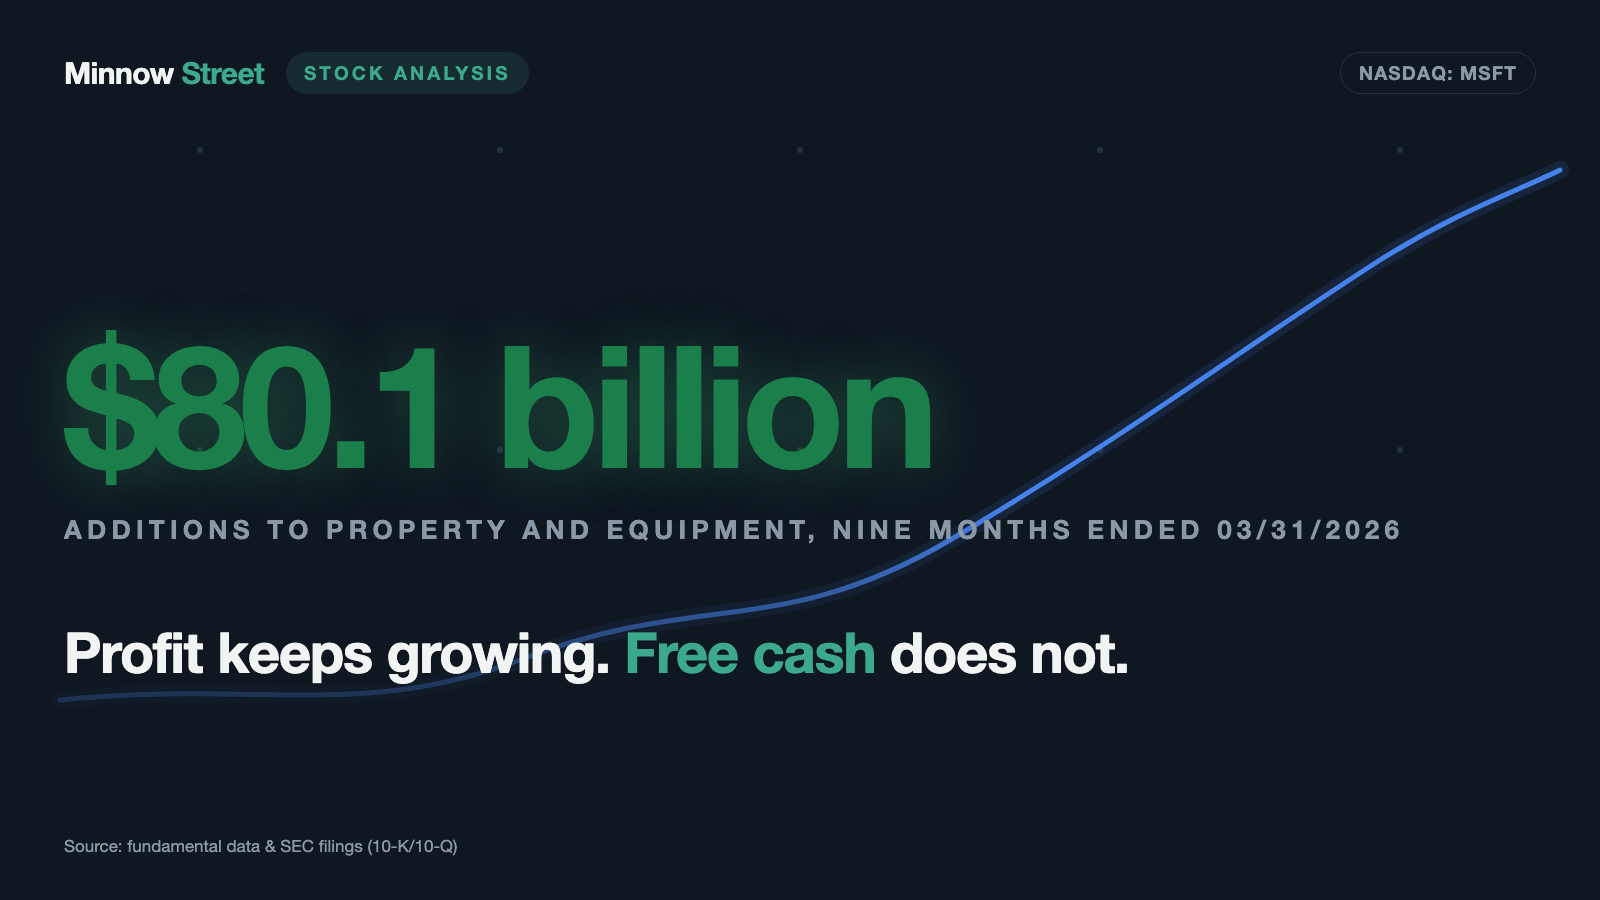
In fiscal year 2026 the pattern did not soften; it intensified. In the nine months ended March 31, 2026, $127.5 billion came in from operations — $34.0 billion more than in the prior-year period. Over the same nine months, $80.1 billion flowed out into property and equipment, against $47.5 billion a year earlier. What was left: $47.3 billion instead of $46.0 billion.
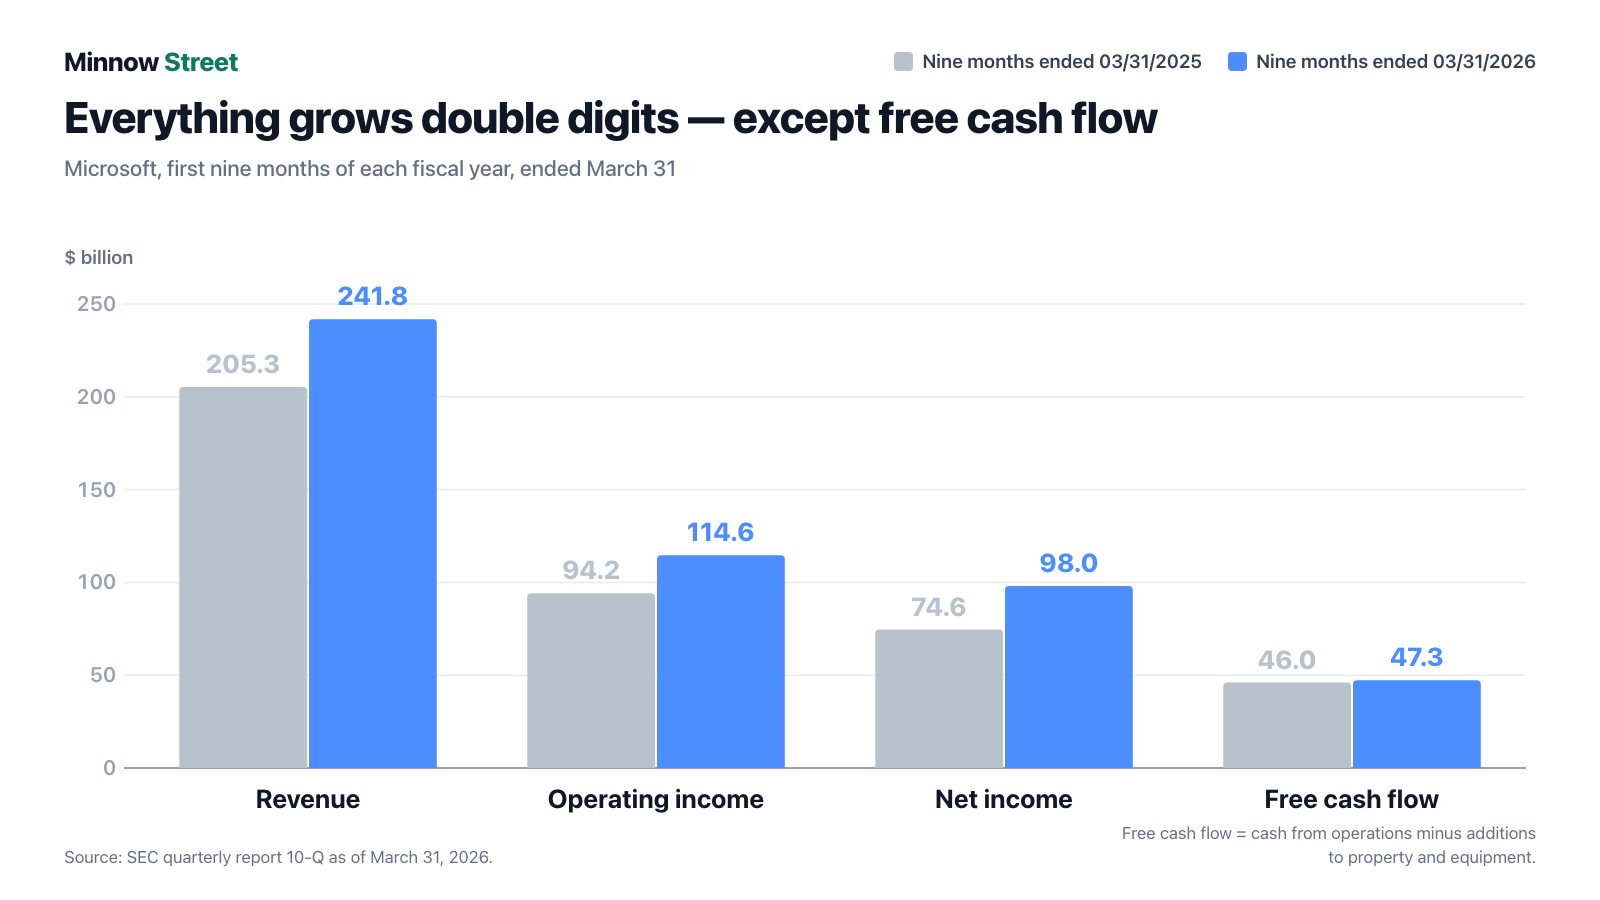
The four comparisons in plain figures, each for the nine months ended March 31: revenue rose from $205.3 billion to $241.8 billion, operating income from $94.2 billion to $114.6 billion, net income from $74.6 billion to $98.0 billion — and free cash flow from $46.0 billion to $47.3 billion. Free cash flow here is simply cash from operations less additions to property and equipment; it is the only one of the four that measures what is genuinely left to spend.
The balance sheet shows where the money went. Property and equipment rose net from $205.0 billion (June 30, 2025) to $283.2 billion (March 31, 2026). In detail, each at cost: "servers, network equipment, and software" grew from $132.8 billion to $190.9 billion, "buildings and improvements" from $137.9 billion to $172.3 billion. In nine months Microsoft capitalized roughly $96 billion of datacenter assets — more than the entire annual revenue of most listed companies anywhere.
Microsoft itself writes what this means for margins:
"The investments we are making in cloud and AI infrastructure and devices will continue to increase our operating costs and may decrease our operating margins."
— Microsoft Corporation, SEC quarterly report 10-Q as of March 31, 2026, Item 2 (MD&A), "Economic Conditions, Challenges, and Risks"
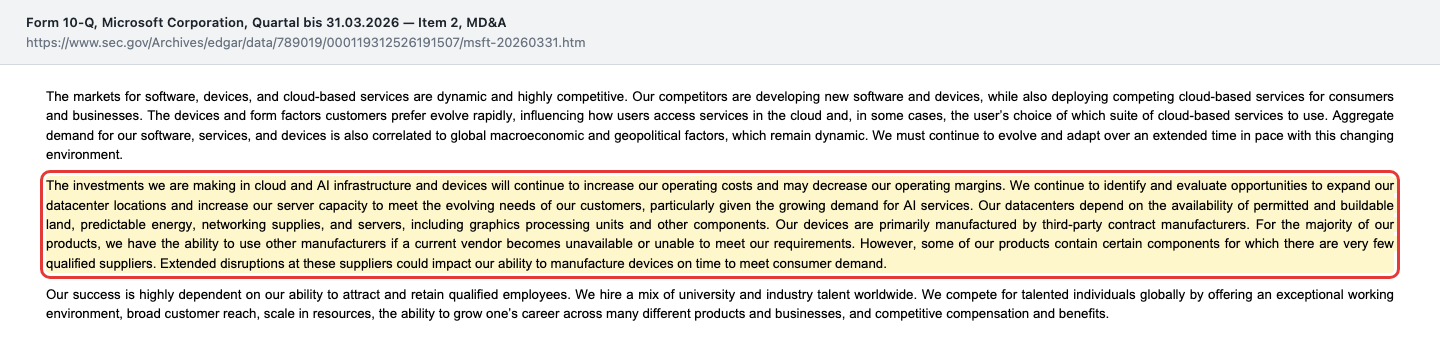
And that warning is not boilerplate — it is already visible in the segment numbers. In Intelligent Cloud, revenue grew 29 percent over nine months to $98.5 billion while cost of revenue grew 45 percent to $41.0 billion. Microsoft Cloud gross margin fell to 67 percent across the nine months and to 66 percent in the quarter ended March 31, 2026. The filing gives the reason verbatim: "continued investments in AI infrastructure and growing AI product usage."
Remember the mechanism: growth that has to be built is never free. It appears in the investing section first and in the income statement years later.
Uncomfortable truth no. 2: $4.5 billion of the increase was not earned — it was revalued
The $98.0 billion of nine-month net income is not quite what it looks like. A single line in non-operating income changed sign: "Other income (expense), net" went from negative $3.194 billion a year earlier to positive $7.253 billion. That is a $10.4 billion swing in a line item that normally collects interest and minor valuation effects.
The note explains where it came from: over the same nine months, the OpenAI investment contributed $5.9 billion of net gains to that line, after costing $2.7 billion in the prior-year period. After tax, $4.5 billion remains, or $0.60 per share. And the decisive clause sits right beside it: the gains relate "primarily … to the dilution gain from the OpenAI Recapitalization" — they come from a dilution.
In plain language: Microsoft's stake in OpenAI got smaller in the restructuring. Because the remaining, smaller stake was valued higher than the old, larger one, accounting produces income. Not a single dollar moves. Picture your share in a community garden falling from 30 to 27 percent — while the garden is revalued so far upward that your smaller share is worth more than your larger one was. On paper you have grown richer. In your wallet, nothing has changed.
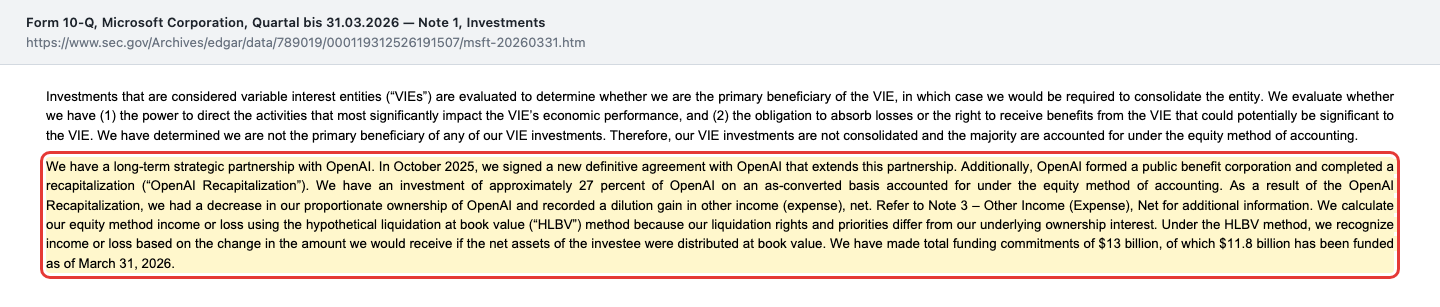
The filing states the size of the stake:
"We have an investment of approximately 27 percent of OpenAI on an as-converted basis accounted for under the equity method of accounting. As a result of the OpenAI Recapitalization, we had a decrease in our proportionate ownership of OpenAI and recorded a dilution gain in other income (expense), net."
— Microsoft Corporation, SEC quarterly report 10-Q as of March 31, 2026, Note 1 "Accounting Policies," Investments
To be fair: Microsoft does not hide this — quite the opposite. In the same filing the company presents its own reconciliation and removes the OpenAI effect. Adjusted, nine-month net income is $93.5 billion instead of $98.0 billion, the increase 22 percent instead of 31, and adjusted diluted earnings per share $12.54 instead of $13.14. That is a level of candor you rarely see — and the reason this truth is uncomfortable rather than alarming. It is simply that the headlines carried 31 percent, not 22.
A second figure from the same note belongs here. Microsoft has made total funding commitments of $13.0 billion to OpenAI, of which $11.8 billion had been funded as of March 31, 2026. The balance sheet line "equity and other investments" jumped accordingly, from $15.4 billion to $33.7 billion. That stake is simultaneously Microsoft's largest strategic bet and the most volatile line in its income statement.
Uncomfortable truth no. 3: the largest financial obligation is not filed under debt
Look up Microsoft's leverage and you find a reassuring number: $40.3 billion of bond debt as of March 31, 2026 — less than the $43.2 billion at June 30, 2025. A company paying down debt while investing furiously. It sounds too good, and it is.
Six notes further on, under "Leases," sits the larger number: $62.9 billion of finance lease liabilities. Nine months earlier, at June 30, 2025, the figure was $46.2 billion. That is $16.8 billion added in nine months, while bond debt fell by $2.9 billion.
A finance lease is economically a purchase in installments: Microsoft uses the datacenters as if it owned them, carries them as property and equipment ($77.6 billion at cost, up from $53.9 billion at June 30, 2025) and pays fixed instalments with interest for years. Undiscounted, those future payments total $84.6 billion, of which $57.0 billion falls due only after fiscal year 2030. The weighted average remaining lease term is 13 years and the weighted average discount rate 4.4 percent. The filing names the effect: interest expense rose to $2.212 billion over the nine months, "primarily due to higher finance lease interest expense."
Let there be no misunderstanding: for a company with $414.4 billion of equity and $114.6 billion of nine-month operating income, an interest bill of $2.2 billion is trivial. This is not a leverage problem. It is a perception problem. Read only the line marked "debt" and you see $40.3 billion — and miss the $62.9 billion one note over, which is growing faster than anything else on the balance sheet.
Uncomfortable truth no. 4: the cash pile is shrinking while profit rises
One last look at the balance sheet, because it ties the three previous points together. Cash and short-term investments fell from $94.6 billion (June 30, 2025) to $78.3 billion (March 31, 2026) — down $16.3 billion over nine months in which Microsoft earned $98.0 billion.
Line the outflows up and it becomes clear: $80.1 billion of capital expenditure, $19.7 billion of dividends paid, $17.7 billion of share repurchases (as recorded in the cash flow statement; measured by shares bought back it was $13.3 billion for 27 million shares) and $3.0 billion of debt repayment — $120.5 billion in all, against $127.5 billion of cash from operations. What the business brings in is impressive; it simply no longer covers everything at once, and the remainder came out of the securities portfolio.
Customer money collected in advance also declined: unearned revenue fell from $67.3 billion to $53.7 billion. Part of that is seasonal — Microsoft's revenue is, per the filing, "generally higher in the fourth quarter of our fiscal year," the April-to-June window when many multi-year contracts are signed. Which is exactly why any extrapolation deserves caution: annualize nine months and you understate the closing quarter.
The counter-check: is this a peak profit that will not repeat?
We ask this on every analysis, and at Microsoft the answer is: partly yes. Of the $98.0 billion of nine-month profit, $4.5 billion is a one-off book gain that by definition will not repeat — the OpenAI recapitalization happens once. The adjusted $93.5 billion is the sturdier base.
On the operating side, little suggests a peak: operating margin rose to 47.4 percent (prior-year period 45.9 percent), growth comes from subscriptions and consumption billing rather than one-time sales, and the order book has never been larger. The more honest risk path runs not through revenue but through depreciation: accumulated depreciation on property and equipment rose from $93.7 billion to $111.7 billion, and the "depreciation, amortization, and other" line in the cash flow statement went from $20.1 billion to $27.5 billion over nine months. Every new server hall will weigh on future profits long before it is fully utilized. For the other side of that same equation — the chips Microsoft is installing at scale — see our Nvidia analysis.
The counterweight: $627 billion already ordered
It would be unfair to stop here, because the same page of the filing carries the number that justifies the whole mountain of capital spending:
"Commercial remaining performance obligation increased 99% to $627 billion."
— Microsoft Corporation, SEC quarterly report 10-Q as of March 31, 2026, Item 2 (MD&A), "Highlights"

Commercial remaining performance obligation is the commercial order book — revenue already contracted but not yet delivered. For scale: $627 billion is more than twice the entire fiscal 2025 revenue of $281.7 billion. If you wonder why Microsoft is spending $80 billion in nine months, that is the answer. The capacity is sold before it is built.
Valuation: what you pay for this company
Microsoft was worth roughly $2,890 billion on the market in late July 2026 (data as of July 28, 2026). On trailing earnings per share of $17.12 that works out to a price-to-earnings ratio of about 23, a price-to-sales ratio of about 9 and a price-to-book ratio of about 6.8. For context: a P/E of 23 sits in the middle of the range for a company with a 47 percent operating margin and double-digit growth — well above a utility, well below what growth stocks fetch in euphoric phases.
More interesting than the P/E right now is the view through free cash flow. Take the nine-month figure of $47.3 billion and do not annualize it — the closing quarter is seasonally the strongest but also investment-heavy — and the market is paying roughly forty times the last full-year free cash flow of $71.6 billion. That is the price of the bet: a buyer today is paying for the $80 billion of capital spending to come back as cash later.
The professionals see it far more warmly. Sixty-one estimates produced an average target price of roughly $557 as of July 28, 2026, with 41 "strong buy" ratings, 15 "buy," 5 "hold" and no sell recommendation at all. A chorus without a single dissenting voice is rarely an independent second opinion — among the largest index heavyweights it is close to the normal state of affairs.
One dated anchor from the filings themselves, because it is more honest than any daily price: in the quarter ended March 31, 2026, Microsoft repurchased its own shares at an average of $465.49 in January 2026, $402.72 in February and $391.53 in March. The company itself bought at very different prices within a single quarter.
Opportunities and risks at a glance
What speaks for Microsoft:
- An order book of $627 billion as of March 31, 2026, up 99 percent — more than twice fiscal 2025 revenue.
- An operating margin of 47.4 percent in the nine months ended March 31, 2026, on 18 percent revenue growth.
- Azure grew 40 percent over the nine months, after 34 percent in fiscal 2025 — growth accelerated.
- A balance sheet with $414.4 billion of equity, $78.3 billion of liquidity and only $40.3 billion of bond debt.
- Unusual transparency: Microsoft voluntarily strips its own OpenAI book gain out of the reported result.
- Capital returns: $19.7 billion of dividends and $13.3 billion of buybacks in nine months, with $44.0 billion of buyback authorization remaining.
What speaks against it:
- Free cash flow grew only 2.8 percent over nine months and actually fell in fiscal 2025 ($71.6 billion after $74.1 billion).
- $80.1 billion of capital spending in nine months ties up capital whose return builds only over years.
- Microsoft Cloud gross margin fell to 66 percent in the quarter; Intelligent Cloud cost of revenue grew 45 percent against 29 percent revenue growth.
- $4.5 billion of the nine-month profit is a one-off, non-cash book gain from the OpenAI dilution.
- Finance lease liabilities of $62.9 billion are growing fast (up $16.8 billion in nine months) and sit outside the line marked "debt."
- Cash and short-term investments fell from $94.6 billion to $78.3 billion over nine months.
- The annual report for the fiscal year ended June 30, 2026 had not been filed as of July 29, 2026 — the complete picture of fiscal 2026 is still missing.
A human conclusion
Remember the familiarity trap from the opening? At Microsoft it has a particular punchline. Read the filings properly and you do not find the hidden catastrophe such analyses sometimes promise. You find an exceptionally profitable company that reports with unusual honesty — down to a voluntary reconciliation that makes its own profit look smaller.
What you also find is a shift that never makes a headline. Four years ago Microsoft kept roughly 73 cents of every dollar of operating cash as free cash. In fiscal 2025 it was 53 cents; over the nine months to March 2026, 37 cents. The rest goes into buildings, servers, cable and lease payments. Whether that turns out to be a magnificent investment or something people call overbuilding five years from now will not be settled on the profit line — it will be settled by whether those $627 billion of ordered revenue are actually delivered and paid.
That is the question you have to answer for yourself, and nobody can answer it for you. If you believe the capacity will be fully used at today's margins in five years, you are buying one of the best businesses in the world at a price that is not historically absurd. If you doubt it, you are looking at a company whose profit grows faster than the money left over from it. Both readings sit in the same document. What you make of it is your decision. And that is exactly as it should be.
Sources
- Microsoft Corporation, SEC quarterly report 10-Q as of March 31, 2026 (filed April 29, 2026) — income statement, balance sheet, cash flow statement, Note 1 (investments/OpenAI), Note 3 (other income), Note 9 (debt), Note 12 (leases), Note 14 (stockholders' equity), Item 2 (MD&A) including the non-GAAP reconciliation
- Microsoft Corporation, SEC annual report 10-K for fiscal year 2025 (filed July 30, 2025) — Item 1 (business, headcount, Azure), Item 7 (MD&A), financial statements
- Microsoft Corporation, SEC annual report 10-K for fiscal year 2024 (filed July 30, 2024) — comparative figures for fiscal years 2022 through 2024
- SEC EDGAR, filing index for Microsoft Corporation (CIK 0000789019) — every filing dated on or after April 29, 2026 was reviewed; the 8-K reports of May 14, 2026 and June 5, 2026 concern board composition only and do not change the numbers
- Fundamental data (market value, valuation metrics, analyst consensus), data as of July 28, 2026
This analysis is a journalistic contextualization of publicly available information and is not investment advice. It is not a solicitation to buy or sell securities. Stocks can lose substantial value, up to and including the total loss of the capital invested. All figures come from the sources named above and carry their respective cut-off dates; filings published after the editorial deadline are not reflected. The author holds no position in the stock discussed at the time of publication.
Our Bottom Line at a Glance
- Demand and market position positive
- Commercial remaining performance obligation rose 99 percent to $627 billion as of March 31, 2026; Azure grew 40 percent over the preceding nine months and Microsoft Cloud reached $155.1 billion (prior year $122.2 billion). This is contracted revenue, not a statement of intent (10-Q as of March 31, 2026).
- Earning power positive
- Operating margin of 47.4 percent in the nine months ended March 31, 2026 (prior year 45.9 percent), net margin 40.5 percent, return on equity roughly 34 percent (data as of July 28, 2026). Even stripping out the OpenAI book gain, $93.5 billion of profit remains in nine months.
- Cash flow after investment negative
- Free cash flow grew only 2.8 percent in the nine months ended March 31, 2026 ($47.3 billion against $46.0 billion) while net income rose 31 percent. It had already fallen in fiscal year 2025: $71.6 billion after $74.1 billion. The cause is capital expenditure (FY 2025: $64.6 billion; nine months of FY 2026: $80.1 billion).
- Earnings quality neutral
- $4.5 billion of the $98.0 billion of net income in the nine months ended March 31, 2026 is a non-cash book gain from the dilution of the OpenAI stake. Microsoft discloses it transparently and removes it itself — the adjusted increase is 22 percent rather than 31 (10-Q as of March 31, 2026, "Non-GAAP Financial Measures").
- Balance sheet and leverage positive
- Stockholders' equity of $414.4 billion, cash and short-term investments of $78.3 billion and bond debt of $40.3 billion as of March 31, 2026. Even including $62.9 billion of finance leases, leverage stays low relative to earning power: $2.2 billion of interest expense in nine months against $114.6 billion of operating income.
- Margin risk neutral
- Microsoft Cloud gross margin fell to 66 percent in the quarter ended March 31, 2026; cost of revenue in Intelligent Cloud rose 45 percent over nine months against 29 percent segment revenue growth. Microsoft itself writes that its investments may decrease operating margins (10-Q as of March 31, 2026, Item 2).
Microsoft remains one of the most profitable companies on earth: a 47.4 percent operating margin, a $627 billion order book and a cloud business that grew 27 percent over nine months. The price of that sits in the same cash flow statement: $80.1 billion of capital expenditure in nine months, free cash flow that is effectively flat, and finance lease liabilities for datacenters that now exceed every bond the company has issued. On top of that comes a $4.5 billion book gain from the OpenAI dilution, which Microsoft strips out itself. Not investment advice.
What Our Rating Means
Quality confirmed
Business model, numbers and balance sheet hold up to our review. Whether the current price supports an entry is a separate question — it hangs on the price, not on the company.
The quality of the business is documented: a highly profitable core, $414.4 billion of equity, $78.3 billion of liquidity, no existential dependency on a single counterparty, no accounting or governance breach, and unusually candid reporting — Microsoft voluntarily strips its own OpenAI book gain out of the result. A buyer today is nonetheless betting that the $80.1 billion spent over the last nine months comes back as cash later; until it does, profit grows faster than the money actually left over. The decision is yours.
A journalistic assessment by our editorial team at the time of the deep dive, based on public sources — not investment advice and not a solicitation to buy or sell. Your personal circumstances (investment goals, risk capacity, taxes) cannot be taken into account. What our levels mean, how verdicts are formed, and what conflicts of interest exist →
Worth Noting
- Origin: ranking of the 100 largest U.S. stocks by market value (as of July 28, 2026); Microsoft ranked fifth and had no analysis yet.
- Data cut-offs: annual figures from the Form 10-K for fiscal year 2025 (filed July 30, 2025), nine-month figures from the Form 10-Q as of March 31, 2026 (filed April 29, 2026), valuation metrics as of July 28, 2026. The Form 10-K for fiscal year 2026, which ended June 30, 2026, had not been filed as of July 29, 2026.
- Easily confused: Microsoft's fiscal year ends June 30. "Fiscal year 2026" means July 2025 through June 2026 — not calendar 2026.
- Analyses are evergreen; a daily price is not a buy argument.
Frequently Asked Questions
Microsoft reports three segments. In the nine months ended March 31, 2026, Productivity and Business Processes (Microsoft 365, LinkedIn, Dynamics) generated $102.1 billion of revenue, Intelligent Cloud (Azure, server products) $98.5 billion, and More Personal Computing (Windows, devices, gaming, search advertising) $41.2 billion. The single largest product line is server products and cloud services at $92.3 billion.
On June 30. Fiscal year 2026 therefore covers July 2025 through June 2026, and fiscal year 2025 ended June 30, 2025. Comparing Microsoft with calendar-year reporters shifts the period by six months. The Form 10-Q as of March 31, 2026 covers the first nine months of fiscal year 2026; the annual report for fiscal 2026 had not been filed as of July 29, 2026.
Because investment is rising faster than operating cash flow. In the nine months ended March 31, 2026, $127.5 billion came in from operations (prior year $93.5 billion), while $80.1 billion flowed out into property and equipment (prior year $47.5 billion). What remained was $47.3 billion instead of $46.0 billion — a gain of 2.8 percent against 31 percent profit growth.
Roughly 27 percent on an as-converted basis, accounted for under the equity method, according to the Form 10-Q as of March 31, 2026. Microsoft has made total funding commitments of $13.0 billion, of which $11.8 billion had been funded as of March 31, 2026. Over the preceding nine months the stake produced $5.9 billion of book gains.
It is the commercial order book: contracted revenue that has not yet been recognized, including amounts already invoiced but not yet delivered. As of March 31, 2026 it stood at $627 billion, 99 percent more than a year earlier. It is the most reliable indication that demand for Microsoft's cloud services keeps rising.
Bond debt stood at $40.3 billion as of March 31, 2026, down from $43.2 billion at June 30, 2025. Larger now are the finance lease liabilities behind the datacenters: $62.9 billion, up from $46.2 billion. Against that sit $78.3 billion of cash and short-term investments and $414.4 billion of stockholders' equity.
By 40 percent — both in the quarter ended March 31, 2026 and across the preceding nine months, each against the prior-year period. In fiscal year 2025 the figure was 34 percent. At the same time, Microsoft Cloud gross margin fell to 66 percent for the quarter and 67 percent for the nine months; the filing cites investment in AI infrastructure as the reason.
Yes. The most recently declared quarterly dividend was $0.91 per share (declared March 10, 2026, payable June 11, 2026). In the nine months ended March 31, 2026, Microsoft paid $19.7 billion of dividends and repurchased $13.3 billion of its own stock. Of the $60 billion buyback program, $44.0 billion remained as of March 31, 2026.
Found an error?
Did you spot a factual error, an outdated number, or a typo in this deep dive? Let us know briefly — your report goes straight to the editorial team.