Amazon Stock: $90 Billion of Profit, $1.2 Billion Left Over — and $54 Billion of New Bonds
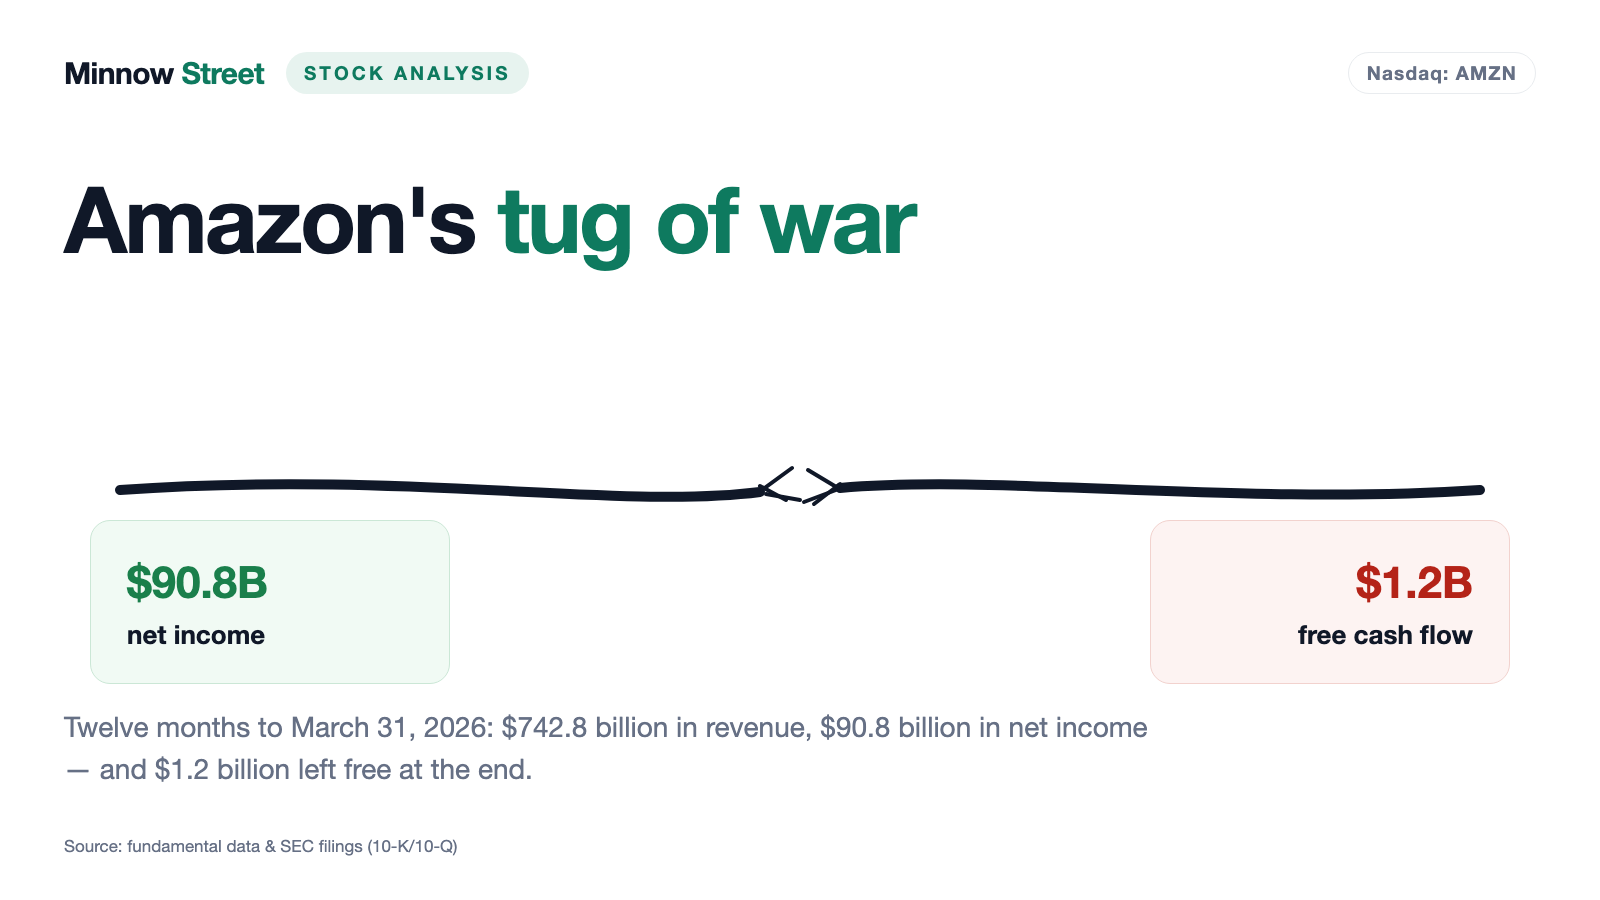
Over the twelve months ended March 31, 2026, Amazon booked $742.8 billion of revenue and $90.8 billion of net income. What was left after every investment: $1.2 billion. A year earlier it was $25.9 billion. In between sit $151.0 billion of datacenter spending, a bond debt that nearly doubled from $68.8 billion to $122.6 billion in a single quarter, and a $16.8 billion book gain on a stake in an AI company that buys its computing power from Amazon. We do the arithmetic on who earns the profit and who spends it.
 Thomas Mücke
Founder & Publisher
Thomas Mücke
Founder & Publisher
Chart
Interactive price chart (TradingView).
Note: pure fact-based analysis, not investment advice and not a solicitation to buy or sell. All figures without guarantee.
The cardboard box trap
Let us make a deal. Before we talk about Amazon, I will admit that I carried the wrong picture of this company around for years — and you may have too. The trap is called availability: we judge a business by the image that comes to mind fastest. With Amazon that image is the cardboard box at the front door. Parcel, Prime, two-day delivery, done.
Except the box earns almost nothing. Over the twelve months ended March 31, 2026, the North American retail business produced $437.6 billion of revenue — and $32.0 billion of operating income from it. The AWS cloud business, which no customer ever sees as a box, produced $137.0 billion of revenue and $48.2 billion of income. Roughly one fifth of revenue carries more than half of the profit.
And that one fifth is currently costing so much money that almost nothing is left at the end. Hold on to this tension, because it runs through every chapter: Amazon is earning more than ever — and keeping less of it than at any point in years. From $742.8 billion of revenue and $90.8 billion of profit over those same twelve months, $1.2 billion remained freely available. A year earlier the figure was $25.9 billion. Let us read the filings together and find out where the difference goes.
Contents
- What Amazon actually does
- How this stock landed on our desk
- The numbers over the years — given their due
- What the filings say — the uncomfortable truths
- Valuation: what you pay for this company
- Opportunities and risks at a glance
- A human conclusion
- Sources
What Amazon actually does
Amazon reports to the U.S. securities regulator, the SEC, in three segments. First, North America: everything that runs through the North America-focused stores — first-party retail, marketplace fees from third-party sellers, advertising, subscriptions. Second, International: the same for the rest of the world. Third, AWS, short for Amazon Web Services: rented compute, storage, databases and AI services for companies and public bodies.
An everyday image for AWS, in case "the cloud" still sounds vague: instead of putting servers in their own basement, companies rent computing power from Amazon — the way you might lease a car rather than buy one. You pay for what you use; Amazon handles hardware, power and maintenance. Which is exactly why Amazon has to pay for the hardware, the power and the buildings years before the rent arrives in full. That is the economic heart of this analysis.
Alongside the segments there is a second, finer breakdown of revenue. For the first quarter of 2026 it looked like this: online stores $64.3 billion, third-party seller services $41.6 billion, AWS $37.6 billion, advertising services $17.2 billion, subscription services $13.4 billion, physical stores $5.8 billion, other $1.6 billion. Advertising is the quiet rocket: up 24 percent on the prior-year quarter, and unlike a parcel, one more advert served costs practically nothing.
Germany is Amazon's second-largest single market. In calendar 2025, $45.9 billion of revenue was attributed to Germany, behind the United States at $489.7 billion and ahead of the United Kingdom at $43.2 billion (Form 10-K for 2025, Note 10).
One note on currency before we start doing arithmetic: Amazon's fiscal year is the calendar year. The most recent complete filing is the Form 10-Q as of March 31, 2026, filed April 30, 2026. The report for the second quarter of 2026 had not been filed as of July 29, 2026. Every figure in this analysis comes from the 2025 annual report, the quarterly report as of March 31, 2026, and the filings made after it.
How this stock landed on our desk
This time it was not a screener hit, and that is an honest disclosure about our own method. Our in-house stock scanners filter on ratios — cheap valuation, high Piotroski score, momentum. The best-known heavyweights fall through systematically, because they are rarely cheap. When we counted on July 28, 2026 how many of the 100 largest U.S. stocks by market value had a deep-dive analysis on this site, 88 did not. Amazon was the second largest of them, at number six.
So we are working the list from the top down. After Microsoft, Amazon is the second title in this series — and the two belong together anyway: they fight for the same customers in the same cloud market, and they face the same question of whether the billions poured into datacenters will ever come back as free cash. Anyone who read the Microsoft analysis will recognize the curve. At Amazon it is steeper.
The numbers over the years — given their due
Start with what genuinely impresses. Amazon grew revenue from $574.8 billion in 2023 through $638.0 billion in 2024 to $716.9 billion in 2025. Operating income over the same three years went from $36.9 billion through $68.6 billion to $80.0 billion, and net income from $30.4 billion through $59.2 billion to $77.7 billion. A company of this size more than doubling operating income in two years is rare.
What deserves as much attention is the turn abroad. The international segment still posted a loss of $2.656 billion in 2023; in 2024 it earned $3.792 billion, and in 2025 $4.750 billion. That is a real turnaround rather than an accounting effect — the margin moved from minus 2.0 percent to plus 2.9 percent.
And now the view the headlines rarely take: who actually earns the money?
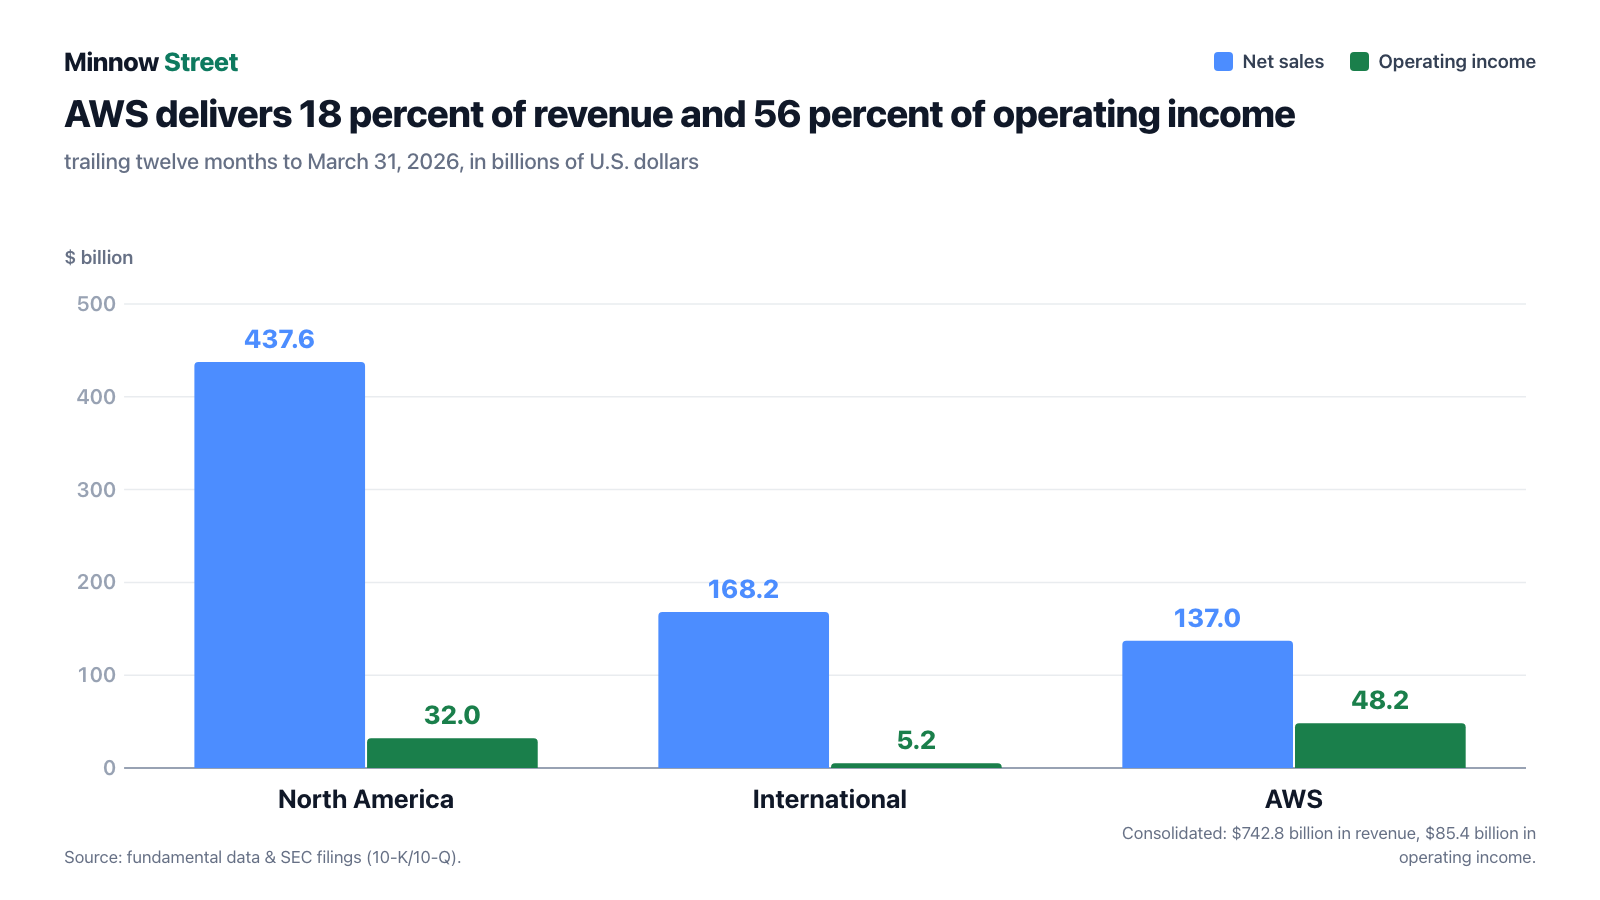
The underlying figures, all from the Form 10-Q as of March 31, 2026, Note 8, each as a trailing twelve-month total:
| Segment (12 months to 03/31/2026) | Net sales | Share | Operating income | Share |
|---|---|---|---|---|
| North America | $437.6 billion | 58.9 % | $32.0 billion | 37.5 % |
| International | $168.2 billion | 22.6 % | $5.2 billion | 6.0 % |
| AWS | $137.0 billion | 18.4 % | $48.2 billion | 56.4 % |
| Consolidated | $742.8 billion | 100 % | $85.4 billion | 100 % |
Do the last column yourself: $48.2 billion of $85.4 billion is 56 percent. This is not a one-quarter quirk but the rule — in 2023 the AWS share of operating income was 67 percent, in 2024 it was 58 percent, in 2025 it was 57 percent. Translated into an everyday image: Amazon is a datacenter operator with a very, very large mail-order business attached. The mail-order business brings customers, data and advertising inventory — the profit is made elsewhere.
One warning about arithmetic before we go on, because it matters repeatedly in this piece. Amazon's fourth quarter is seasonally the strongest: $213.4 billion of revenue in the fourth quarter of 2025 against $181.5 billion in the first quarter of 2026. Multiplying any single quarter by four talks you into a number. Which is why this analysis uses trailing twelve-month figures throughout.
What the filings say — the uncomfortable truths
Uncomfortable truth number 1: $742.8 billion of revenue left $1.2 billion free
Free cash flow is the most honest figure in any set of accounts: it measures what is actually left over after every investment. Amazon defines it itself — operating cash flow less purchases of property and equipment, net of proceeds from sales and incentives — and has reported it for years. That is the definition used throughout this piece; it is not mixed with other variants that include finance leases.
The last six quarters, each as a total of the preceding twelve months:
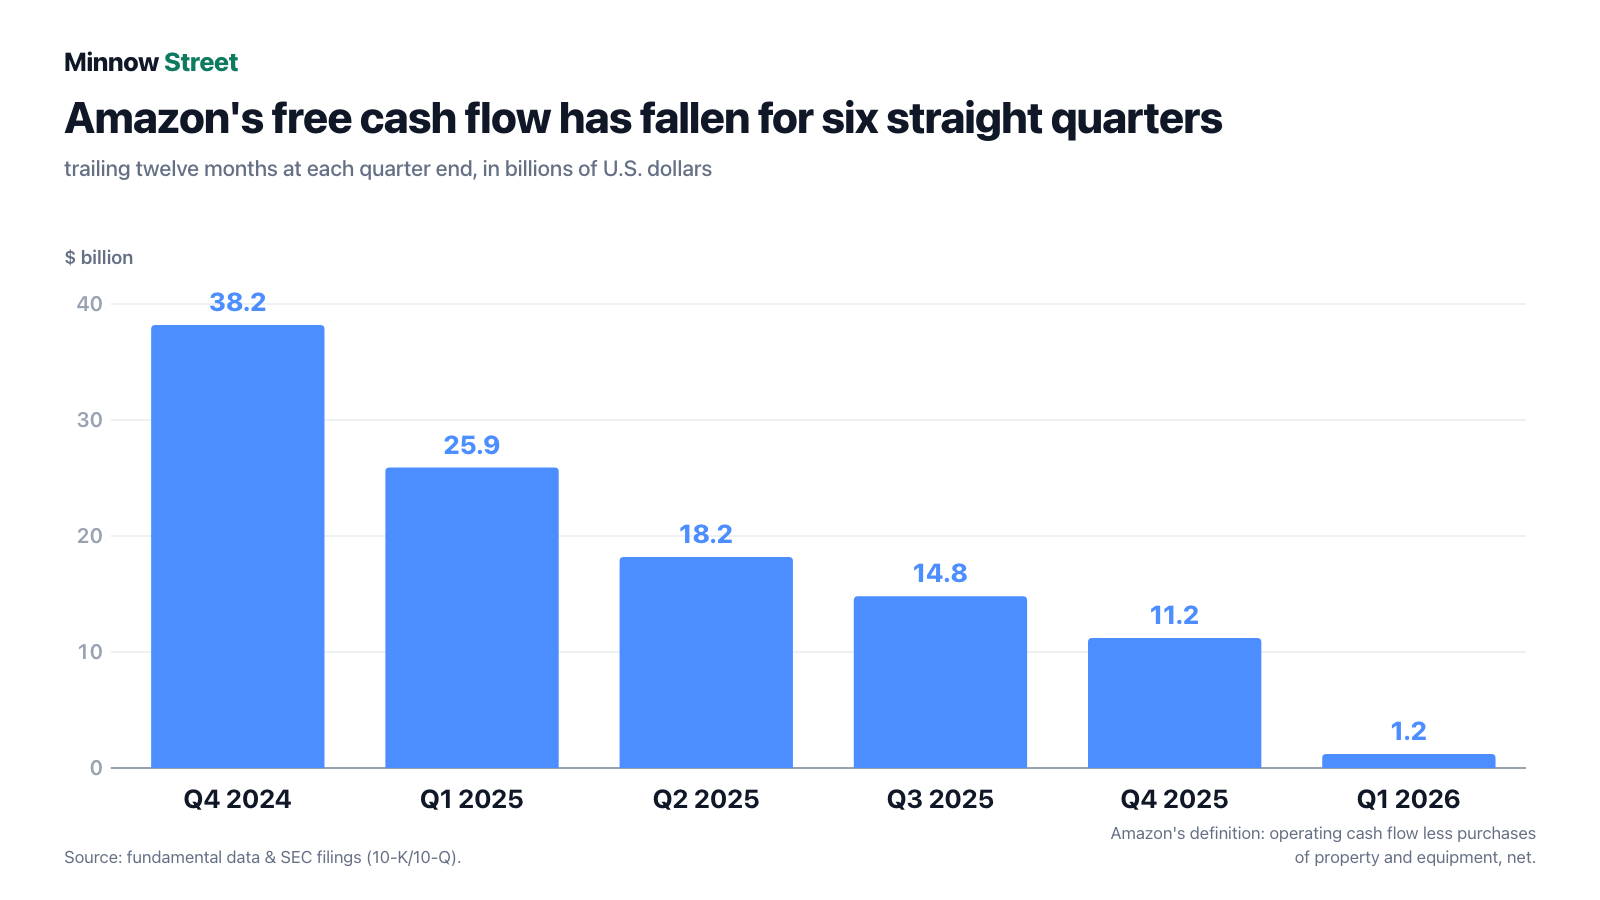
The six figures in plain text, each at quarter end: $38.2 billion (December 31, 2024), $25.9 billion (March 31, 2025), $18.2 billion (June 30, 2025), $14.8 billion (September 30, 2025), $11.2 billion (December 31, 2025) and $1.2 billion (March 31, 2026). Six consecutive quarters down, without a single move the other way.
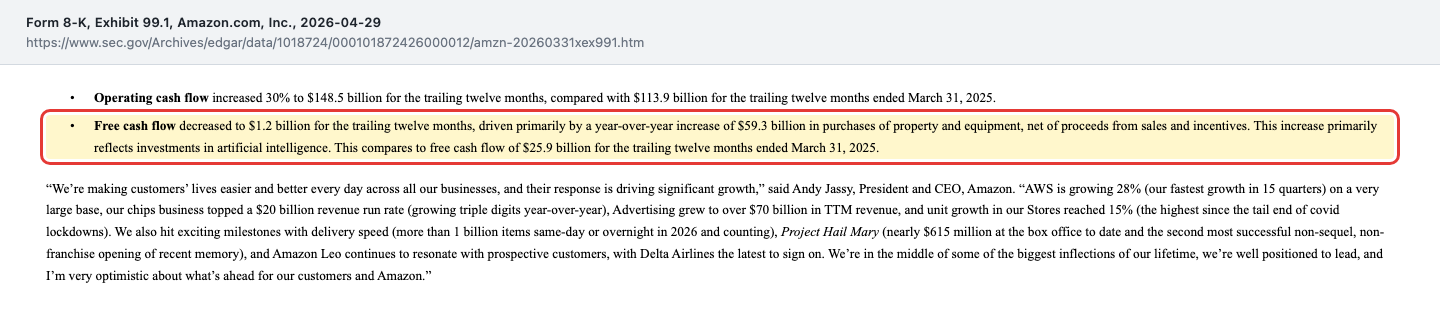
The offsetting arithmetic sits in the cash flow statement. Over the twelve months ended March 31, 2026, $148.5 billion came in from operations — 30 percent more than in the prior-year period. Over the same twelve months, $147.3 billion went out for property and equipment, net of proceeds. The prior-year figure was $88.0 billion. A $59.3 billion increase in capital spending consumes a $34.6 billion increase in operating cash flow — and then some.
Amazon names the reason itself:
"Free cash flow decreased to $1.2 billion for the trailing twelve months, driven primarily by a year-over-year increase of $59.3 billion in purchases of property and equipment, net of proceeds from sales and incentives. This increase primarily reflects investments in artificial intelligence."
— Amazon.com, Inc., Form 8-K dated April 29, 2026, Exhibit 99.1 (first quarter 2026 earnings release)
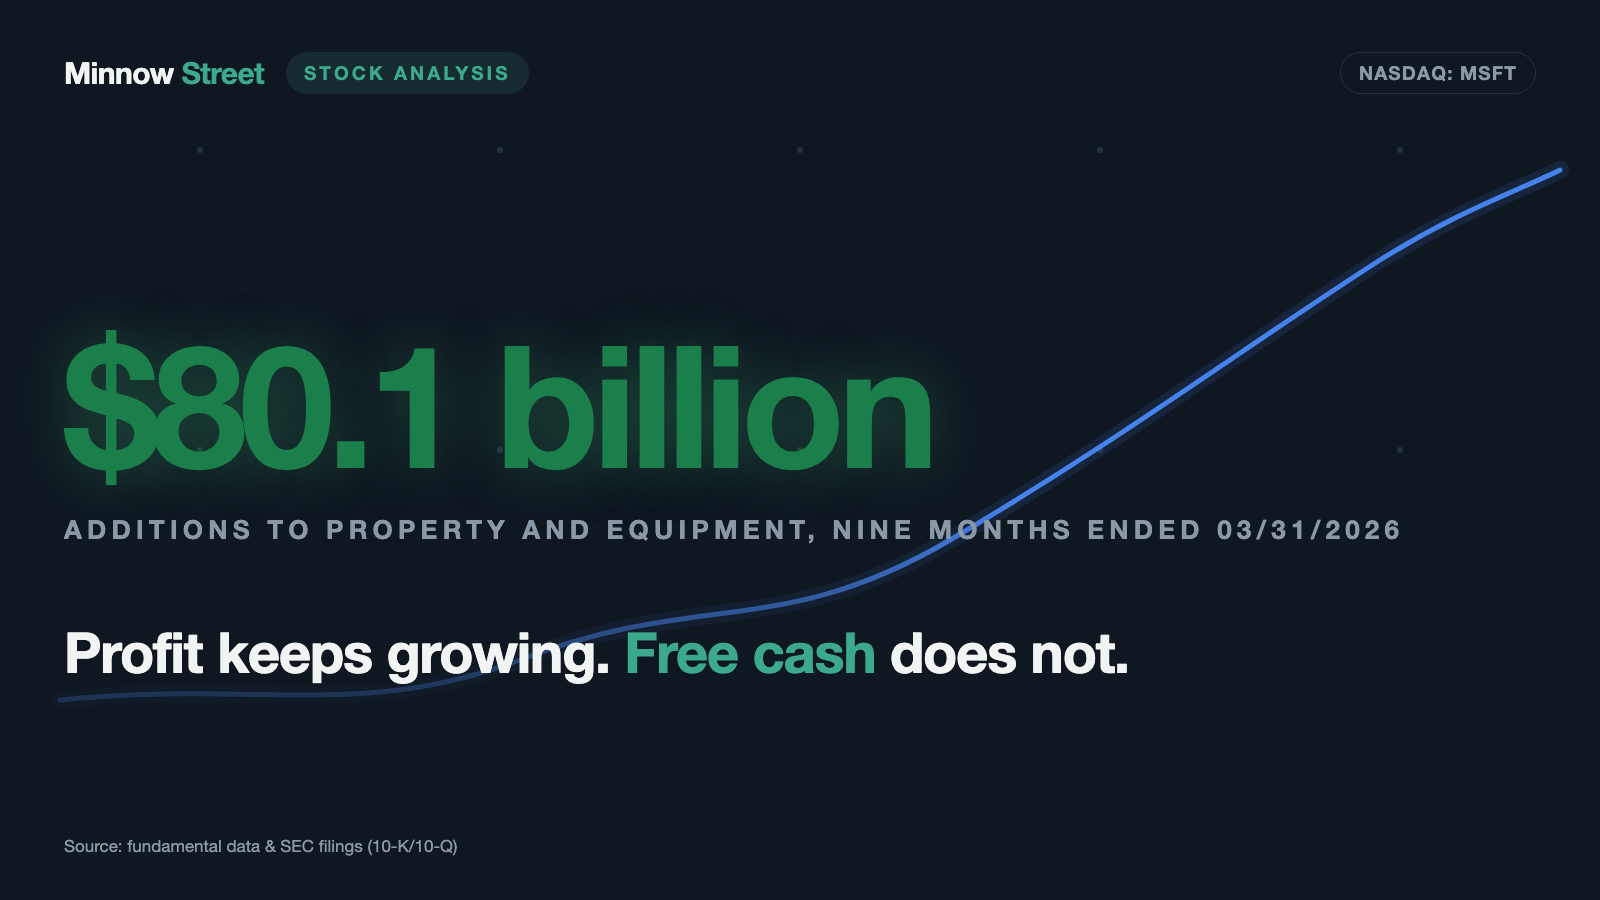
The segment note shows where the money goes. Additions to property and equipment in the first quarter of 2026 totaled $54.8 billion across the group, against $27.4 billion in the prior-year quarter. Of that, $41.5 billion went to AWS alone, up from $20.5 billion a year earlier. In that single quarter AWS invested almost three times what the segment earned ($14.2 billion). Segment property and equipment grew net from $190.1 billion to $223.1 billion.
A rule worth keeping: growth that has to be built is never free. It shows up in the investing line first and in the profit line years later — but the depreciation on it starts immediately.
That depreciation is already visible. Depreciation and amortization on property and equipment in the AWS segment rose to $7.277 billion in the first quarter of 2026, up from $4.390 billion a year earlier — a 66 percent increase against 28 percent segment revenue growth. Which is why the AWS operating margin on a trailing twelve-month basis fell from 37.5 percent to 35.2 percent even as growth accelerated.
Uncomfortable truth number 2: nobody earned $16.8 billion of the quarterly profit
For the first quarter of 2026, Amazon reported net income of $30.255 billion — 77 percent more than in the prior-year quarter. Operating income over the same period rose only from $18.4 billion to $23.9 billion, or 30 percent. The gap sits in a single line below operating income: "Other income (expense), net" jumped from $2.749 billion to $15.647 billion.
The notes explain it. Two items are responsible, both relating to the same holding: a $12.328 billion upward adjustment to nonvoting preferred stock in the AI company Anthropic (prior-year quarter: $37 million) and a $4.479 billion reclassification from convertible notes of the same company that were converted into preferred stock. Together, $16.8 billion before tax — the figure Amazon itself quotes in the earnings release.
"The upward adjustments relating to equity investments in private companies of $12.3 billion in Q1 2026 reflect observable changes in prices, primarily from our nonvoting preferred stock in Anthropic."
— Amazon.com, Inc., Form 10-Q as of March 31, 2026, Note 1 "Accounting Policies and Supplemental Disclosures"
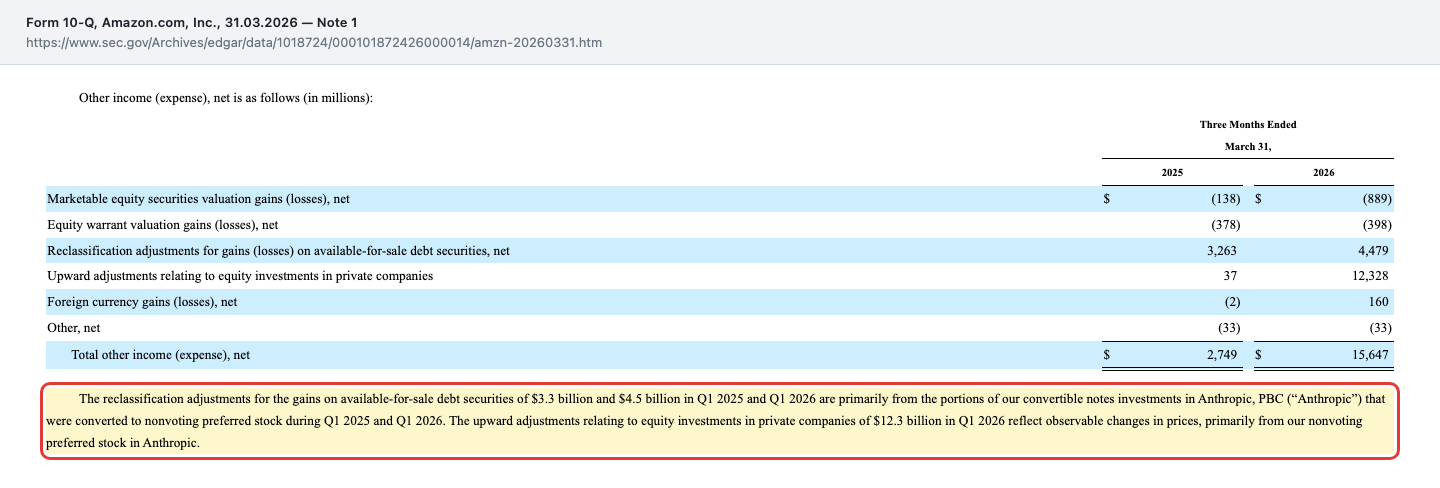
In plain language: between the third quarter of 2023 and the fourth quarter of 2025, Amazon put $8.0 billion into Anthropic convertible notes. Anthropic has since been valued higher in new funding rounds. Because Amazon's stake is now worth more, an accounting gain arises — and not a single dollar changes hands. Imagine your neighbour's house being appraised above last year's value while you own one room in it. On paper you are richer. Your wallet has not moved.
Two things make this trickier than a listed shareholding. First, the measurement is a Level 3 fair value: private shares have no market price, so Amazon values them on its own assumptions and models, anchored to funding rounds. The filing says as much itself — valuations of private companies are "inherently more complex due to the lack of readily available market data." Second, Anthropic is simultaneously an AWS customer: the note describes a commercial arrangement primarily for the provision of AWS cloud services, including the use of Amazon chips. Money moves in a circle — from Amazon to Anthropic as investment, from Anthropic to Amazon as rent for computing.
The size of the position is now considerable. As of March 31, 2026, the nonvoting preferred stock in Anthropic was carried at roughly $32.0 billion (December 31, 2025: $14.8 billion), and the convertible notes not yet converted at roughly $42.2 billion of fair value. The unrealized gain inside those notes, which has not yet passed through the income statement, is $36.3 billion and sits in equity under accumulated other comprehensive income. Amazon's entire portfolio of equity, equity warrant and convertible debt investments in public and private companies stood at $96.5 billion as of March 31, 2026.
Uncomfortable truth number 3: the build-out now runs on borrowed money
Until the end of 2024 Amazon issued no new bonds for years — the cash flow statements for 2023 and 2024 both show a flat zero on the line "proceeds from long-term debt." In 2025 there was $15.7 billion. And then came the first quarter of 2026.
"As of March 31, 2026, we had $121.8 billion of unsecured senior notes outstanding (the 'Notes'), including €14.5 billion ($16.8 billion) and $37.0 billion issued in March 2026 for general corporate purposes."
— Amazon.com, Inc., Form 10-Q as of March 31, 2026, Note 5 "Debt"
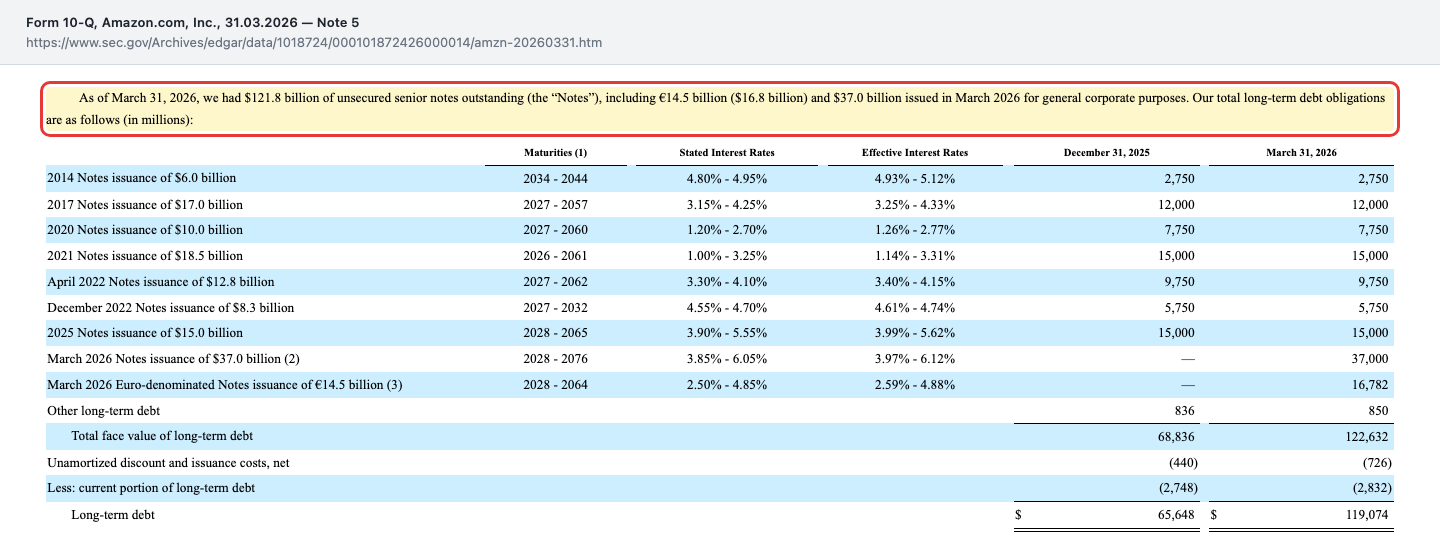
In numbers: the total face value of long-term debt rose from $68.836 billion to $122.632 billion between December 31, 2025 and March 31, 2026. The cash flow statement for the quarter shows $53.441 billion of proceeds from long-term debt, against $746 million in the prior-year quarter. This is not fine-tuning of the capital structure; it is a change of regime.
And it continued after the balance sheet date. On June 12, 2026, Amazon placed Canadian dollar notes of C$13.967 billion with maturities out to 2056 and coupons of 3.400 to 5.000 percent. On July 9, 2026, U.S. dollar notes of $24.923 billion followed, with maturities out to 2066 — the longest $2.25 billion tranche carries 6.250 percent. For comparison, the notes issued in 2020 pay 1.20 to 2.70 percent. New money now costs Amazon a multiple of what old money costs.
In fairness: for a company with $441.9 billion of equity and $148.5 billion of operating cash flow, this is not a leverage problem. Interest expense in the first quarter of 2026 was $800 million against $23.9 billion of operating income — interest cover of roughly 30. Note 5 states there are no financial covenants under the notes, and the $20.0 billion of committed revolving credit facilities was entirely undrawn at the balance sheet date. It is not a risk signal but a direction signal: the build-out is now larger than what the business can carry on its own.
Uncomfortable truth number 4: the biggest commitments are not on the balance sheet
As of March 31, 2026, Amazon lists $569.3 billion of total contractual commitments. Inside that sit $203.5 billion of debt principal and interest, $110.1 billion of operating lease liabilities, $103.8 billion of unconditional purchase obligations (for energy and equipment among other things) — and one line that is easy to skim past: $106.3 billion for leases that have not yet commenced. Those are datacenters and logistics space under construction but not yet handed over.
The second block sits in the financial instruments note, under events after the balance sheet date:
"Furthermore, we entered into a financing arrangement to make available to Anthropic an aggregate facility not to exceed $20.0 billion that will expire 30 months after a liquidity event, as defined, such as an Anthropic initial public offering or direct listing of equity securities."
— Amazon.com, Inc., Form 10-Q as of March 31, 2026, Note 2 "Financial Instruments"
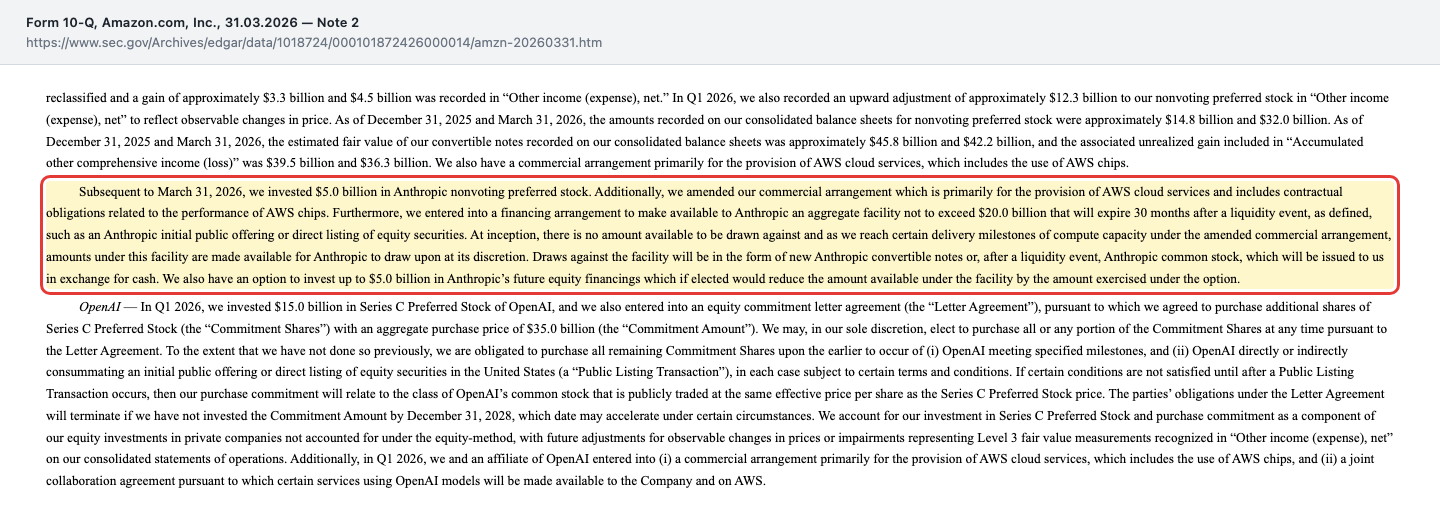
Put together: in the first quarter of 2026 Amazon invested $15.0 billion in OpenAI preferred stock and committed, under certain conditions, to a further $35.0 billion — the obligation terminates if the amount has not been invested by December 31, 2028. After the balance sheet date came $5.0 billion of additional Anthropic shares, the $20 billion facility and an option for another $5.0 billion. The carrying value of equity investments in private companies rose accordingly from $16.2 billion (December 31, 2025) to $48.1 billion (March 31, 2026).
Both counterparties also buy computing capacity from AWS — for OpenAI, Amazon explicitly describes a commercial arrangement for the provision of AWS cloud services including the use of AWS chips. This is not an accounting irregularity; it is the structure of the entire AI market. But anyone judging the 56 percent of profit that AWS delivers should know that part of the demand comes from companies Amazon itself owns a piece of and helps to fund.
The cross-check: is this a peak profit that will not repeat?
We ask this in every analysis, and for Amazon's first quarter of 2026 the answer is: to a large extent, yes. Let us work it through cleanly, before tax, so that the tax effect of the same holding is not counted twice.
| First quarter, pre-tax | 2025 | 2026 | Change |
|---|---|---|---|
| Reported pre-tax income | $21.679 billion | $39.834 billion | +83.7 % |
| of which Anthropic valuation gains | $3.263 billion | $16.807 billion | — |
| Excluding the Anthropic effect | $18.416 billion | $23.027 billion | +25.0 % |
Plus 25 percent adjusted is still a very good quarter — it is simply not the exceptional quarter implied by a headline of "profit up 77 percent." And the adjusted part is the reliable one: it comes from retail, advertising and rented computing, not from a valuation table.
The tax line carries the same fingerprint. Amazon reported a $9.6 billion tax provision for the first quarter of 2026, which included $4.1 billion of net discrete tax expense primarily attributable to the net gains from its investments in Anthropic. That, too, is a number that would not exist without the revaluation.
And the promised extrapolation cross-check: multiplying the first quarter of 2026 capital spending ($44.2 billion) by four gives $176.8 billion. The actual figure for the twelve months ended March 31, 2026 was $151.0 billion. Running it the other way, multiplying the first quarter of 2025 ($25.0 billion) by four would have given $100 billion — calendar 2025 came in at $131.8 billion. Amazon's capital spending follows a rising curve rather than a seasonal pattern; extrapolating from any one quarter misleads. Hence the trailing twelve-month figures throughout.
The counterweight: why Amazon is building so much
It would be unfair to stop here, because the same earnings release contains the case for the spending — and it is not thin. AWS grew 28 percent in the first quarter of 2026 to $37.6 billion, which the chief executive called the fastest growth in 15 quarters, achieved on a very large base. The chips business — Graviton, Trainium, Nitro — passed a $20 billion annual revenue run rate while growing at triple-digit rates. Advertising passed $70 billion of trailing twelve-month revenue. Paid units in the stores businesses rose 15 percent, the highest since the tail end of the pandemic lockdowns.
Amazon also reported offtake commitments that tie up capacity for years: a commitment from OpenAI to consume roughly two gigawatts of Trainium capacity beginning to ramp in 2027, and an agreement under which Anthropic will secure up to five gigawatts of current and future generations of Amazon chips. If you wonder why a company puts $41.5 billion into one segment in a single quarter: that is the answer. The capacity is sold before it is built.
The other side of the same equation — the chips Amazon buys in and increasingly designs itself — sits in our Nvidia analysis. Between the 2.1 million AI chips Amazon brought online over twelve months and the depreciation they will become over the next few years lies the real bet in this stock.
Valuation: what you pay for this company
Amazon was worth roughly $2,489 billion on the market at the end of July 2026 (data as of July 29, 2026). On trailing earnings of $8.37 per diluted share that is a price/earnings ratio of roughly 28, a price/sales ratio of roughly 3.4 and a price/book ratio of roughly 5.7. Enterprise value sits at roughly 13.6 times operating income before depreciation and amortization.
A P/E of 28 sounds moderate for a business growing 17 percent. Except that this P/E carries the Anthropic effect inside it: the $90.8 billion of trailing twelve-month profit includes the valuation gains. Strip out the first-quarter 2026 effect alone and trailing profit falls to roughly $78 billion — and the P/E rises to about 32. That is the more honest yardstick, because a revaluation does not repeat on schedule.
The view on free cash is more striking still. At $1.2 billion of free cash flow over twelve months, any price-to-free-cash-flow measure is arithmetically meaningless — it would come out at two thousand times. That is precisely the point: a buyer today is not paying for the cash Amazon distributes but for the business the investments are meant to create. For a sense of scale: calendar 2024, before the spending jump, produced $38.2 billion of free cash flow, which would imply a multiple of roughly 65.
The professional view is considerably friendlier. As of July 29, 2026, 70 assessments produced an average price target of roughly $313, with 47 "strong buy," 19 "buy," 4 "hold" and no sell ratings. A chorus without a single dissenting voice is rarely an independent second opinion — although among the largest index heavyweights it is close to the normal state of affairs.
One dated anchor from the filings themselves, more honest than any daily price: Amazon repurchased no shares at all in either the first quarter of 2025 or the first quarter of 2026, even though $6.1 billion of the March 2022 repurchase authorization remains. A company putting every available dollar into datacenters does not buy its own stock — and thereby says plainly where it expects the higher return.
Opportunities and risks at a glance
What speaks for Amazon:
- AWS grew 28 percent in the first quarter of 2026 to $37.6 billion — the fastest growth in 15 quarters.
- Advertising passed $70 billion of trailing twelve-month revenue and grew 24 percent in the quarter, at very low incremental cost per advert.
- The international business has turned from a loss (minus $2.656 billion in 2023) into a profit (plus $4.750 billion in 2025).
- A balance sheet with $441.9 billion of equity, $143.1 billion of cash and marketable securities and interest cover of roughly 30 as of March 31, 2026.
- Offtake commitments tie up capacity for years: roughly two gigawatts of Trainium for OpenAI from 2027, up to five gigawatts for Anthropic.
- Operating cash flow rose 30 percent over twelve months to $148.5 billion — the business itself produces more cash than ever.
What speaks against it:
- Free cash flow fell from $38.2 billion to $1.2 billion across six quarters, a decline of 95 percent.
- $16.8 billion of the $39.8 billion of first-quarter 2026 pre-tax income consists of non-cash valuation gains on a privately held stake (Level 3 measurement).
- The face value of long-term debt rose from $68.8 billion to $122.6 billion in one quarter; new notes cost up to 6.250 percent against 1.20 to 2.70 percent on the 2020 paper.
- Depreciation in the AWS segment rose 66 percent in the quarter to $7.3 billion while segment revenue grew 28 percent — the trailing twelve-month margin fell from 37.5 percent to 35.2 percent.
- Open commitments of $35.0 billion (OpenAI, deadline December 31, 2028) and up to $25.0 billion (the Anthropic facility plus option) sit largely off the balance sheet.
- One fifth of revenue carries 56 percent of profit — any margin decline at AWS hits the group disproportionately.
- Amazon pays no dividend and repurchased no shares recently; there are currently no returns to shareholders.
A human conclusion
Remember the cardboard box trap from the opening? At Amazon it has a double punchline. Many people now know the first one: the profit comes from the datacenter, not the parcel. The second is newer — the datacenter is currently eating that profit back up, at least the portion that would otherwise reach a shareholder as free cash.
Anyone who genuinely reads the filings finds no hidden disaster. They find an exceptionally strong company with an advertising business growing like a global firm in its own right, an overseas business that finally turned the corner, and a balance sheet that shrugs off $122 billion of bond debt. But they also find a shift that gets no headline: of every dollar taken in from operations, Amazon kept 33 cents as free cash in calendar 2024, eight cents in calendar 2025 — and less than one cent over the twelve months to March 2026.
Whether that turns out to be a magnificent investment or something people will call overbuilding in five years will not be settled on the profit line. It will be settled by whether the datacenters get filled — and whether the companies that ordered the capacity can pay for it. Amazon is helping to fund two of them. If you believe demand for computing keeps running like this for years, you are buying one of the best business models on earth at a price that is not historically absurd. If you doubt it, you are looking at a company reporting record profits while its free cash runs toward zero and its debt doubles. Both readings sit in the same document. What you make of it is your decision. And that is exactly as it should be.
Sources
- Amazon.com, Inc., SEC Form 10-Q as of March 31, 2026 (filed April 30, 2026) — statements of operations, balance sheet, cash flow statement, Note 1 (non-operating income, share count), Note 2 (Anthropic, OpenAI, subsequent events), Note 3 (leases), Note 4 (commitments, Globalstar), Note 5 (debt and credit facilities), Note 6 (stockholders' equity, stock-based compensation), Note 8 (segments), Item 2 (MD&A) including the free cash flow reconciliation
- Amazon.com, Inc., SEC Form 8-K dated April 29, 2026, Exhibit 99.1 — first quarter 2026 earnings release with the supplemental quarterly metrics (free cash flow, segment series, employee count) and second quarter 2026 guidance
- Amazon.com, Inc., SEC Form 10-K for 2025 (filed February 6, 2026) — Item 1 (business, employee count), Item 1A (risk factors), Item 7 (MD&A), financial statements, Note 10 (segments, revenue by country)
- Amazon.com, Inc., SEC Form 8-K dated June 10, 2026 — $17.5 billion delayed draw term loan of June 8, 2026; commitments expire September 30, 2026
- Amazon.com, Inc., SEC Form 8-K dated June 12, 2026 — closing of the Canadian dollar note offering of C$13.967 billion
- Amazon.com, Inc., SEC Form 8-K dated July 9, 2026 — closing of the U.S. dollar note offering of $24.923 billion, maturities out to 2066
- SEC EDGAR, filing index for Amazon.com, Inc. (CIK 0001018724) — every filing dated on or after April 30, 2026 was reviewed; the filing of May 22, 2026 concerns only the results of the annual meeting and does not change the numbers
- Fundamental data (market value, valuation metrics, analyst consensus), data as of July 29, 2026
This analysis is journalistic commentary on publicly available information and is not investment advice. It is not a solicitation to buy or sell securities. Stocks can lose substantial value, up to and including the total loss of the capital invested. All figures come from the sources named above and carry their respective cut-off dates; reports published after the editorial deadline are not reflected. The author holds no position in the stock discussed at the time of publication.
Our Bottom Line at a Glance
- Market position and growth positive
- Revenue of $742.8 billion over the twelve months ended March 31, 2026, up 17 percent in the first quarter of 2026. AWS grew 28 percent to $37.6 billion in the quarter and advertising 24 percent to $17.2 billion. Paid units across the stores businesses rose 15 percent (earnings release of April 29, 2026).
- Earning power and where it comes from neutral
- The operating margin was 13.1 percent in the first quarter of 2026 — good for a retailer, modest for a technology group. It comes almost entirely from one segment: AWS delivers 56 percent of operating income on 18 percent of revenue, while the international business runs at a 3.1 percent margin (twelve months to March 31, 2026, 10-Q Note 8).
- Cash flow after investment negative
- Free cash flow fell from $38.2 billion to $1.2 billion across six quarters (trailing twelve-month figures, as of March 31, 2026), a decline of 95 percent. The cause is $147.3 billion of net capital spending over twelve months; AWS alone booked $41.5 billion of additions to property and equipment in the first quarter of 2026 against $14.2 billion of segment income.
- Quality of earnings negative
- $16.8 billion of the $39.8 billion of pre-tax income in the first quarter of 2026 consists of non-cash valuation gains on the Anthropic stake, measured as a Level 3 fair value (unobservable inputs, the company's own assumptions). Adjusted, the increase is roughly 25 percent rather than 84 percent (10-Q as of March 31, 2026, Notes 1 and 2).
- Balance sheet and financing positive
- Stockholders' equity of $441.9 billion and $143.1 billion of cash and marketable securities as of March 31, 2026. Quarterly interest expense of $800 million against $23.9 billion of operating income is a rounding difference; Note 5 states there are no financial covenants under the notes, and the $20.0 billion of revolving credit facilities was entirely undrawn.
- Open commitments neutral
- Alongside $569.3 billion of total contractual commitments as of March 31, 2026 sit an open $35.0 billion OpenAI commitment (deadline December 31, 2028) and, entered into after the balance sheet date, an Anthropic facility of up to $20.0 billion plus a $5.0 billion option. Both counterparties are also AWS customers.
Amazon has never been operationally stronger: $742.8 billion of revenue and $85.4 billion of operating income over twelve months, AWS growing at its fastest rate in 15 quarters, and a balance sheet carrying $441.9 billion of equity. Two figures from the same filings belong beside that: after investment, $1.2 billion was left rather than $25.9 billion, and $16.8 billion of the $39.8 billion of first-quarter pre-tax income is a mark-up of a privately held stake. Amazon now funds the build-out with bonds — $122.6 billion of face value as of March 31, 2026, against $68.8 billion three months earlier. Not investment advice.
What Our Rating Means
Open questions
The business works in principle, but one material question is open. As long as it stays open, our findings do not carry a quality verdict.
The business plainly works, the balance sheet is strong and there is no accounting or governance breach — yet a green rating would require a degree of reliability the numbers do not quite deliver. Two findings remain open: free cash flow has melted from $38.2 billion to $1.2 billion across six quarters, and 42 percent of first-quarter 2026 pre-tax income comes from a Level 3 valuation of privately held shares — from assumptions rather than payments. Whether the $147 billion invested over the last twelve months earns its cost of capital is not yet proven, and the depreciation on it has already started. That is an operating question rather than a threat to the substance of the company: with $143 billion of liquidity and $148 billion of operating cash flow, Amazon can sustain this bet for a long time. The decision is yours.
A journalistic assessment by our editorial team at the time of the deep dive, based on public sources — not investment advice and not a solicitation to buy or sell. Your personal circumstances (investment goals, risk capacity, taxes) cannot be taken into account. What our levels mean, how verdicts are formed, and what conflicts of interest exist →
Worth Noting
- Origin: ranking of the 100 largest U.S. stocks by market value (as of July 28, 2026); Amazon ranked sixth and had no analysis yet.
- Data cut-offs: annual figures from the Form 10-K for 2025 (filed February 6, 2026), quarterly and twelve-month figures from the Form 10-Q as of March 31, 2026 (filed April 30, 2026) and the earnings release of April 29, 2026, valuation metrics as of July 29, 2026. The report for the second quarter of 2026 had not been filed as of July 29, 2026.
- Basis of calculation: "free cash flow" is Amazon's own definition throughout — operating cash flow less "purchases of property and equipment, net of proceeds from sales and incentives." Amazon also publishes variants that include finance leases; those are not mixed in here.
- Easily confused: Amazon's fourth quarter is seasonally the strongest. Time series in this analysis therefore use trailing twelve-month figures rather than annualized quarters.
- Analyses are evergreen; a daily price is not a buy argument.
Frequently Asked Questions
Not from parcels. Over the twelve months ended March 31, 2026, revenue came to $437.6 billion from North America, $168.2 billion from the international business and $137.0 billion from the AWS cloud business. Operating income inverts that picture: AWS delivered $48.2 billion, North America $32.0 billion and International only $5.2 billion.
Because capital spending is growing faster than operating cash flow. Over the twelve months ended March 31, 2026, $148.5 billion came in from operations while $147.3 billion went out for property and equipment, net of proceeds. Amazon names the reason in its own earnings release: the increase primarily reflects investments in artificial intelligence.
A large part of it is not earned cash. Of $39.8 billion in pre-tax income, $16.8 billion came from valuation gains on the Anthropic stake — a $12.3 billion mark-up of nonvoting preferred stock plus $4.5 billion reclassified from converted notes. No money changes hands. Without that effect, pre-tax income would be $23.0 billion.
As of March 31, 2026, the face value of long-term debt stood at $122.6 billion, up from $68.8 billion three months earlier. Lease liabilities add $104.9 billion of present value. Against that stand $441.9 billion of stockholders' equity and $143.1 billion of cash and marketable securities. Quarterly interest expense was $800 million against $23.9 billion of operating income.
It grew 28 percent in the first quarter of 2026 to $37.6 billion — the fastest growth in 15 quarters according to chief executive Andy Jassy. The segment operating margin was 37.7 percent, down from 39.5 percent in the prior-year quarter. On a trailing twelve-month basis the margin fell from 37.5 percent to 35.2 percent as depreciation on the new datacenters kicked in.
No. Amazon has never paid one. There is a $10.0 billion repurchase program authorized by the board in March 2022; $6.1 billion of it remained as of March 31, 2026. No shares were repurchased in either the first quarter of 2025 or the first quarter of 2026.
Because the fourth quarter towers over the others: $213.4 billion of revenue in the fourth quarter of 2025 against $181.5 billion in the first quarter of 2026. Capital spending runs the other way, rising through the year. Multiplying the first quarter of 2025 by four would have implied $100 billion of capital expenditure; the actual figure was $131.8 billion.
Mostly financings. On June 8, 2026, an undrawn $17.5 billion credit facility whose commitments expire on September 30, 2026. On June 12, 2026, C$13.967 billion of notes; on July 9, 2026, a further $24.923 billion with coupons up to 6.250 percent. The report for the second quarter of 2026 had not been filed as of July 29, 2026.
Found an error?
Did you spot a factual error, an outdated number, or a typo in this deep dive? Let us know briefly — your report goes straight to the editorial team.