LiveRamp: The Turnaround Worked — and the Company Is Already Sold
For six years LiveRamp posted losses. Then came the record year: $812.9 million in revenue, $83.5 million in operating income, $166.4 million in free cash flow. Three weeks before those numbers were published, the board signed the company over to France's Publicis Groupe for $38.50 per share in cash. Read the filings with the U.S. securities regulator, the SEC, and two facts stand next to each other: almost a third of the record $146.0 million profit came from a $46.7 million tax benefit, and the entire operating income matches stock-based compensation of $83.0 million almost dollar for dollar. Not investment advice — just the question of what you are buying when the share price sits glued to an offer price.
 Thomas Mücke
Founder & Publisher
Thomas Mücke
Founder & Publisher
Chart
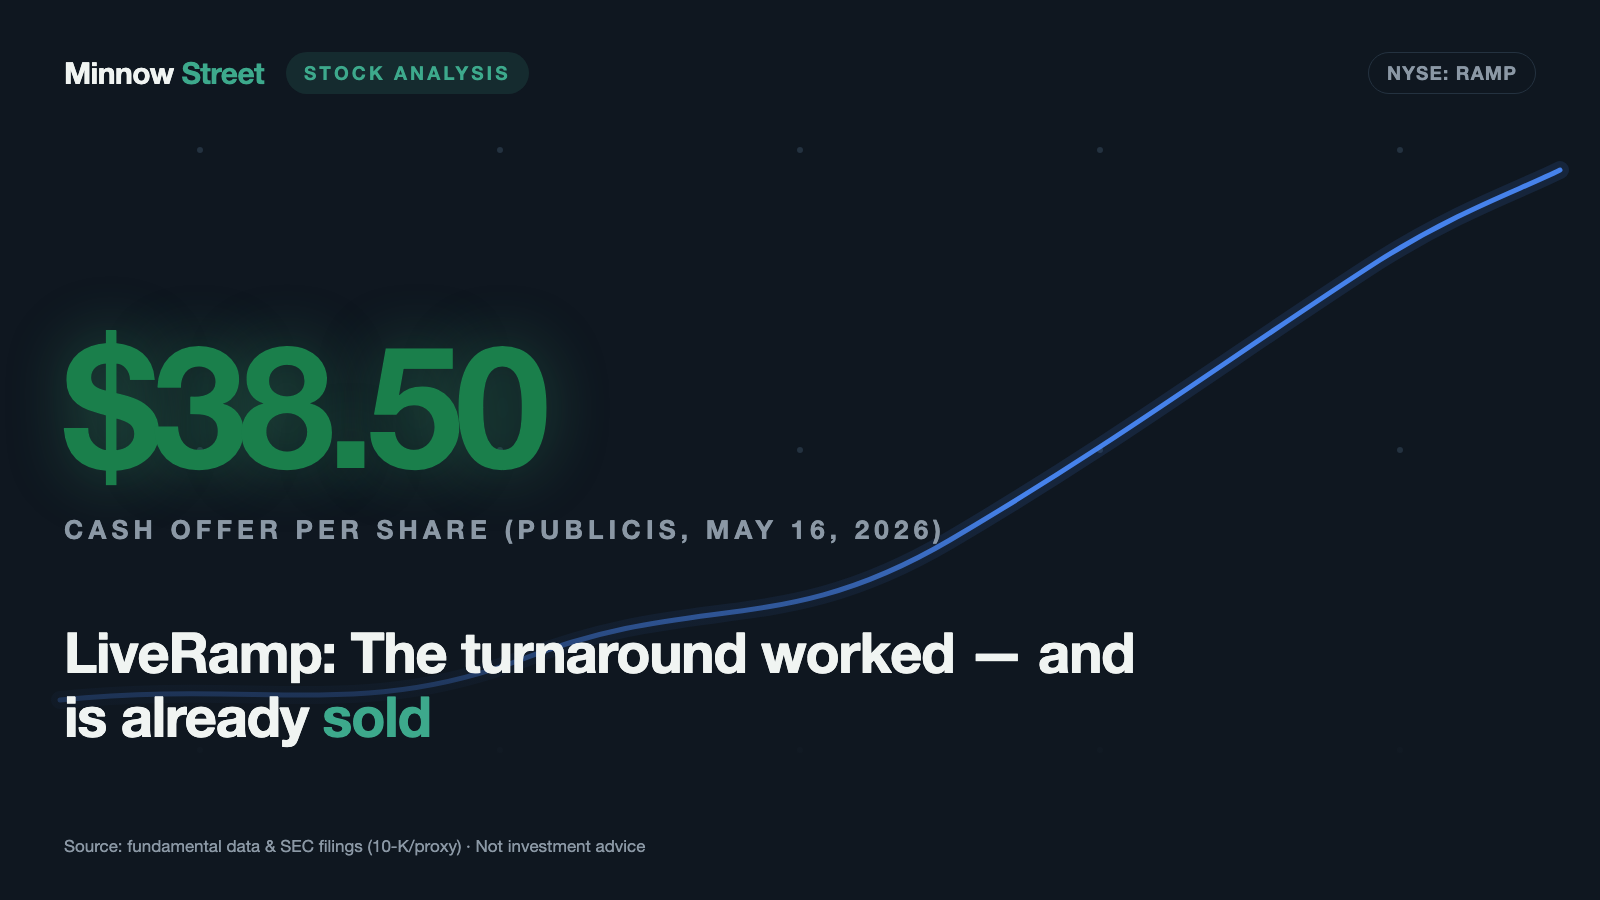
Interactive price chart (TradingView).
Note: pure fact-based analysis, not investment advice and not a solicitation to buy or sell. All figures without guarantee.
There is an investor trap that springs shut precisely when you have finally been proven right: the finish-line trap. It works like this. You watch a company dig itself out of years of losses. Eventually the year arrives when everything fits — revenue growing, costs under control, profit on the board. The share price climbs, the chart looks like a textbook. And because it feels so right, you buy. What you overlook is that somebody else is already standing on the finish line, holding the tape. LiveRamp Holdings (NYSE: RAMP) of San Francisco is exactly that company in the summer of 2026. Fiscal 2026 was the best year in its history. Three weeks before those numbers were published, the board signed the company over to France's Publicis Groupe. So let us make a deal: before you buy a turnaround, we read together what the company itself filed with the U.S. securities regulator, the SEC — the annual report (10-K) for fiscal 2026, the quarterly report (10-Q) as of December 31, 2025, and the merger proxy (DEFM14A) of July 6, 2026. An SEC filing is honest under threat of prosecution. And this one describes a genuine turnaround, a profit that owes a large share to the tax line, an operating income exactly the size of stock-based compensation — and $38.50 that goes to a vote on August 17, 2026. In the end, the decision is yours.
What LiveRamp actually does — the translator between data silos
Picture two companies that each know something about the same person. A retailer knows Ms. Smith bought running shoes last week. A broadcaster knows a particular device streamed a sports film yesterday. Both would like to know whether that is the same person — but neither may show the other a name, an address or an email. LiveRamp fills exactly that gap: it replaces personal details with a pseudonymous key called RampID and lets both sides match through it. The industry term is data collaboration; in plain language it is a translator that brings two data silos together without disclosing the contents.
The business stands on four legs, which the annual report names as Live/Identity (identity resolution itself, built on two data graphs), Live/Access (the data marketplace with more than 225 data providers), Live/Connectivity (integration with over 500 partners — advertising platforms, publishers, social networks, connected TV) and Live/Insights (measurement in so-called clean rooms, where two partners can compute together without swapping raw data). Customers mostly pay by subscription, priced by data volume: $614.4 million of the $812.9 million in fiscal 2026 revenue came from subscriptions, $198.6 million from the marketplace and other sources. Roughly 76 percent of revenue derives from subscription arrangements sold on an annual or multi-year basis.
One point runs through the whole analysis: the business is almost entirely American. Of the $812.9 million in fiscal 2026 revenue, $763.2 million came from the United States, $41.4 million from Europe, $6.2 million from Asia-Pacific and $2.2 million from the rest of the world. A European buyer is therefore acquiring, at its core, a U.S. business with U.S. customers and U.S. data — which is why this analysis ends with a government body most investors rarely think about.
That frames the central tension of this analysis, and it runs through every chapter: LiveRamp has achieved its operating turnaround — but the reported profit does not rest on the operating business alone, and the cash the business does generate has for years flowed almost entirely to its own workforce and into buybacks that offset that same compensation.
Where the stock landed on our desk
LiveRamp showed up in our turnaround candidates scanner — a list that looks for companies whose shares have lost at least half their all-time high, whose balance sheet can survive the drought, and whose quarterly figures are visibly turning. To repeat it yourself: open the scanner section, pick the turnaround candidates list, set the country filter to the United States. The lists are recomputed daily.
And now the part we have to state plainly, because it changes the reading. The scanner checks eight items — four on the operating turn, four on market confirmation; the column is labeled turnaround check. LiveRamp scores 6 out of 8 (measured July 27, 2026). That is exactly the entry threshold. Of the 60 U.S. hits on the list, 44 also score exactly 6 — LiveRamp therefore sits inside a tied group that shares ranks 17 through 60; only 16 names stand ahead of it with 7 or 8 points. The page displays the 25 strongest hits, and LiveRamp is not among them. Anyone quoting an exact rank is quoting a random number produced by database ordering. Remember it as a rule for any ranking: where scores tie, the order is decoration, not information.
A second hit says more, because it rests on hard balance-sheet ratios rather than points: LiveRamp also appears on the Altman Z balance-sheet fortress list. The Altman Z-score is a bankruptcy early-warning figure assembled from several balance-sheet ratios; anything above 2.6 counts as the safe zone. Our data series shows 12.55 for LiveRamp (data as of July 24, 2026). We recalculated that against the audited accounts: with an equity ratio of 75.1 percent, no financial debt (interest expense in fiscal 2026: $32 thousand), $379.5 million in cash against $322.2 million in total liabilities, and current assets covering current liabilities 2.5 times over, the various formulas land somewhere between 9 and 14 — the order of magnitude holds either way, the decimal is arguable. The Piotroski F-score of 7 out of 9 also reproduced item by item: positive profit, positive operating cash flow larger than profit, higher return on assets, no new debt, a lower share count, higher asset turnover — with points lost only on gross margin (70.7 percent against 71.0 percent a year earlier) and on the current ratio. Seven of nine is good but not spotless; a genuinely pristine company scores 8 or 9.
And the crash the scanner requires is real: on July 24, 2026 the shares traded roughly 56 percent below their all-time high — at a price of $37.70 that implies a historical peak above $86. The turnaround the scanner hunts for has happened. It has simply been handed to a buyer.
The numbers over the years — given their due
First what genuinely impresses, and there is plenty. In fiscal 2020 (ended March 31, 2020) LiveRamp was burning cash: a $180.9 million operating loss on $380.6 million of revenue, plus negative free cash flow of $40.3 million. Six years later the same company shows $812.9 million in revenue, $83.5 million of operating income and an operating margin of 10.3 percent — after 0.7 percent a year earlier. Revenue has more than doubled in six years without the company taking on a dollar of debt.
The operating metrics investors watch in a subscription business also point up: annualized recurring revenue rose to $545 million (prior year $504 million) and subscription net retention to 107 percent (prior year 104 percent) — meaning existing customers spent 7 percent more on average than a year earlier, churn already netted out. The remaining performance obligation stood at $760.4 million, of which $518.5 million is to be recognized over the next twelve months. There are 133 customers paying more than $1 million a year in subscription revenue; in total LiveRamp serves 846 direct customers.
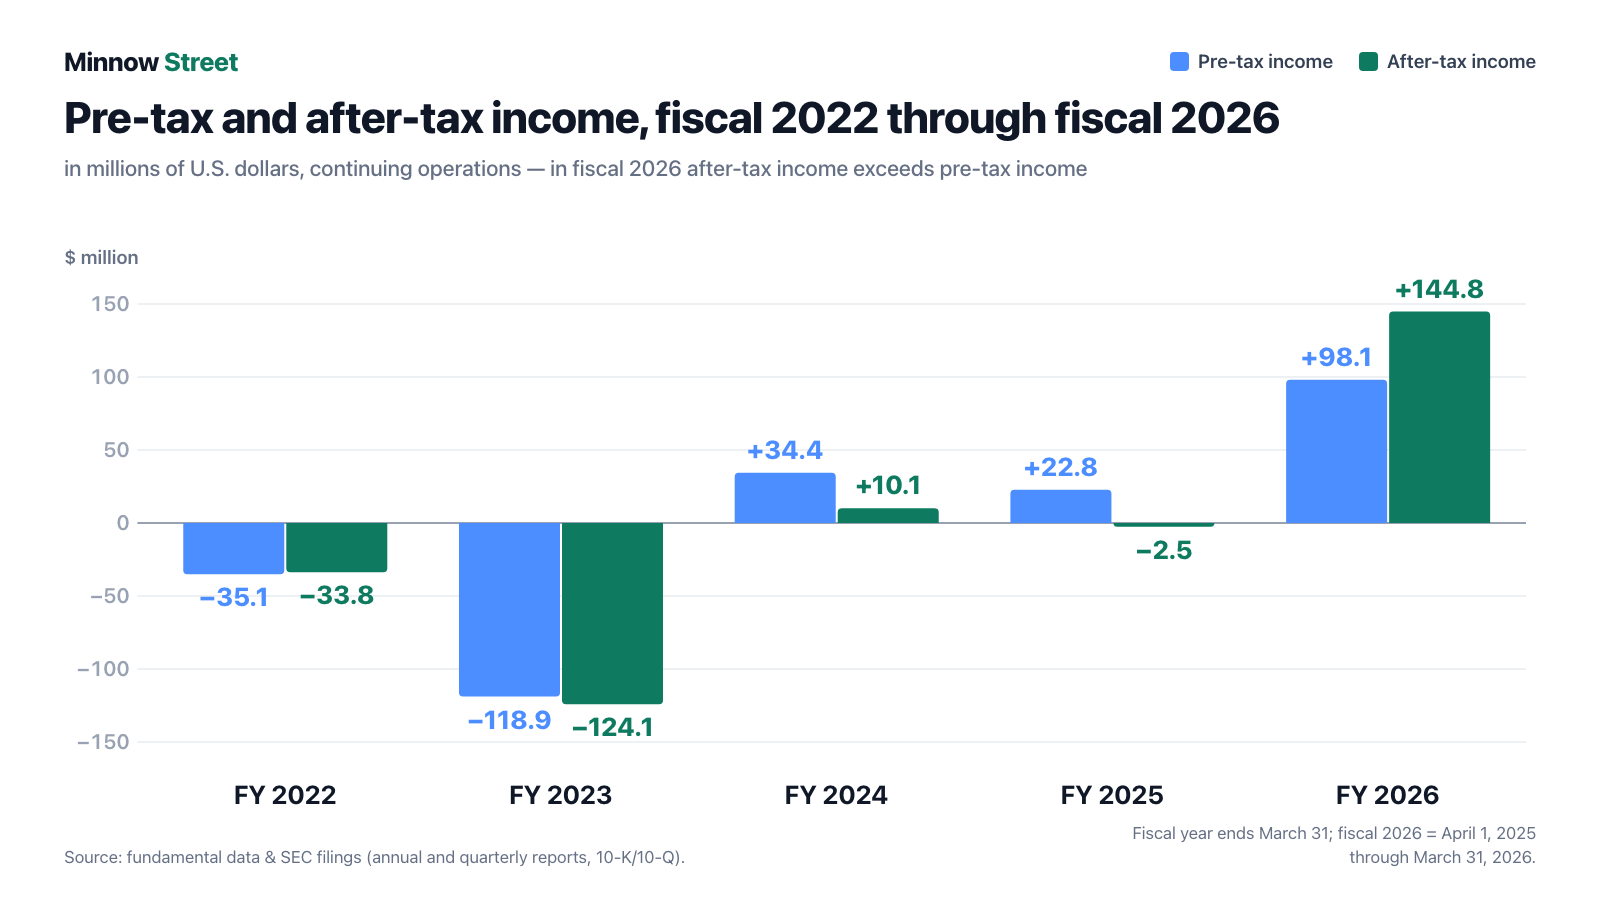
The series in detail, in millions of dollars: pre-tax income ran from −35.1 (fiscal 2022) through −118.9 and +34.4 to +22.8 and finally +98.1; after-tax income from −33.8 through −124.1 and +10.1 to −2.5 and +144.8. In four of five years less survived taxation than went into it — in fiscal 2026, more did. Why, in a moment.
The balance sheet as of March 31, 2026 belongs to a company with no existential worries: $1,294.2 million in total assets, of which $379.5 million is cash ($26.2 million of it outside the United States), and $972.0 million of equity — with no financial debt. Interest income ($14.8 million) exceeds interest expense ($32 thousand) more than four hundredfold. If you wonder how LiveRamp survived six loss-making years without distress, that is the answer. Remember the image: the company did not win the marathon by running fast, but by never having to stop.
What the filings say — the uncomfortable truths
Uncomfortable truth No. 1: a third of the record profit comes from the tax line
Net income for fiscal 2026 was $146.0 million, or $2.24 per diluted share — after a loss of $0.01 per share the year before. Income before taxes from continuing operations, however, was only $98.1 million. Normally taxation shrinks a profit; here it grew one. The annual report explains why:
“Income tax benefit was $46.7 million on income from continuing operations before income taxes of $98.1 million for the twelve months ended March 31, 2026, resulting in a (47.6)% effective tax rate. … In fiscal 2026, a valuation allowance release was recorded based on all available evidence, including sustained profitability in recent years, improved expectations of future taxable income, and the absence of significant negative evidence.”
— LiveRamp Holdings, Inc., SEC annual report 10-K for fiscal 2026, Management's Discussion and Analysis

What is a valuation allowance on deferred tax assets? In plain terms: a company that loses money for years accumulates loss carryforwards — vouchers that can shelter future profits from tax. As long as it is unclear whether profits will ever arrive, those vouchers must be written down. When profits do arrive, the write-down is reversed — and it hits earnings in one lump. That is what happened here: $53.8 million at the federal level plus $28.9 million from states, mostly California. What remains is a valuation allowance of just $20.6 million on foreign loss carryforwards.
Two things follow. First, the effect will not repeat. Anyone extrapolating the price-to-earnings ratio of roughly 17 (data as of July 24, 2026) is projecting a profit that is not coming back. Second, and sharper: the whole effect fell into the closing quarter. In the quarter ended March 31, 2026, pre-tax income of $19.3 million met a tax benefit of $50.5 million and produced net income of $70.9 million — almost half the annual profit in a quarter that earned $19.3 million operationally. For context, the same quarter a year earlier showed pre-tax income of negative $6.7 million. The improvement is genuinely operational and overstated by taxes.
Uncomfortable truth No. 2: operating income almost exactly equals stock-based compensation
Now the comparison that describes this business's earning power most honestly. Operating income in fiscal 2026: $83.5 million. Stock-based compensation in the same year: $83.0 million. Stock-based compensation means the company pays part of its payroll not in cash but in its own shares. In the income statement it is an expense; in the cash flow statement it is added back, because no cash leaves. The bill is settled elsewhere — by the shareholder, whose slice of the pie shrinks.
And the jump from $5.4 million to $83.5 million? The annual report answers that itself:
“Income from operations was $83.5 million for the twelve months ended March 31, 2026 compared to income from operations of $5.4 million in the same period a year ago. Operating margin was 10.3% compared to 0.7% in the same period a year ago. Margins in the current year were positively impacted by the leverage from a $32.9 million decrease in total operating expenses, which was significantly impacted by a $23.7 million decrease in stock-based compensation.”
— LiveRamp Holdings, Inc., SEC annual report 10-K for fiscal 2026, Management's Discussion and Analysis

Roughly three quarters of the cost decline that rescued the margin is therefore not operating efficiency but a smaller bill for paying staff in stock. That is not a criticism of the number — it is a warning against extrapolating it. An expense line that falls by $23.7 million does not fall by $23.7 million every year.
Uncomfortable truth No. 3: $1.2 billion of buybacks — and 54 million shares for compensation
Stay with the cash the business actually throws off. Operating cash flow in fiscal 2026 was $167.8 million against capital expenditures of a meager $1.4 million — this business needs almost no equipment. That leaves free cash flow of $166.4 million. Where does it go?
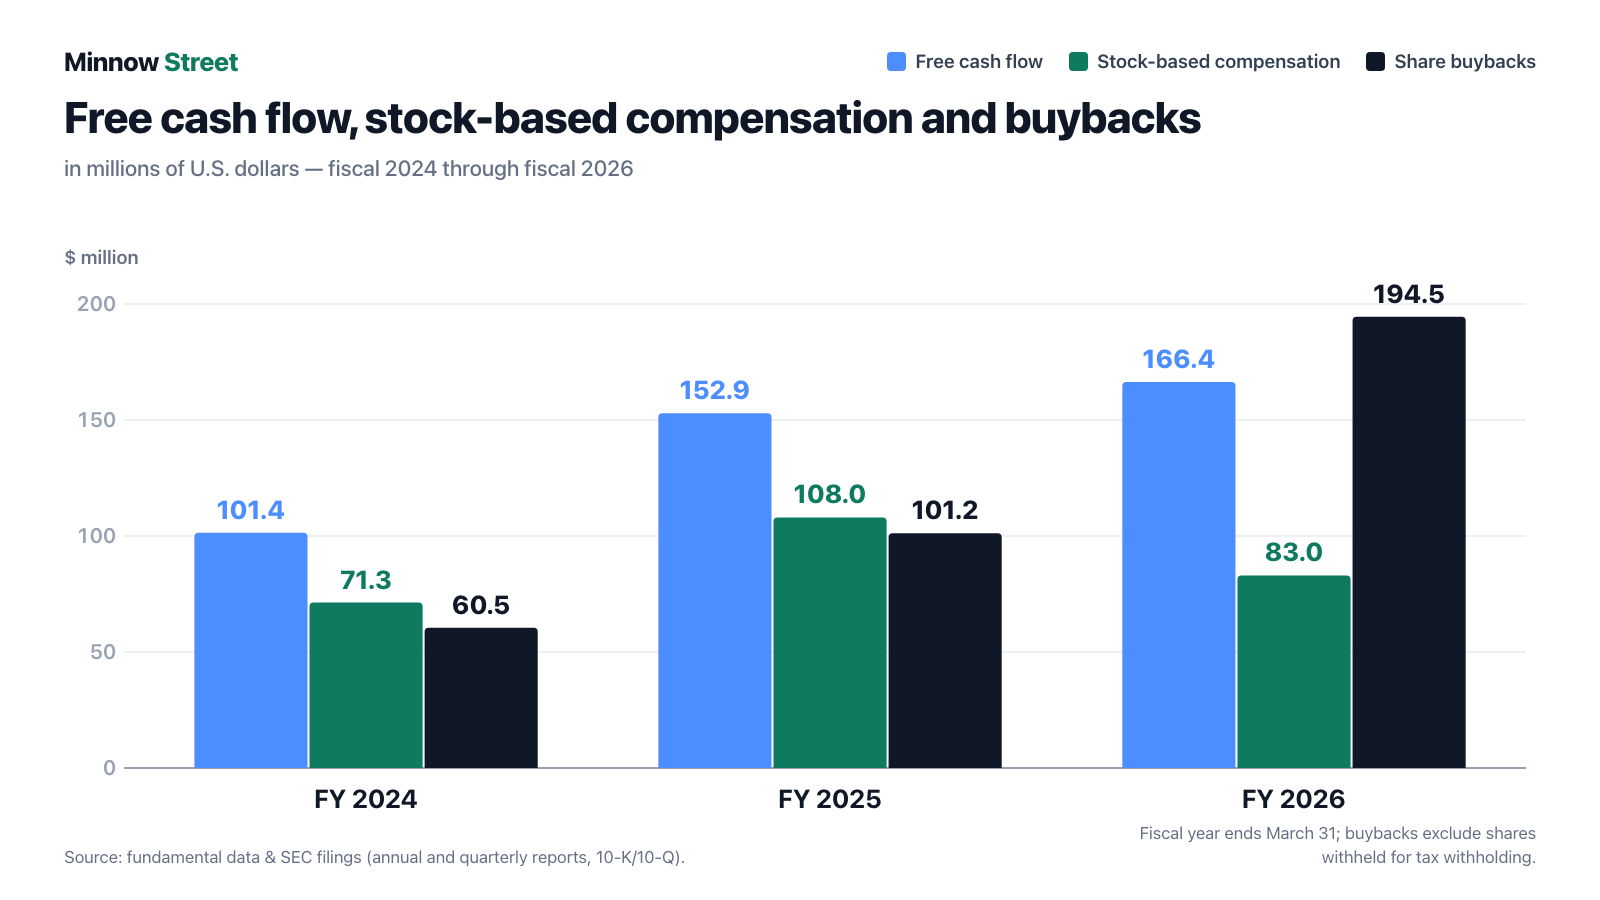
The series shows this is not a single-year quirk. Free cash flow rose from $101.4 million (fiscal 2024) through $152.9 million to $166.4 million. Stock-based compensation over the same period ran at $71.3 million, $108.0 million and $83.0 million — between half and two thirds of total free cash flow every single year. And buybacks climbed from $60.5 million through $101.2 million to $194.5 million.
In fiscal 2026 LiveRamp repurchased 7.1 million of its own shares; the cash flow statement records $194.5 million for that, the management discussion $194.4 million — the difference is the 1 percent U.S. excise tax on buybacks, which runs through the cash flow statement. On top came $13.0 million for shares withheld for taxes when employee awards vested. Together roughly $207.6 million — more than the business generated in free cash that year. The remainder came out of the bank account, which fell accordingly from $413.9 million to $379.5 million.
And here is the number worth memorizing:
“Through March 31, 2026, the Company had repurchased 48.6 million shares of its common stock for $1.2 billion, leaving remaining capacity of $261.8 million under the stock repurchase program. In accordance with the Merger Agreement, the Company has paused repurchases under its stock repurchase program through the completion of the Merger.”
— LiveRamp Holdings, Inc., SEC annual report 10-K for fiscal 2026, Item 5

Forty-eight point six million shares repurchased sounds enormous — against roughly 60.8 million shares outstanding (as of June 18, 2026) that would be almost half the company. It is not, because the issuing side sits opposite: 54.0 million shares have been reserved for the stock and equity compensation plans since their inception, of which 7.3 million were still available on March 31, 2026. Put differently, across the life of the programs the company has provided roughly as many shares to its workforce as it has bought back in the market. That is not a return of capital but largely a repair shop for its own dilution. It also explains why the share count has fallen only from 67.8 million (March 31, 2020) to 60.1 million (May 15, 2026) despite $1.2 billion of repurchases.
Uncomfortable truth No. 4: this is no longer a stock, it is a bet on three clearances
On May 16, 2026 LiveRamp signed a merger agreement with MMS USA Holdings, Inc., a subsidiary of France's Publicis Groupe S.A., the world's third-largest advertising group. Each share converts into the right to receive $38.50 in cash.
“If the Merger is completed, you will be entitled to receive $38.50 in cash, without interest, for each Eligible Share owned by you …, which represents a premium of approximately 30% to the closing price of $29.66 per share of Common Stock on May 15, 2026, the last trading day prior to the execution of the Merger Agreement.”
— LiveRamp Holdings, Inc., SEC merger proxy DEFM14A of July 6, 2026

That changes what you are buying. Three hurdles stand between today and $38.50. First, the stockholders: they vote virtually on August 17, 2026, and approval requires two thirds of all outstanding shares (66 2/3 percent), not merely of votes cast. A share that is not voted effectively counts as a no. The record date was June 18, 2026, with 60,786,315 shares outstanding. Second, the antitrust regulators in the United States and abroad, plus foreign direct investment clearances. Third, CFIUS — the U.S. committee that reviews foreign acquisitions of American companies for national security risk. For a company whose core business is linking U.S. consumer data and which books 94 percent of its revenue there, that is no formality: the agreement expressly gives both parties a termination right if CFIUS recommends that the president act to prohibit the merger.
If the agreement collapses, the responsible party owes the other $32.35 million. The outside date for closing is May 16, 2027, extendable by three months if only clearances remain outstanding. The annual report expects closing by the end of calendar 2026.
Valuation — what $38.50 really means
Conventional metrics are only half the story here, but for completeness: at a price of $37.70 (data as of July 24, 2026) market capitalization runs to roughly $2.25 to $2.29 billion. That is a price-to-sales ratio of about 2.8, a price-to-earnings ratio of about 17 (distorted by the tax benefit above) and — netting out the cash — an enterprise value of 2.35 times annual revenue and 17 times operating profit before depreciation and amortization. For a subscription business growing 9 percent with a 70 percent gross margin and a debt-free balance sheet, that is neither cheap nor expensive. It is ordinary.
More interesting is what the board had calculated. Investment bank Evercore, adviser to the board, discounted the company's own projections — using a cost of capital of 13 to 15 percent and perpetuity growth of 4 to 6 percent — and arrived at a per-share value range of $33.83 to $49.38. The $38.50 offer sits in the lower third of that range. The underlying plan is not modest: it assumes revenue of $997 million for calendar 2027, rising to $1,426 million by 2030.
And that is where the most elegant confirmation of our second uncomfortable truth appears. The projections state adjusted earnings before interest, taxes, depreciation and amortization twice — once before and once after stock-based compensation. For 2027 the figures are $277 million versus $194 million. The $83 million gap is exactly the order of magnitude LiveRamp pays its own workforce in stock each year. Value a software company only on the pre-compensation figure and you overstate it here by roughly 30 percent.
The professionals' view is correspondingly muted: seven analysts carry an average price target of $40.58 (data as of July 24, 2026) — barely above the offer, which is normal in these situations. The market has long since made up its mind: on July 1, 2026 the closing price was $37.68, or 2.1 percent below the offer. Those 2.1 percent are the price the market demands for carrying the residual risk of the vote, antitrust review and CFIUS — a decent annualized return over an expected wait of a few months if all goes well, and a slide back toward the pre-announcement price of $29.66 if it does not.
If you want to see a company serving the same advertising market without a takeover offer on the table, read our analysis of Digital Turbine. And to see how heavily stock-based compensation can shape the results of a subscription software house, put the numbers on AvePoint beside these.
Opportunities and risks at a glance
Opportunities
- The turnaround is documented, not asserted: revenue of $812.9 million (up 9.0 percent), operating income of $83.5 million after $5.4 million, operating margin of 10.3 percent instead of 0.7 percent, free cash flow of $166.4 million — all fiscal 2026.
- A balance sheet without cracks: no financial debt, $379.5 million in cash, $972.0 million of equity, an equity ratio of 75.1 percent (March 31, 2026). The company can wait out any delay in the process.
- A fixed price in both directions: $38.50 in cash, roughly 30 percent above the pre-announcement price. The gap to the July 1, 2026 close of $37.68 was 2.1 percent.
- A second bidder is not excluded: the agreement lets the board consider a superior unsolicited proposal and change its recommendation, against payment of the $32.35 million termination fee.
- The subscription base holds: $545 million of annualized recurring revenue, 107 percent net retention, $760.4 million of remaining performance obligation (March 31, 2026).
Risks
- CFIUS review is the real unknown: a French group is buying a U.S. company whose business is linking American consumer data. The agreement provides an explicit termination right for that scenario.
- The two-thirds hurdle: approval requires 66 2/3 percent of all outstanding shares on August 17, 2026 — every unvoted share acts as a rejection.
- Profit is overstated by taxes: $46.7 million of the result came from a valuation allowance release, leaving only $20.6 million of allowance on foreign loss carryforwards. A price-to-earnings ratio built on that basis misleads.
- Earning power hinges on stock compensation: $83.0 million of stock-based compensation against $83.5 million of operating income; three quarters of the cost decline came from that line.
- Customer concentration: the ten largest customers accounted for roughly 30 percent of fiscal 2026 revenue; no single customer exceeded 10 percent.
- Balance-sheet concentration: goodwill from earlier acquisitions stands at $502.1 million — 38.8 percent of total assets and more than half of equity.
- If the agreement fails, the valuation anchor disappears: the pre-announcement close was $29.66 on May 15, 2026.
A human conclusion
Back to the finish-line trap. What is appealing about LiveRamp is real: this company spent six years working on itself, turned $380.6 million of revenue into $812.9 million and a $180.9 million operating loss into $83.5 million of profit, and it did so without a dollar of debt. If you hunt for turnarounds, you have found one. Except the reward has already been paid out — to everyone who was there before May 16, 2026 and collected the 30 percent premium.
What remains today is a different business from the one the chart advertises. Buying at $37 or $38 does not buy a turnaround or a subscription software house with 107 percent net retention. It buys the probability that three clearances arrive and that two thirds of stockholders say yes on August 17, 2026 — for a premium of just over 2 percent. That can be a sensible calculation. It is simply a completely different calculation from the one you make when you buy a company.
And if the agreement fails, the business lands back on the table — without the price anchor, and with the two questions that have run through this analysis: what does LiveRamp earn once the tax line looks normal again? And what is left of operating income when you measure it against the stock-based compensation that nearly cancels it out? What you make of that is your call. And that is exactly as it should be.
Sources
- SEC annual report 10-K, LiveRamp Holdings, Inc., fiscal 2026 (ended March 31, 2026), filed May 21, 2026
- SEC annual report 10-K, fiscal 2025, filed May 21, 2025
- SEC annual report 10-K, fiscal 2022, filed May 24, 2022 (figures for fiscal 2020 through fiscal 2022)
- SEC quarterly report 10-Q as of December 31, 2025, filed February 5, 2026
- SEC merger proxy DEFM14A, filed July 6, 2026 (special meeting August 17, 2026, Evercore fairness opinion, compensation tables)
- SEC current report 8-K of May 18, 2026 (Items 1.01, 2.02, 5.02, 5.03 — merger agreement, annual results, retention awards, bylaw amendment)
- SEC current report 8-K of July 20, 2026 (Item 5.02 — resignation of director Kristi Argyilan effective July 17, 2026)
- Fundamental data and metrics from our in-house data set (valuation, analyst consensus, scanner metrics; data as of July 24, 2026)
- Our in-house stock scanner, turnaround candidates (U.S. selection) and the Altman Z balance-sheet fortress list, measured July 27, 2026
This analysis is journalistic commentary and expressly not investment advice, not a buy or sell recommendation, and not a solicitation to buy or sell securities. Stocks can lose value substantially at any time; a total loss is possible, and if a merger is not completed the share price can fall back to its pre-announcement level. All figures come from the primary sources named above and carry the reporting date stated there. The author holds no position in the security discussed at the time of publication.
Our Bottom Line at a Glance
- Operating turnaround positive
- A $180.9 million operating loss in fiscal 2020 became $83.5 million of operating income in fiscal 2026; $380.6 million of revenue became $812.9 million. Operating margin rose from 0.7 percent to 10.3 percent and free cash flow to $166.4 million. Annualized recurring revenue $545 million, net retention 107 percent (March 31, 2026).
- Earnings quality negative
- Net income of $146.0 million rests on pre-tax income of $98.1 million: $46.7 million arrived as a tax benefit from a valuation allowance release (effective rate negative 47.6 percent), almost entirely in the closing quarter of fiscal 2026. Only $20.6 million of allowance remains — the effect will not repeat.
- Stock compensation and buybacks negative
- Stock-based compensation of $83.0 million almost exactly equals operating income of $83.5 million; three quarters of the $32.9 million cost decline came from that line. Since 2011, 48.6 million shares have been repurchased for $1.2 billion while 54.0 million shares stand reserved for the equity plans — buybacks as dilution repair.
- Balance sheet positive
- No financial debt, $379.5 million in cash, $972.0 million of equity, an equity ratio of 75.1 percent (March 31, 2026); interest income of $14.8 million against $32 thousand of interest expense. Piotroski F-score 7 of 9, Altman Z 12.55 (data as of July 24, 2026). The drag: $502.1 million of goodwill, 38.8 percent of total assets.
- Merger and process risk neutral
- Publicis is offering $38.50 in cash (about 30 percent above $29.66 on May 15, 2026). Outstanding are approval by two thirds of all outstanding shares on August 17, 2026, antitrust clearances and CFIUS review — no formality for a U.S. data business bought by a French group. On July 1, 2026 the price stood at $37.68, 2.1 percent below the offer.
- Valuation and incentives neutral
- The value range calculated by adviser Evercore runs from $33.83 to $49.38 per share; the offer sits in the lower third. Five executives stand to receive $82.7 million in connection with the sale, more than twice the $32.35 million termination fee; the chief executive has already signed on with Publicis for the period after closing.
LiveRamp is the finish-line trap in its purest form: a company that genuinely completed its turnaround — $812.9 million of revenue, $83.5 million of operating income, $166.4 million of free cash flow in fiscal 2026, without a dollar of debt — but whose reward was handed out on May 16, 2026, when Publicis offered $38.50 per share in cash. What is bought today is therefore not a business but a wager on two-thirds approval on August 17, 2026 and on antitrust and CFIUS clearances, paid at a gap of just over 2 percent to the offer. Anyone still valuing the company as a company must set two figures side by side: $46.7 million of the $146.0 million net income came from a one-off tax benefit, and the entire operating income of $83.5 million matches stock-based compensation of $83.0 million almost dollar for dollar. Not investment advice.
What Our Rating Means
Open questions
The business works in principle, but one material question is open. As long as it stays open, our findings do not carry a quality verdict.
The business is demonstrably there and the balance sheet raises no question of survival: $812.9 million of revenue in fiscal 2026 (up 9.0 percent), $545 million of annualized recurring revenue, 107 percent subscription net retention, $760.4 million of remaining performance obligation, plus $972.0 million of equity, $379.5 million in cash, no financial debt and an equity ratio of 75.1 percent (Piotroski F-score 7 of 9). Two operating questions remain open, and both carry weight. First, earnings quality: of $146.0 million in net income, $46.7 million came from the one-off release of a valuation allowance on deferred tax assets (an effective tax rate of negative 47.6 percent), almost entirely in the closing quarter; only $20.6 million of allowance remains. Second, earning power itself: operating income of $83.5 million matches stock-based compensation of $83.0 million almost dollar for dollar, and three quarters of the $32.9 million cost decline came from that very line. Add $502.1 million of goodwill (38.8 percent of total assets) and customer concentration of roughly 30 percent on the ten largest customers. Demonstrated quality with unresolved earnings quality — that is yellow, not green.
A journalistic assessment by our editorial team at the time of the deep dive, based on public sources — not investment advice and not a solicitation to buy or sell. Your personal circumstances (investment goals, risk capacity, taxes) cannot be taken into account. What our levels mean, how verdicts are formed, and what conflicts of interest exist →
Worth Noting
- LiveRamp reached our research list through our in-house stock scanner for turnaround candidates (U.S. selection). Important for context: the turnaround check produced 6 of 8 points — 44 of the 60 U.S. hits score the same, and that tied group shares ranks 17 through 60. Only the 25 strongest hits are displayed, and LiveRamp is not among them. An exact rank would be a random number at that level of ties. A second hit sits on the Altman Z balance-sheet fortress list. Both lists are recomputed daily (measured July 27, 2026).
- The data basis is the annual report 10-K for fiscal 2026 (filed May 21, 2026, the most recent periodic report), the quarterly report 10-Q as of December 31, 2025, the merger proxy DEFM14A of July 6, 2026 and the 8-K filings of May 18, 2026 and July 20, 2026. Market data as of July 24, 2026. The share count comes from the most recent document that states one (60,786,315 as of the June 18, 2026 record date); the cross-check of share count times documented price ($37.68 on July 1, 2026) confirms market capitalization of roughly $2.29 billion.
- Risk of confusion: LiveRamp Holdings was named Acxiom Corporation until September 2018 — the SEC identifier (CIK 0000733269) and therefore the time series are continuous. Not to be confused with Ramp Business Corporation, a privately held spend management provider. The fiscal year ends March 31, so fiscal 2026 largely covers calendar 2025.
Frequently Asked Questions
LiveRamp Holdings, Inc. (NYSE: RAMP) of San Francisco operates a data collaboration network. Brands, publishers and advertising platforms connect their customer data through it without exchanging names, addresses or email addresses: personal details are replaced by a pseudonymous key called RampID. In fiscal 2026 (ended March 31, 2026) the company generated $812.9 million in revenue, $614.4 million of it from subscriptions and $198.6 million from the data marketplace.
Yes, an agreement is in place. On May 16, 2026 LiveRamp signed a merger agreement with MMS USA Holdings, Inc., a subsidiary of France's Publicis Groupe S.A. Each share is to convert into $38.50 in cash — roughly 30 percent above the closing price of $29.66 on May 15, 2026. Stockholders vote on August 17, 2026, and approval requires two thirds of all outstanding shares. Antitrust clearances and CFIUS review are also outstanding.
Because a substantial part came from the tax line. Pre-tax income of $98.1 million was followed by an income tax benefit of $46.7 million, an effective tax rate of negative 47.6 percent. The cause is the release of a valuation allowance on deferred tax assets ($53.8 million at the federal level, including $28.9 million from states). The effect is one-off and landed almost entirely in the closing quarter, where $19.3 million of pre-tax income produced $70.9 million of net income.
On March 31. Fiscal 2026 therefore runs from April 1, 2025 through March 31, 2026 and largely covers calendar 2025. The annual report (10-K) for that year was filed with the U.S. securities regulator, the SEC, on May 21, 2026. Comparing LiveRamp with competitors that close on December 31 shifts the time series by one quarter.
In fiscal 2026 it was $83.0 million, after $108.0 million the prior year and $71.3 million in fiscal 2024. That equals a little over 10 percent of revenue and almost exactly the $83.5 million of operating income. According to the annual report, the $23.7 million decline explains most of the $32.9 million drop in costs that lifted operating margin from 0.7 percent to 10.3 percent.
The $38.50 price anchor disappears. Before the announcement the shares closed at $29.66 on May 15, 2026. The agreed termination fee of $32.35 million would flow to one side or the other depending on the reason. The repurchase program, on hold since the agreement, would also return with $261.8 million of remaining capacity — 11.4 percent of the roughly $2.29 billion market capitalization.
At $37.70 (data as of July 24, 2026) the price-to-sales ratio is about 2.8 and enterprise value runs to 2.35 times annual revenue. For a debt-free subscription business growing 9 percent, that is neither cheap nor expensive. More telling is the range investment bank Evercore calculated for the board: $33.83 to $49.38 per share. The $38.50 offer sits in the lower third of that range.
Yes. The company was named Acxiom Corporation until September 20, 2018, then briefly Acxiom Holdings, and has been LiveRamp Holdings, Inc. since October 1, 2018. Its SEC identifier (CIK 0000733269) never changed, so the time series is continuous. The former Acxiom Marketing Solutions services business was sold in fiscal 2019 and has been reported as a discontinued operation since.
Found an error?
Did you spot a factual error, an outdated number, or a typo in this deep dive? Let us know briefly — your report goes straight to the editorial team.