Jackson Financial: $5.8 billion of cash flow — and $12 million where the dividend comes from
Our in-house stock scanner ranked Jackson Financial 26th in the U.S. price-to-free-cash-flow list on July 27, 2026, at a ratio of 1.4. The calculation uses consolidated operating cash flow of $5,758 million. In the same annual report the company discloses its own "free cash flow" of $838 million — and for the holding company, the entity that actually pays the dividend and the buybacks, exactly $12 million. All three numbers are correct. They simply measure three different things. A ratio is only ever as honest as the level at which it is measured.
 Thomas Mücke
Founder & Publisher
Thomas Mücke
Founder & Publisher

Chart
Interactive price chart (TradingView).
Note: pure fact-based analysis, not investment advice and not a solicitation to buy or sell. All figures without guarantee.
There is a habit of mind that serves us well in daily life and misleads us reliably in the stock market. Call it the one-till fallacy. It works like this: we hear "the company took in 5.8 billion dollars" and picture a single till. One. Wages come out of it, debts are repaid, dividends are wired. For a bakery that picture is accurate. For an insurance group it is not — there are many tills, and between them sit regulators who prescribe in considerable detail how much may travel upward.
That is exactly how Jackson Financial Inc. (NYSE: JXN) landed on our desk: through a ratio that measures one of those tills and then sounds as though it meant all of them. So here is the deal. Before we celebrate the number, we read together which till it actually counts. The sources are the filings submitted to the U.S. securities regulator, the SEC — the annual report on Form 10-K for 2025 filed February 24, 2026, the quarterly report on Form 10-Q for the period ended March 31, 2026 filed May 5, 2026, and the current reports on Form 8-K through July 22, 2026.
Contents
- What Jackson Financial actually does
- Where the stock landed on our desk — and what a 1.4 ratio measures here
- The numbers over the years — given their due
- What the filings say — the uncomfortable truths
- Valuation: what a share in this insurer really costs
- Opportunities and risks at a glance
- A human conclusion
- Sources
What Jackson Financial actually does
Jackson Financial sells annuities. The basic bargain is quickly told: a customer pays money in, it gets invested, and at some point it comes back out as income. What separates it from a savings account are the guarantees. For a fee, the insurer promises, say, a lifetime minimum withdrawal even if markets collapse in the meantime. That promise is the product — and it is simultaneously the risk.
The company is based in Lansing, Michigan, and became an independent public company on September 13, 2021; before that the business belonged to Prudential plc of the United Kingdom. As of December 31, 2025 it employed roughly 3,890 people, about 3,090 of them full time. It runs three segments: Retail Annuities (the retail business, by far the largest), Institutional Products (funding agreements for large investors) and Closed Life and Annuity Blocks (legacy books no longer actively sold). PPM America, the group's own asset manager, sits alongside them.
The scale is considerable. As of March 31, 2026 Jackson managed $338.0 billion (December 31, 2025: $351.1 billion). According to LIMRA, the industry body, Jackson accounted for 13.6 percent of all U.S. variable annuity sales in the first nine months of 2025 — rank 2 in the market. If an American buys a variable annuity, there is a decent chance this is the company on the paperwork.
And now the feature without which no figure in this analysis makes sense — it is also the central tension: almost all the money sits at the insurance subsidiary, and almost all the obligations to shareholders sit at the holding company. Jackson Financial Inc., the entity that trades on the NYSE, has no operating business of its own. It lives on dividends that its subsidiary, Jackson National Life, is permitted to pay upward. Whether it is permitted is decided not by the board but by the Michigan insurance regulator.
Where the stock landed on our desk — and what a 1.4 ratio measures here
Jackson Financial came to us through our in-house stock scanner, specifically the price-to-free-cash-flow ranking. That list collects every stock with positive free cash flow and a ratio of no more than 10, then sorts them ascending — cheapest first. On July 27, 2026 we counted: the German list showed 835 matches, the English edition of the same screen 544; both had last been recomputed on July 26, 2026. With the market filter set to the United States, the page shows 25 rows — and Jackson Financial sits at rank 26 with a ratio of 1.4, the first row below the visible cut. The last row displayed that day also carried a ratio of 1.4; the ordering is decided in the second decimal.
To repeat it yourself: open the "Stocks" section, then "Scanner", choose the price-to-free-cash-flow ranking and set the market filter to the United States. The lists are recomputed daily — the placement is a dated snapshot from July 27, 2026, not a permanent state.
Now the ratio itself, in plain language. Free cash flow is the money left after all running costs and investments. The price-to-free-cash-flow ratio divides market value by the sum of that amount over the last four quarters. A ratio of 1.4 says, arithmetically: fourteen months of this cash stream equal today's price of the entire company. For a healthy group that would be an exclamation mark.
So let us examine what sits inside that stream. This is where an annuity writer gets interesting, because the obvious suspicion turns out to be wrong — and it is still worth ruling out.
First: it is not customer money. Someone who buys an annuity and pays in is not handing the insurer money it owns; they are handing it an obligation. The annual report says so in dry terms, and it is the single most important sentence for understanding cash flow in this industry:

“Deposits on interest-sensitive life products and investment contracts, principally deferred annuities and guaranteed investment contracts, are treated as policyholder deposits and excluded from revenue.”
— Jackson Financial Inc., SEC Form 10-K for 2025, summary of significant accounting policies
Consistently, these amounts appear in the statement of cash flows not under operating activities but under financing activities — alongside loans and bonds. In 2025 that meant $27,355 million of deposits against $42,245 million of withdrawals, plus $20,761 million transferred out of customers' separate accounts into the general account. Customer money is therefore not in the price-to-free-cash-flow ratio at all. Which is correct, because it was never the company's money.
Second: what does carry the figure is largely accounting. The bridge from profit to operating cash flow is remarkably long in 2025. It starts at net income of $72 million and ends at $5,758 million. In between sit four add-backs for items that cost no cash:
- plus $3,241 million of valuation losses on derivatives — the hedges backing the guarantees,
- plus $1,304 million from funds withheld reinsurance treaties (the investments stay with Jackson while the economics belong to the reinsurer),
- plus $605 million from the valuation of the guarantee liabilities, and
- plus $1,221 million of interest credited to contract holder funds — money written into customer accounts but not paid out.
Everything else together comes to negative $685 million. Follow the arithmetic and you arrive at an uncomfortable insight: the single largest contribution to "free cash flow" is a loss that is added back for accounting reasons.
Third: the real payments for the hedge sit elsewhere. Anyone who wants to know what the derivative book actually cost has to look one section lower, in investing activities. There the line "Settlements related to derivatives and collateral on investments" reads negative $1,106 million for 2025, negative $6,481 million for 2024 and negative $5,475 million for 2023. In 2024, more cash left the company for hedging than the entire operating cash flow of that same year. None of those payments enters any price-to-free-cash-flow ranking anywhere.
Which brings us to the number the company itself considers decisive:
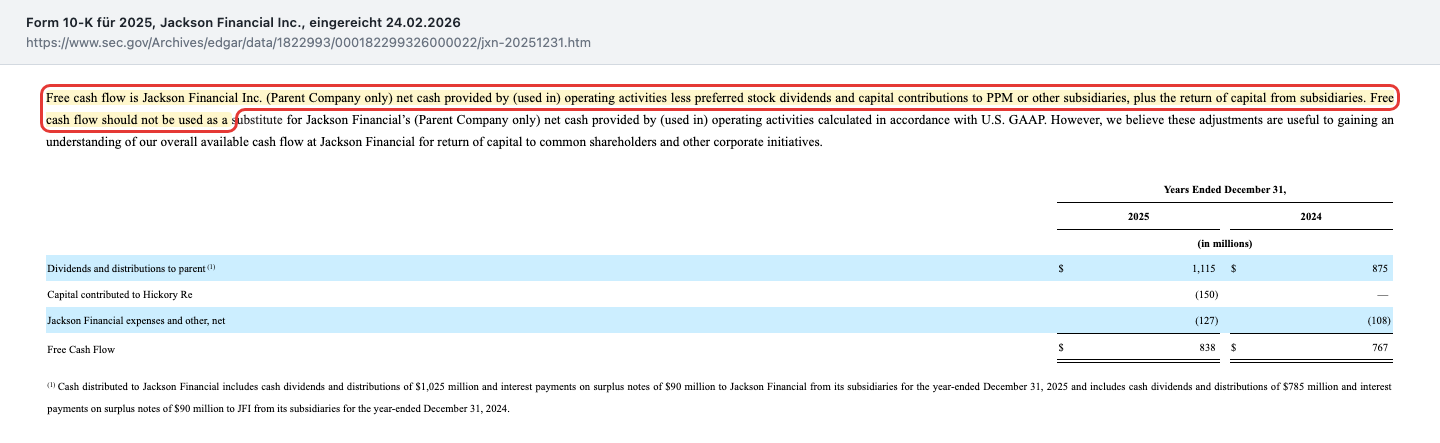
“Free cash flow is Jackson Financial Inc. (Parent Company only) net cash provided by (used in) operating activities less preferred stock dividends and capital contributions to PPM or other subsidiaries, plus the return of capital from subsidiaries.”
— Jackson Financial Inc., SEC Form 10-K for 2025, non-GAAP financial measures
Three words make the difference: "Parent Company only". Which leaves three figures for the same fiscal year standing side by side, all three of them correct:
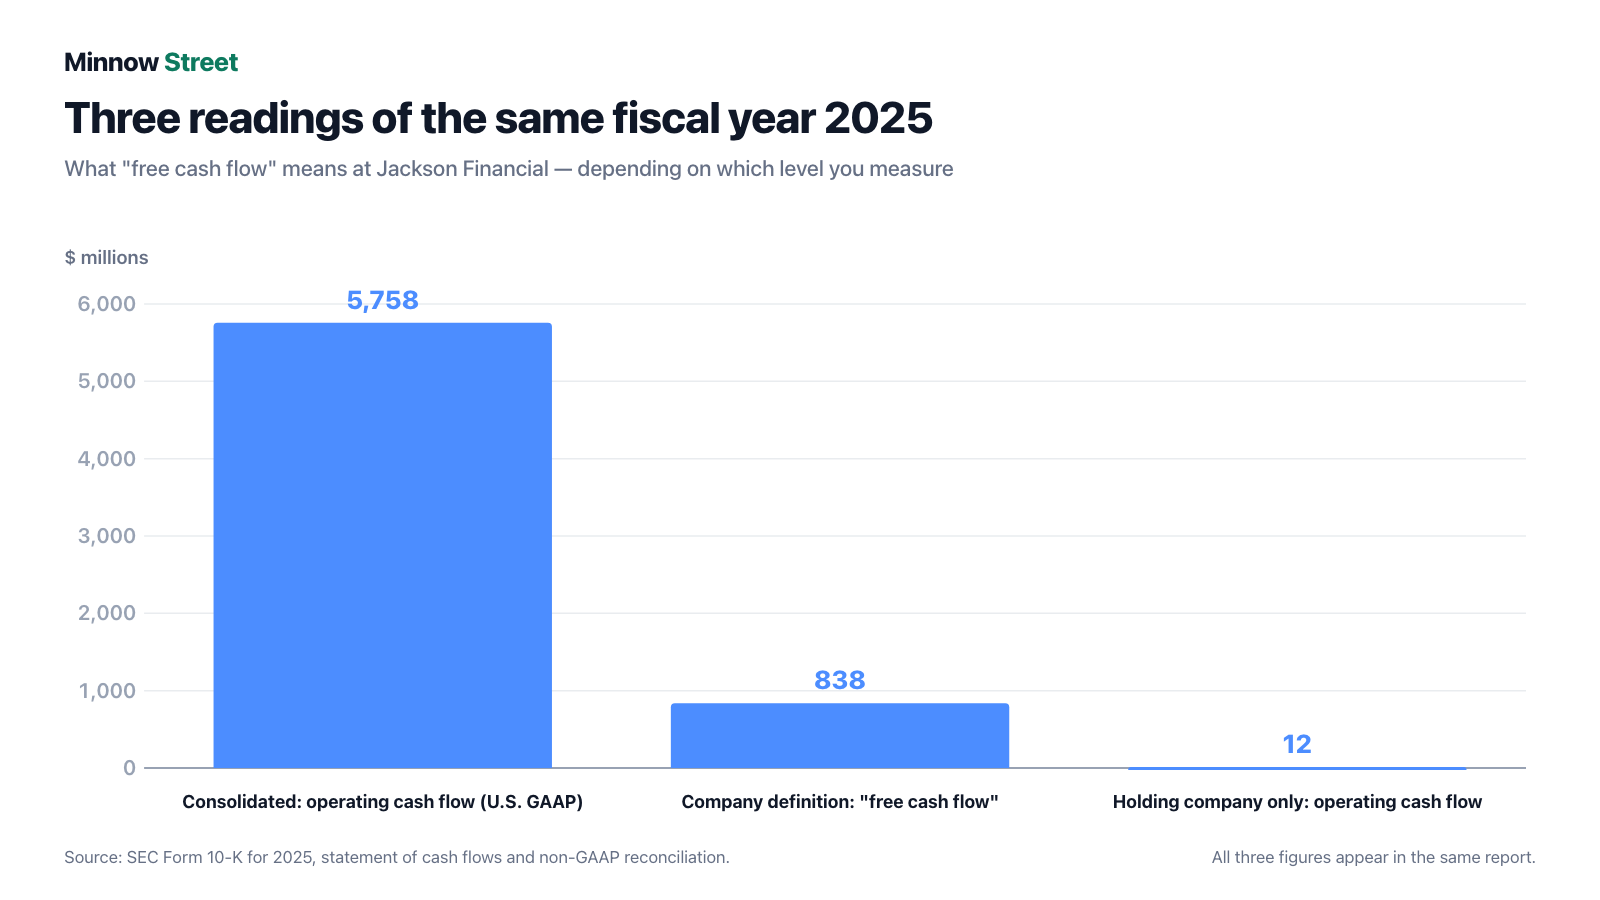
Run the numbers. Against a market value of roughly $8.3 billion (69,743,104 shares per the cover page of the quarterly report, as of April 28, 2026, at the closing price of July 24, 2026), the consolidated figure produces a ratio of about 1.6; the scanner list, working from its own daily-updated data, shows 1.4. The same calculation against the company's own definition produces roughly ten times that: just under 10. And against what the holding company earned by itself, it produces nothing meaningful at all.
A rule worth filing away: at an insurance group the decisive question is not how much cash was generated, but how much of it is allowed to travel upward. We found the same pattern at a direct competitor — in our analysis of F&G Annuities, most of the free cash flow likewise came from positions that economically belong to policyholders and reinsurers. For the same trap seen from the other side, look at Ready Capital, which sat at rank 7 of the same list on the same day.
The numbers over the years — given their due
Start with what genuinely impresses, because there is plenty of it here. Jackson Financial is not a turnaround case but a large, functioning operation with a clear earnings engine. Fee income — the money Jackson charges on customer balances and guarantees — came to $7,983 million in 2025, after $8,083 million in 2024 and $7,680 million in 2023. That is a remarkably stable revenue base above eight billion, year after year.
Sales are growing, and growing where Jackson wants them to. Total sales rose to $23,211 million in 2025 from $19,849 million the year before — up 17 percent. In the first quarter of 2026 retail annuity sales climbed from $4,031 million to $5,279 million, carried by two product families: RILA (an annuity with capped market participation and a built-in loss buffer) nearly doubled to $2,010 million, and fixed index annuities jumped from $35 million to $677 million.
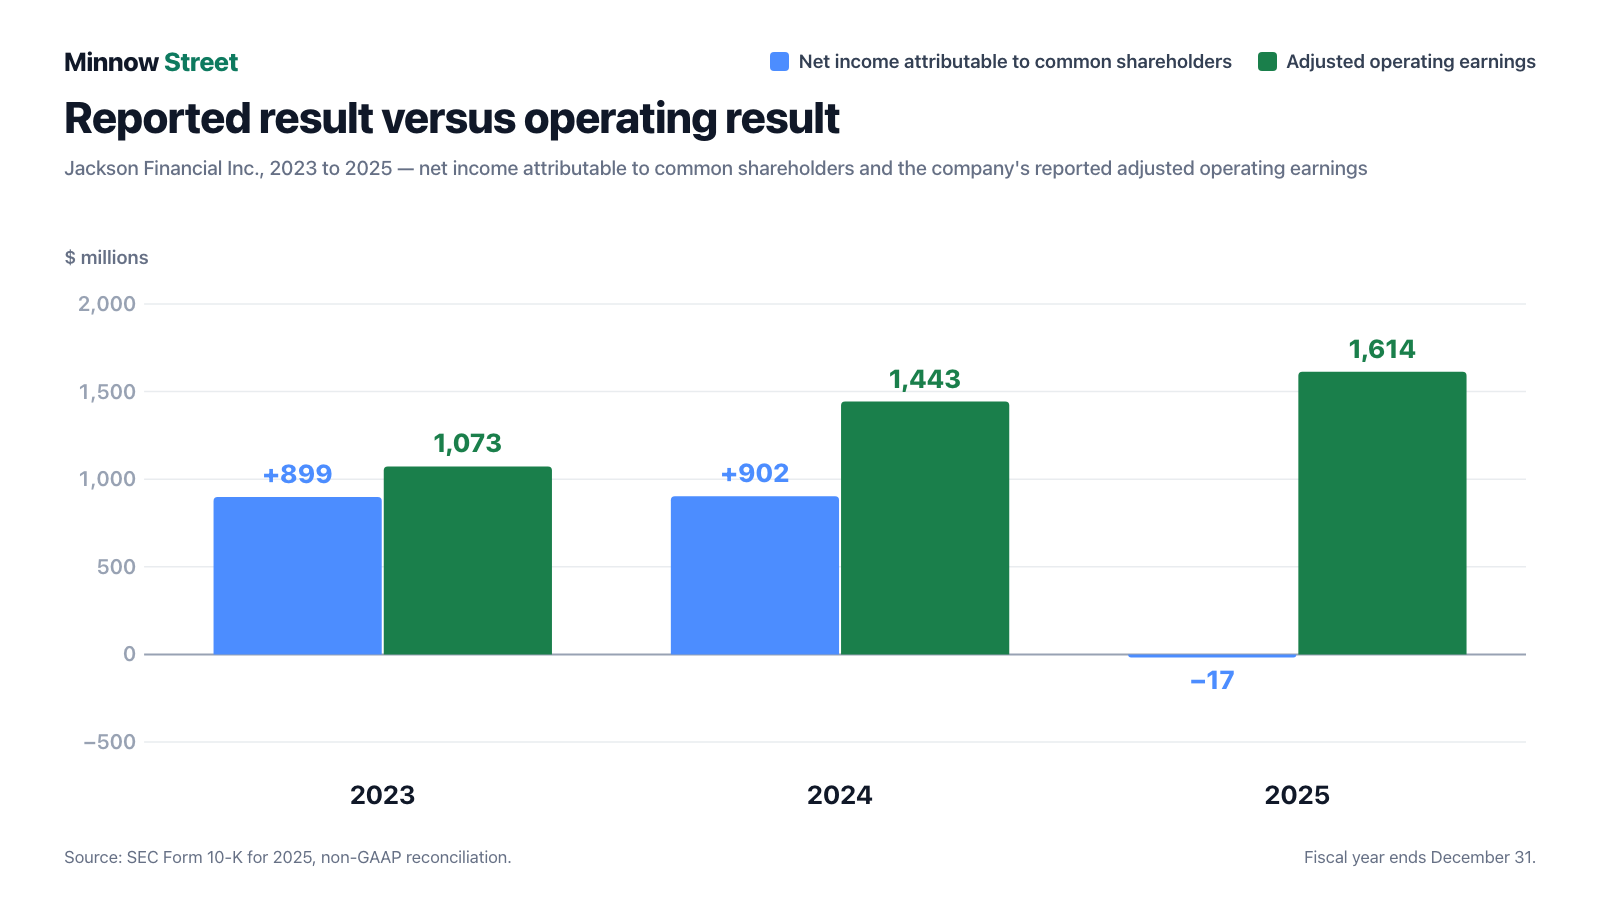
And adjusted operating earnings — the measure Jackson uses to steer the business — have been rising for years:
Capital returned to shareholders is respectable too: $862 million in 2025 ($228 million of dividends, $634 million of buybacks), and the quarterly dividend rose from $0.80 to $0.90 per share. For 2026 the target is $900 million to $1.1 billion. The statutory capital ratio of the insurance subsidiary — the risk-based capital ratio, by which regulators judge whether an insurer holds enough capital for its risks — stood at 567 percent as of December 31, 2025. The zone that draws regulatory attention begins around 200 percent. That is not a tight number; that is a comfortable buffer.
Now the other side. The reported results read entirely differently:
- Net income attributable to common shareholders: $899 million (2023) → $902 million (2024) → negative $17 million (2025). In the first quarter of 2026: negative $435 million, after negative $35 million a year earlier.
- Adjusted operating earnings: $1,073 million → $1,443 million → $1,614 million. In the first quarter of 2026: $361 million, after $376 million.
- Return on equity: reported negative 0.2 percent (2025) and negative 18.9 percent (Q1 2026) — against an adjusted operating return of 14.7 percent and 13.8 percent.
- Total revenues: $3,083 million (2023) → $3,271 million (2024) → $6,683 million (2025). That series is not a growth story but a valuation swing: revenues include the gains and losses on the derivative book, which came to negative $4,661 million in 2025.
To read that last line correctly, look at a single quarter: in the second quarter of 2025 Jackson Financial reported total revenues of negative $483 million. Negative revenue is not a bookkeeping curiosity but the logical consequence of the accounting: when the hedges lose value, the loss is deducted from revenues. Remember the sentence: at this company neither the revenue nor the profit of a single quarter tells you anything about the business.
What the filings say — the uncomfortable truths
Uncomfortable truth no. 1: reported earnings are a weather vane — and that is deliberate
One might assume the swings are an accident. They are not. Jackson hedges the economic risk of its guarantees with derivatives, but the accounting value of those guarantees follows different rules than the value of the derivatives. The two sides therefore move by different amounts — and the difference lands in reported earnings. The company writes this with a candour that is rare:

“We experience net income volatility because we do not directly use hedging to offset the movement in our U.S. generally accepted accounting principles (“U.S. GAAP”) market risk benefit liabilities as market conditions change from period to period.”
— Jackson Financial Inc., SEC Form 10-Q as of March 31, 2026, executive summary
Two consequences for a reader. First: a loss-making quarter is not an alarm signal at this company but normal operation — in the first quarter of 2026, $361 million of operating earnings stood against a reported loss of $435 million. Second, and this is the uncomfortable part: you have to take the company's word for which number is the "right" one. Adjusted operating earnings are a self-defined measure. They are properly derived and fully reconciled in the filings — but they are the board's view, not audited accounting.
Uncomfortable truth no. 2: of $5.8 billion, $838 million arrived at the top — and $862 million went out
Back to the central tension. In 2025 the holding company generated $12 million of operating cash flow from its own activities under U.S. GAAP. Everything else came from below, and the company sets it out line by line: $1,025 million of capital distributions from subsidiaries plus $90 million of interest on an intercompany note, or $1,115 million in total. From that came $150 million contributed to the newly formed reinsurance subsidiary Hickory Re, $119 million of holding-company expenses and $36 million of other items, while $28 million of its own investment income was added. The result: $838 million.
In the same year the holding company paid out $862 million to its common shareholders. That is more than came in — the difference came from existing funds. No drama for one year, but a figure worth remembering when the 2026 target is $900 million to $1.1 billion. For comparison: in the first quarter of 2026 free cash flow under the company's definition was $288 million, and capital returned was $257 million.
One more number belongs in this chapter because it marks the boundary: the risk-based capital ratio fell from 624 percent (2023) to 572 percent (2024) and 567 percent (2025). That is still far from any danger zone. But it is the measure on which the subsidiary's ability to pay dividends upward depends — and it has pointed downward for two years. The company attributes the decline to growth in RILA separate account balances and increased business risk.
Uncomfortable truth no. 3: customers are taking out more than they put in
Sales are growing, and we gave that its due. The book is not. Variable annuity account value — the largest block on the balance sheet — fell from $242,757 million (December 31, 2025) to $229,558 million (March 31, 2026). For the flagship product, the annuity with a guaranteed lifetime withdrawal benefit, it fell from $174,293 million to $164,023 million. On the cash side, 2025 saw $27,355 million of deposits against $42,245 million of withdrawals.
That is the structural challenge of this business: the legacy books written in the big selling years are running off, and new products must grow faster than the old ones shrink. So far that is not fully happening. Add to it a swing that deserves to be named plainly: sales of institutional products collapsed in the first quarter of 2026 from $1,599 million to $110 million — down 93 percent. That business is lumpy by nature; it is written when terms are attractive. But it pulled total quarterly sales down from $5,630 million to $5,389 million even as retail sales rose sharply.
Uncomfortable truth no. 4: $192 million of buybacks — and still more shares
Dilution, in plain terms: your slice of the cake gets smaller because the cake is cut into more pieces. In the first quarter of 2026 Jackson Financial repurchased 1,714,620 of its own shares for $192 million — and the number of shares outstanding still rose from 66,825,632 to 70,270,752, up 5.2 percent. The reason: 4,715,554 treasury shares were reissued for the entry of TPG Inc.
The transaction itself is not a distress measure but a strategic partnership: TPG paid $500 million for roughly 6.5 percent, a Jackson subsidiary received $150 million of TPG shares in return, and both sides entered investment management agreements with an initial ten-year term and renewal options through year fifteen. The $500 million went into Hickory Re, a new reinsurance subsidiary intended to fund the growth of fixed annuities in a capital-efficient way.
Two details deserve attention. First, reissuing the treasury shares produced a book gain of $322 million that did not run through the income statement but was recorded directly in additional paid-in capital. Second, Jackson has committed to minimum fees under the investment management agreements — the filing speaks literally of a "baseline minimum fee payment" owed during the term and any applicable wind-down period. By April 28, 2026 the share count was back down to 69,743,104; whether the year ends below the pre-TPG level will be decided in the next two quarterly reports.
Uncomfortable truth no. 5: the leadership is changing — in the middle of the rebuild
On July 16, 2026, days before the data cut-off of this analysis, the board approved a change at the top. It is so recent that it appears in no quarterly report:

Both successors come from inside the company: Don W. Cummings has been chief financial officer since June 2024 and was the group's chief accounting officer before that; Brian M. Walta runs asset-liability management at the insurance subsidiary and is a qualified actuary. That argues for continuity. Even so: in a company whose earnings hang on a hedging program, the chief executive and the chief financial officer change at the same time — in the year in which Hickory Re, the TPG partnership and the fixed-annuity push are all under way. In addition, the chair of the audit committee, Gregory T. Durant, resigned for health reasons on June 22, 2026; board chair Steven A. Kandarian took over that role.
Valuation: what a share in this insurer really costs
For an insurer, book value is the most natural yardstick — it states what remains for shareholders after every obligation. As of March 31, 2026, common shareholders' equity was $8,963 million across 70,270,752 shares: about $127.55 per share. The closing price on July 24, 2026 was $119.28. That produces a price-to-book ratio of roughly 0.93 — the stock costs less than its share of the balance sheet.
Jackson also publishes an adjusted book value that strips out the valuation swings on its investment portfolio: $10,372 million as of March 31, 2026, or about $147.60 per share. On that basis the stock costs roughly four-fifths of its substance. Both figures point the same way: the market does not fully trust this balance sheet.
Earnings multiples get messy, for a simple reason: a trailing price-to-earnings ratio does not exist, because reported earnings over the last four quarters are negative. Use adjusted operating earnings of $1,614 million (2025) instead and the multiple is about 5. Use the company's own free cash flow of $838 million and it is just under 10. Use consolidated operating cash flow and it is 1.4 to 1.6. Three measures, three orders of magnitude — which is precisely the lesson of this analysis.
The dividend is more tangible: $0.90 per quarter, or $3.60 a year, which is roughly 3.0 percent against the closing price of July 24, 2026. It is funded out of the $838 million that arrived at the top in 2025 — the dividend itself cost $228 million.
What the professionals think, in context: as of July 26, 2026 there were five analyst opinions on record — one buy, three holds and one strong sell, at an average price target of $134.25. That is thin coverage for a company of this size, and the spread says the same thing as our arithmetic above: opinions on what this business is worth diverge.
One note for context, because our scanner displays it as well: the Altman Z-score, a bankruptcy early-warning measure built from several balance-sheet ratios, is not used as an argument here. It was designed for industrial companies and carries no information for an insurance balance sheet that consists 97 percent of obligations to customers. What matters at an annuity writer is sales, account value, net investment income, adjusted operating earnings and the risk-based capital ratio — and we read those above.
Opportunities and risks at a glance
What speaks for the company:
- Market position: rank 2 in U.S. variable annuities with a 13.6 percent share (LIMRA, nine months to September 30, 2025) and $338.0 billion of assets under management (March 31, 2026).
- Stable fee base: $7,983 million of fee income in 2025 — a revenue stream only indirectly exposed to market swings.
- Rising operating earnings: from $1,073 million (2023) to $1,614 million (2025), at an adjusted operating return on equity of 14.7 percent.
- Capital buffer: risk-based capital ratio of 567 percent at the insurance subsidiary as of December 31, 2025, far above the regulatory action level.
- Fresh capital and a partner: $500 million from TPG, a new $1.25 billion revolving credit facility through 2031 and $750 million of notes due 2037 — funding is settled for years.
- Reliable distributions: quarterly dividend raised from $0.80 to $0.90 per share, with a 2026 capital return target of $900 million to $1.1 billion.
What speaks against it:
- The ratio misleads: the free cash flow that lifts the stock into the ranking is a consolidated figure. At the holding company, $838 million arrived in 2025, of which $12 million came from its own operations.
- Shrinking book: variable annuity account value fell from $242,757 million to $229,558 million in one quarter; in 2025, $27,355 million of deposits met $42,245 million of withdrawals.
- Unreadable earnings: a reported loss of $435 million in the first quarter of 2026 against $361 million of operating earnings; quarterly revenues can turn negative (Q2 2025: negative $483 million).
- Declining capital buffer: risk-based capital ratio of 624 percent (2023), 572 percent (2024) and 567 percent (2025) — the measure that governs how much the subsidiary may pay upward.
- More shares despite buybacks: 66,825,632 (December 31, 2025) to 70,270,752 (March 31, 2026) through the TPG issuance; capital returned in 2025, at $862 million, exceeded free cash flow of $838 million.
- Leadership change during a rebuild: new chief executive and chief financial officer effective October 1, 2026, plus the resignation of the audit committee chair on June 22, 2026.
- More expensive refinancing: the notes issued in June 2026 carry 6.150 percent; among the obligations to be repaid are $400 million at 5.170 percent.
A human conclusion
Back to the one-till fallacy. It put this stock on our desk, and its arithmetic was correct: a price-to-free-cash-flow ratio of 1.4 is not an invention. The error happens afterwards, in the head, the moment "$5.8 billion of cash flow" silently becomes "$5.8 billion available to spend".
At Jackson Financial that is demonstrably not the case — and the remarkable part is that the company says so itself. It computes its own measure in its own annual report, because it knows the consolidated number is the wrong level for a shareholder. Read the $838 million instead of the $5,758 million and you do not see a worse company; you see a different one: a business that earns solidly, distributes properly and trades at roughly book value. That is a perfectly respectable case. It is simply not a bargain at 1.4 times cash flow.
What occupied us longest is not the ratio but the direction of the book. An annuity writer lives on keeping large the balances it charges fees on. At Jackson that block is shrinking while new sales grow — both at once, in the same filings. Whether new business is fast enough to replace the run-off is the real question in this stock. It will not be answered in one quarter but over years.
There is a story that argues for this stock: that RILA and fixed annuities keep growing, that Hickory Re and the TPG partnership fund that growth without straining capital, that the new leadership keeps the distribution policy intact — and that a share trading below book value eventually gets re-rated. And there is the counter-story: that legacy balances run off faster than new business can replace them, that the risk-based capital ratio keeps falling and with it the room to send money upward. What you make of that is your decision. And that is exactly as it should be.
Sources
- Jackson Financial Inc., Form 10-K for 2025 (filed February 24, 2026) — business and segments, human capital, LIMRA market share, consolidated statements of cash flows, accounting policies, reconciliation of adjusted operating earnings and free cash flow, liquidity and risk-based capital
- Form 10-Q for the quarter ended March 31, 2026 (filed May 5, 2026) — most recent periodic report: income statement, statements of cash flows, sales and account value, Note 13 (long-term debt), Note 19 (equity, TPG transaction), cover-page share count as of April 28, 2026
- Form 10-K for 2024 (filed February 26, 2025) — comparative series for adjusted operating earnings, free cash flow and the risk-based capital ratio
- Form 8-K of July 22, 2026, Item 5.02 — leadership change effective October 1, 2026, retirement of Laura L. Prieskorn effective September 30, 2026
- Form 8-K of July 1, 2026, Item 1.01 — new $1.25 billion revolving credit agreement dated June 30, 2026, maturing 2031, with financial maintenance covenants
- Form 8-K of June 15, 2026, Item 2.03 — issuance of $750 million of 6.150 percent senior notes due January 15, 2037
- Form 8-K of June 25, 2026, Item 5.02 — resignation of Gregory T. Durant from the board on June 22, 2026
- Form 8-K of May 26, 2026, Item 5.07 — results of the annual meeting held May 21, 2026, ratification of KPMG LLP as auditor
- Screening and valuation data: our in-house stock scanner and fundamental data (as of July 26, 2026), including the price-to-free-cash-flow ranking (U.S. selection, rank 26 behind 25 displayed rows, ratio 1.4; German list 835 matches, English list 544 matches, last recomputed July 26, 2026, measured by us on July 27, 2026)
Note: This article is journalistic analysis of publicly available documents and is not investment advice, nor a solicitation to buy or sell securities. Share prices can move sharply; at a life insurer, earnings additionally depend on interest rate and equity markets and on regulatory capital requirements, and a total loss is possible with any equity investment. Every figure carries the as-of date of its source; market data are as of July 26, 2026. The author holds no position in Jackson Financial Inc. or in TPG Inc. at the time of publication.
Our Bottom Line at a Glance
- Business model and market position positive
- Rank 2 in U.S. variable annuities with a 13.6 percent market share (LIMRA, nine months to September 30, 2025) and $338.0 billion of assets under management (March 31, 2026). Fee income was $7,983 million in 2025 and barely moves. Sales rose to $23,211 million in 2025 from $19,849 million; in the first quarter of 2026 retail annuity sales climbed from $4,031 million to $5,279 million.
- The hook and the metric negative
- Rank 26 in our in-house price-to-free-cash-flow ranking (U.S. selection) at a ratio of 1.4, measured on July 27, 2026 (835 matches on the German list, 544 on the English list, 25 rows shown each). The arithmetic is right but the level is wrong: the underlying consolidated operating cash flow of $5,758 million (2025) is carried by non-cash add-backs, $3,241 million of derivative losses alone. Jackson Financial itself reports $838 million for the same year.
- Earnings power, read adjusted positive
- Adjusted operating earnings rose from $1,073 million (2023) to $1,443 million (2024) and $1,614 million (2025); the adjusted operating return on equity was 14.7 percent in 2025 and 13.8 percent in the first quarter of 2026. Reported earnings are unreadable by contrast: negative $17 million in 2025 and negative $435 million in the first quarter of 2026, because the accounting movement of the guarantee liabilities is deliberately left unhedged.
- Book and outflows negative
- Variable annuity account value fell from $242,757 million (December 31, 2025) to $229,558 million (March 31, 2026), and for the lifetime-withdrawal product from $174,293 million to $164,023 million. In 2025, $27,355 million of deposits met $42,245 million of withdrawals. Sales of institutional products collapsed in the first quarter of 2026 from $1,599 million to $110 million.
- Capital, distributions and share count neutral
- The subsidiary's risk-based capital ratio fell from 624 percent (2023) to 572 percent (2024) and 567 percent (2025) — far above the action level, but with a clear direction. Capital returned in 2025, at $862 million, exceeded free cash flow of $838 million. Despite $192 million of buybacks, shares outstanding rose in the first quarter of 2026 from 66,825,632 to 70,270,752 because 4,715,554 shares were issued to TPG; by April 28, 2026 the count was 69,743,104.
- Leadership and rebuild in progress neutral
- On July 16, 2026 the board approved a change at the top effective October 1, 2026: chief financial officer Don W. Cummings becomes chief executive, Brian M. Walta becomes chief financial officer, and Laura L. Prieskorn retires on September 30, 2026. Both successors come from inside the company. Running in parallel are the TPG partnership with its committed minimum fee, the build-out of reinsurance subsidiary Hickory Re and the fixed-annuity push; the audit committee chair also resigned on June 22, 2026.
Jackson Financial is a large, functioning annuity writer with a stable fee base of $7,983 million (2025), rising adjusted operating earnings of $1,614 million and a subsidiary capital ratio of 567 percent. The metric that lifts the stock to rank 26 of the price-to-free-cash-flow ranking, however, measures the wrong level: it divides market value by consolidated operating cash flow of $5,758 million, which consists largely of non-cash add-backs. At the holding company, the entity that pays the dividend and the buybacks, $838 million arrived in 2025 — $12 million of it from its own operations. On that figure the stock costs roughly ten times cash flow rather than one and a half, and it trades at a price-to-book ratio of about 0.93. The open question is whether new business replaces the run-off: variable annuity account value fell by $13.2 billion in a single quarter. Not investment advice.
What Our Rating Means
Open questions
The business works in principle, but one material question is open. As long as it stays open, our findings do not carry a quality verdict.
Amber stands here for a sound business with a misleading metric and an open question about the book. Arguing for the middle grade is documented substance: rank 2 in the U.S. variable annuity market, $7,983 million of fee income in 2025, adjusted operating earnings that rose from $1,073 million to $1,614 million in two years, a risk-based capital ratio of 567 percent and a dividend raised since the separation. Arguing against the green grade are equally documented findings: reported earnings were negative in 2025 and sharply negative in the first quarter of 2026 at minus $435 million; variable annuity account value fell in one quarter from $242,757 million to $229,558 million; withdrawals exceeded deposits by $14,890 million in 2025; the risk-based capital ratio has declined for a second year; and capital returned in 2025 exceeded what arrived at the top. There is no basis for the red grade — no going-concern qualification, no negative equity, no maturity squeeze; funding is secured for years by a $1.25 billion revolver through 2031 and notes due 2037. The decision is yours.
A journalistic assessment by our editorial team at the time of the deep dive, based on public sources — not investment advice and not a solicitation to buy or sell. Your personal circumstances (investment goals, risk capacity, taxes) cannot be taken into account. What our levels mean, how verdicts are formed, and what conflicts of interest exist →
Worth Noting
- Hook and reference: rank 26 in our in-house price-to-free-cash-flow ranking (U.S. selection) at a ratio of 1.4, measured by us on the live scanner pages of both brands on July 27, 2026. The German list showed 835 matches that day, the English edition of the same screen 544; 25 rows are displayed in each case, and the last visible row also carried a ratio of 1.4 — Jackson Financial sits immediately behind it. The scanner lists are recomputed daily, last on July 26, 2026; the placement is a dated snapshot, not a permanent state.
- Where the low ratio comes from — checked, not assumed: the ranking divides market value by free cash flow over the last four quarters, here consolidated operating cash flow ($5,758 million in 2025; the last four reported quarters sum to $5,209 million). Customer money is not included: the annual report explicitly treats deposits as policyholder deposits and excludes them from revenue; in the statement of cash flows they sit under financing activities (2025: $27,355 million of deposits against $42,245 million of withdrawals, plus $20,761 million transferred out of separate accounts). What carries the operating figure are non-cash add-backs: plus $3,241 million of derivative losses, plus $1,304 million from funds withheld reinsurance, plus $605 million from market risk benefits, plus $1,221 million of interest credited, minus $685 million of everything else — starting from net income of $72 million. The real payments on the hedging program sit in investing activities: negative $1,106 million (2025), negative $6,481 million (2024), negative $5,475 million (2023).
- Market value cross-check: 69,743,104 shares per the cover page of the quarterly report (as of April 28, 2026) at the closing price of $119.28 on July 24, 2026 produce roughly $8.32 billion; fundamental data show $8.32 billion (as of July 26, 2026) — a deviation of less than one percent. From that follow the ratios cited in the text: about 1.6 against consolidated cash flow of the last four quarters and just under 10 against the company definition. The scanner list works from its own daily-updated market value and shows 1.4.
- Metric selection for an annuity writer: sales, account value, net investment income, adjusted operating earnings and the statutory risk-based capital ratio are what matter. The Altman Z-score displayed by the scanner was designed for industrial companies and carries no information for an insurance balance sheet; it is not used as an argument here. A trailing price-to-earnings ratio does not exist because reported earnings over the last four quarters are negative.
- Mandatory takeover check: none pending. There is no SC 13E-3, no DEFM14A, no Form 25 and no Form 15 in the filing history since the separation; the common stock and the preferred depositary shares trade on the NYSE as before. The only equity transaction is TPG Inc. acquiring roughly 6.5 percent for $500 million, announced January 6, 2026 and completed February 11, 2026 — a minority stake with investment management agreements including a committed minimum fee, not a takeover bid.
- Recency gate: the most recent periodic report is the Form 10-Q for the quarter ended March 31, 2026 (filed May 5, 2026) and it has been fully reviewed. Every filing after that date was examined — Form 8-K of May 26, 2026 (annual meeting), June 15, 2026 ($750 million of 6.150 percent senior notes due 2037), June 25, 2026 (resignation of Gregory T. Durant), July 1, 2026 (new $1.25 billion revolver) and July 22, 2026 (leadership change effective October 1, 2026). The share count comes from the cover page of the quarterly report (as of April 28, 2026), not from the balance sheet date.
- Risk of confusion: Jackson Financial Inc. (JXN) is the listed holding company; Jackson National Life Insurance Company is the operating insurance subsidiary and has no listing of its own. Brooke Life Reinsurance Company and Hickory Brooke Reinsurance Company are two separate captive reinsurers in Michigan with different purposes. TPG Inc. holds a minority stake but is an independent filer with its own SEC reports.
Frequently Asked Questions
Because the ranking divides market value by free cash flow over the last four quarters, using consolidated operating cash flow, which was $5,758 million in 2025. On July 27, 2026 that produced rank 26 in the U.S. selection at a ratio of 1.4. Jackson Financial itself reports free cash flow of $838 million for the same year, because the company's measure covers only the holding company.
No. The 2025 annual report states verbatim that deposits on annuity and investment contracts are treated as policyholder deposits and excluded from revenue. In the statement of cash flows they therefore sit under financing activities: $27,355 million of deposits against $42,245 million of withdrawals in 2025. They do not enter the ratio at all.
Mostly add-backs for items that cost no cash. From 2025 net income of $72 million, the bridge to $5,758 million includes plus $3,241 million of derivative valuation losses, plus $1,304 million from funds withheld reinsurance, plus $605 million from market risk benefits and plus $1,221 million of interest credited. The real payments on the hedging program sit in investing activities.
Because it deliberately does not hedge the accounting movement of its guarantee liabilities. When derivatives and liabilities move by different amounts, the difference lands in reported earnings. In the first quarter of 2026, $361 million of adjusted operating earnings stood against a reported loss of $435 million. The company therefore steers the business using adjusted operating earnings.
It is paid out of what the insurance subsidiary is allowed to send upward. In 2025, $1,115 million reached the holding company, leaving $838 million after all deductions; the dividend cost $228 million. The governing measure is the subsidiary's statutory risk-based capital ratio, which stood at 567 percent as of December 31, 2025, after 572 percent (2024) and 624 percent (2023).
No. There is no SC 13E-3, no merger proxy on DEFM14A, no Form 25 and no Form 15 in the filing history since the separation. The only equity transaction is TPG Inc. acquiring roughly 6.5 percent for $500 million, announced January 6, 2026 and completed February 11, 2026 — a minority stake with investment management agreements, not a takeover bid.
Because it was designed for industrial companies and treats debt as a hazard across the board. A life insurer's balance sheet, however, consists almost entirely of obligations to customers matched by investments. The meaningful measures are sales, account value, net investment income, adjusted operating earnings and the statutory risk-based capital ratio.
On July 16, 2026 the board resolved that chief financial officer Don W. Cummings will become chief executive officer and president effective October 1, 2026, with Brian M. Walta taking over as chief financial officer. Laura L. Prieskorn steps down at the end of September 30, 2026 and stays on as an advisor through December 31, 2026. Both successors come from inside the company.
Found an error?
Did you spot a factual error, an outdated number, or a typo in this deep dive? Let us know briefly — your report goes straight to the editorial team.