Interface Reports Earnings per Share Up 81.8 Percent — and the Quarter Was a Week Longer
The carpet tile maker from Atlanta posted first-quarter 2026 numbers that light up every earnings-surprise filter: net sales up 11.3 percent, diluted earnings per share up 81.8 percent. The first footnote of the quarterly report carries the part no headline repeats — the quarter ended April 5, 2026 and ran 14 weeks, while the prior-year quarter ran 13. A stronger euro added roughly $13.4 million, and the effective tax rate dropped by almost six points. We count the weeks before we believe the percentages.
 Thomas Mücke
Founder & Publisher
Thomas Mücke
Founder & Publisher
Chart
Interactive price chart (TradingView).
Note: pure fact-based analysis, not investment advice and not a solicitation to buy or sell. All figures without guarantee.
There is an investor trap nobody treats as one, because it looks so harmless. Call it calendar blindness. It works like this: you read "net sales up 11.3 percent" and "diluted earnings per share up 81.8 percent," and your head automatically compares two things of equal size — quarter against quarter, apples against apples. Except that at many U.S. companies a quarter is not three calendar months but a package of weeks. And sometimes one package holds a week more than the other. Interface, Inc. (NASDAQ: TILE), the Atlanta maker of modular carpet tile, just delivered exactly that kind of quarter: the first quarter of fiscal 2026 ended April 5, 2026 and ran 14 weeks, while the prior-year quarter ended March 30, 2025 and ran 13. On our side the stock landed at rank 39 in our in-house Big Earnings Surprise ranking (U.S. selection, as of July 25, 2026). So let us make a deal: before you file those percentages away, we count the weeks together — and read what Interface actually reported to the U.S. securities regulator, the SEC. At the end, you decide.
What Interface Actually Does — Carpet in Tile Form, for More Than 50 Years
Interface sells flooring for commercial interiors. Everyone knows the everyday picture without ever having named it: the gray, patterned carpet in the open-plan office, the classroom, the clinic, the airport gate. What sets the company apart is the format. Instead of a roll that is installed as one piece and ripped out as one piece, Interface ships carpet tiles — square modules you swap individually when one spot wears out. Three more legs round out the business: luxury vinyl tile (LVT in the filings), rubber flooring under the German nora brand acquired in 2018, and residential carpet tile under the FLOR brand.
The scale: 3,570 employees as of December 28, 2025, of whom 2,203 work in manufacturing. The company was founded in Georgia in 1973 and has been publicly traded since 1990. Interface runs two reportable segments — AMS for the Americas and EAAA for Europe, Africa, Asia and Australia. Customers outside the United States accounted for 43 percent of fiscal 2025 sales, and no single customer represented more than 10 percent of revenue. Sustainability is part of the equity story: Interface calls itself a global sustainability leader, has sold carpet tile with a "CQuest" backing since 2020, and advertises that individual products carry a negative carbon footprint from raw material extraction to the factory gate.
And a word about the calendar, because otherwise every figure slips. The fiscal year does not end on December 31 but on the Sunday nearest December 31. Fiscal 2025 ran through December 28, 2025 and had 52 weeks. Fiscal 2026 began December 29, 2025 and, per the company's own cover page, ends January 3, 2027 — that is 53 weeks.
That fixes the central tension of this analysis, and it runs through every chapter: Interface really did deliver operationally — but the most spectacular quarter in the company's recent history owes a meaningful share of its shine to three things that have nothing to do with carpet: an extra week, the euro, and the tax line.
Where This Stock Came Across Our Desk
Interface sits at rank 39 in the U.S. selection of our in-house stock scanner for big earnings surprises (as of July 25, 2026), with a relative strength rating of 71 out of 100. To reproduce it: open the stock scanner section, pick the "Big Earnings Surprise" list, filter to the U.S. selection and read the ranking from the top. One thing to know: these lists are recomputed daily — today's rank is not tomorrow's rank.
What does the filter measure? It looks for companies whose actual earnings per share came in well above the analyst estimate. At Interface the quarter ended April 5, 2026 supplies the line: $0.40 of diluted earnings per share against $0.22 a year earlier, up 81.8 percent. Net sales rose from $297.4 million to $331.0 million.
Now the translation, because naming a number is not judging it. A relative strength rating of 71 means the share price outperformed 71 percent of all covered stocks over the past twelve months — solid, but far from the 90s that make momentum investors sit up. And the earnings surprise itself has a calendar behind it. Remember this line: a growth rate only says something about the business when the numerator and the denominator are the same length. How quickly such a surprise shrinks under a closer look is something we worked through at furniture maker Flexsteel, where a spectacular swing to profit came down to exactly one cent once adjusted.
The Numbers Over the Years — Honestly Credited
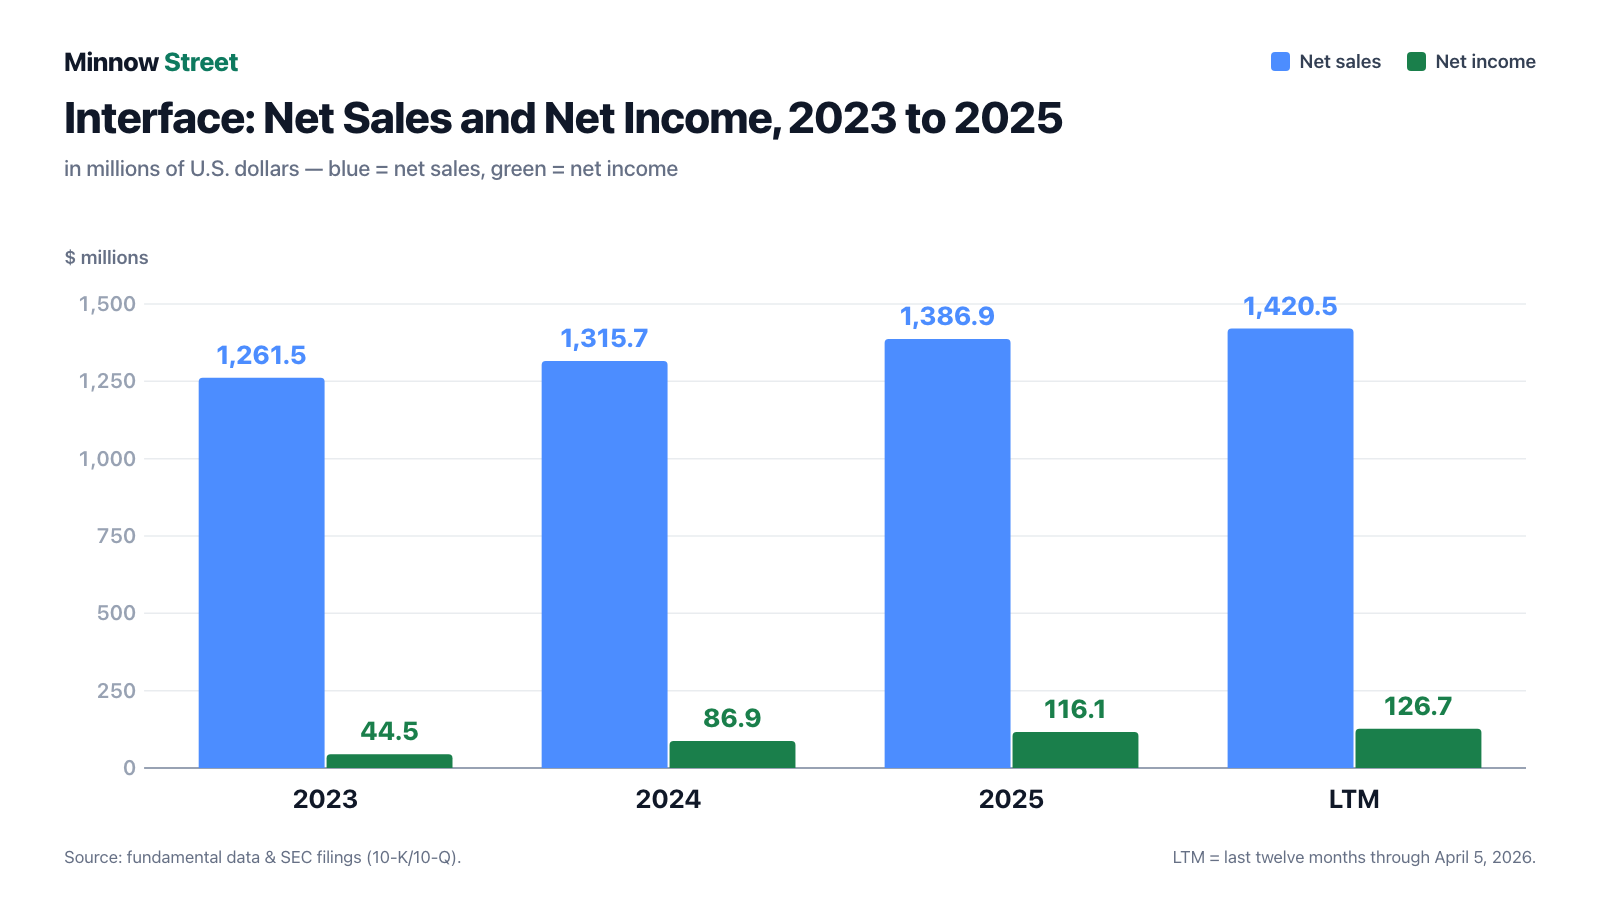
First what genuinely impresses, and there is plenty. Interface has grown for three years, and the earnings side is growing faster than the top line: $1,261.5 million of net sales in fiscal 2023, then $1,315.7 million (up 4.3 percent) and $1,386.9 million in fiscal 2025 (up 5.4 percent). Over the twelve months through April 5, 2026 the figure is $1,420.5 million.
The real progress sits in the margin. Gross profit — what is left after materials and manufacturing — rose from 35.0 percent of net sales (2023) through 36.7 percent to 38.7 percent (2025). Operating income climbed from $104.5 million through $134.4 million to $164.0 million, lifting the operating margin from 8.3 to 11.8 percent. Net income rose from $44.5 million through $86.9 million to $116.1 million, and diluted earnings per share from $0.76 through $1.48 to $1.96. In two years, earnings per share have more than doubled.
The cash arrives too, not just the accounting profit. Cash from operations came to $142.0 million (2023), $148.4 million (2024) and $167.9 million (2025) — above net income in each of those years. After capital expenditures of $26.1 million, $33.8 million and $46.2 million, free cash flow was $115.9 million, $114.6 million and $121.7 million. The balance sheet as of April 5, 2026 is tidy to match: $1,205.8 million of total assets, of which $634.6 million is equity — an equity ratio of 52.6 percent. Debt stands at $196.7 million against $61.2 million of cash, leaving $135.3 million of net debt. By the company's own math that is 0.6 times adjusted EBITDA for the last twelve months ($227.6 million). This is a balance sheet built for weather.
Inconvenient Truth No. 1: The Quarter Was a Week Longer
The most important number of the quarter is not in the earnings table but in Note 1 of the quarterly report, right behind the boilerplate on accounting policies:
"The three-month period ended April 5, 2026 includes 14 weeks, and the three-month period ended March 30, 2025 includes 13 weeks."
— Interface, Inc., Form 10-Q for the quarter ended April 5, 2026, Note 1

Interface does not hide it — quite the opposite. Management's discussion says so directly: net sales rose "primarily due to higher sales volume partially driven by an extra week in 2026." The earnings release of May 8, 2026 puts the note in its header line as well.
What the company does not do is quantify that week. Nowhere in the quarterly report or the earnings release is there a dollar figure for it. And beware the obvious back-of-the-envelope math that one week out of 14 must be around 7 percent: the extra week fell at the start of the quarter, in the days between Christmas and New Year — the weakest stretch of the calendar for a supplier to offices, schools and clinics. Its contribution is likely well below the weekly average. What stays honest is this: part of the increase is calendar, and only Interface knows how much.
Inconvenient Truth No. 2: Nearly Half the Sales Increase Came From the Euro
Of the $33.6 million of additional net sales, a large share came from the currency market. Management's discussion names the number: exchange rate movements had a positive impact of roughly $13.4 million, or 5 percent, driven mainly by a stronger euro. The earnings release does the same math from the other side: on a currency-neutral basis, net sales were $317.6 million, up 6.8 percent instead of 11.3.
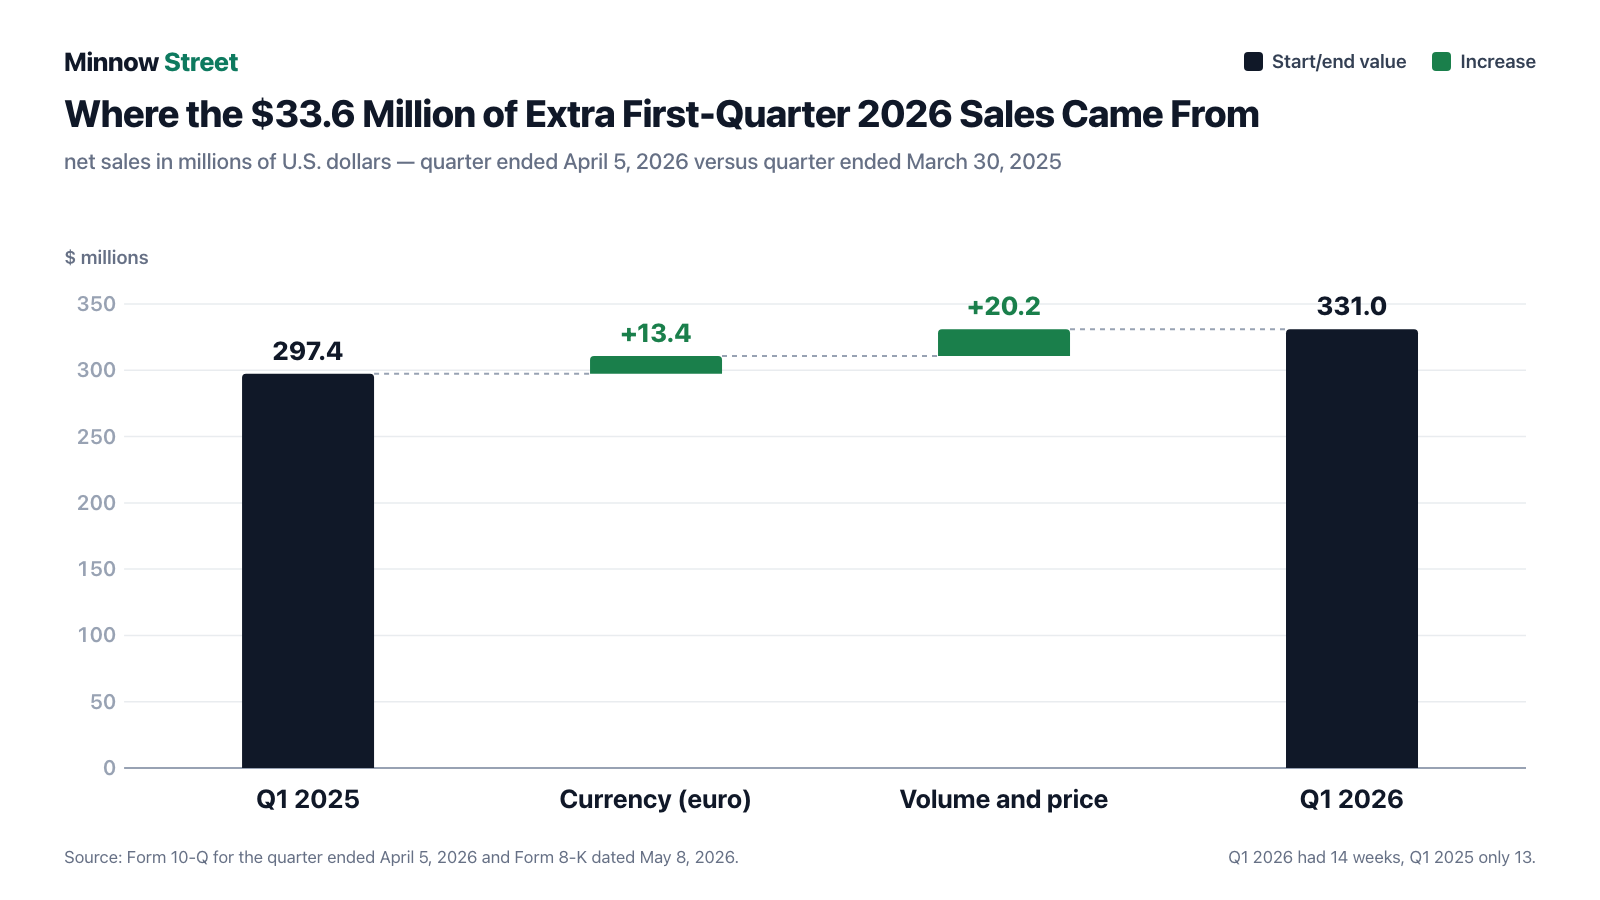
The effect is starkest in the international segment. EAAA reported net sales of $135.4 million, up 15.2 percent — currency-neutral it was $122.6 million and 4.3 percent. Almost eleven of those fifteen percentage points were the euro and the Australian dollar. In the home segment AMS the effect is small: $195.7 million as reported against $195.1 million currency-neutral. A currency gain is not a bad gain — it is simply not one management can repeat on demand.
Inconvenient Truth No. 3: The Tax Line Helped Too — Once
The third quiet helper sits in taxes. The effective tax rate for the quarter ended April 5, 2026 was 18.3 percent against 24.0 percent a year earlier, driven by higher tax benefits from share-based compensation. Do the math: pre-tax income rose from $17.1 million to $28.9 million, up 68.9 percent. Net income rose 81.6 percent. The gap of roughly 13 percentage points is pure tax.
Interface itself says this will not last. In the outlook of May 8, 2026 the company guides to an adjusted effective tax rate of 28.0 percent for the second quarter of 2026 and 26.0 percent for the full year — up from the previous 25.0 to 26.0 percent. The same pattern shows on an annual basis: the effective tax rate was 30.1 percent in 2023, 23.4 percent in 2024 and only 15.2 percent in 2025. Of the 33.6 percent increase in fiscal 2025 net income, therefore, only 20.5 percentage points came from better pre-tax earnings.
Inconvenient Truth No. 4: The Business Leans on the Office — and Interface Warns About It Itself
Interface has deliberately broadened its base over the years: education, healthcare, government buildings, transportation, residential. Even so, the office remains the single largest market. 44 percent of fiscal 2025 net sales came from corporate office (2024: 47 percent, 2023: 49 percent), and in the first quarter of 2026 the share rose back to 47 percent — the quarter's growth, per the report, came mainly from there. What reads as good news is also the return of an old dependency. And the annual report itself says what to make of it:
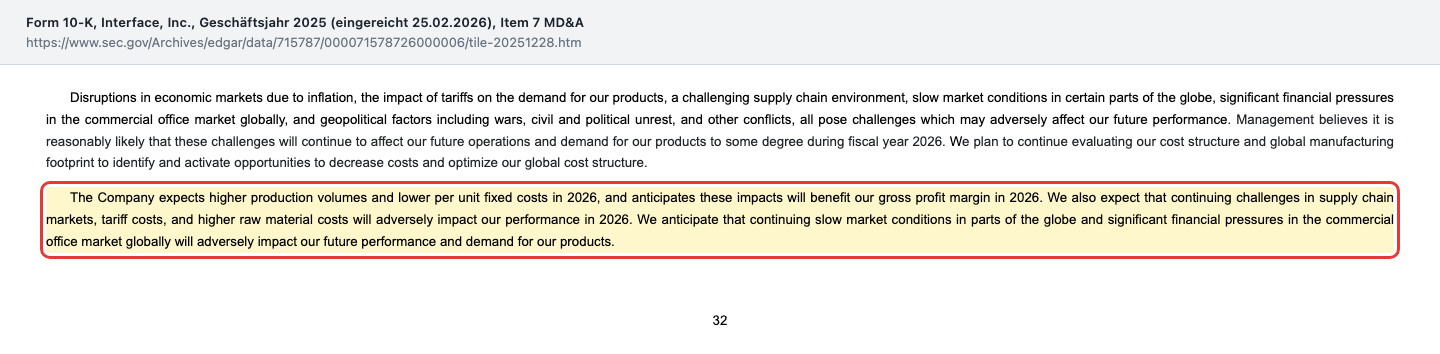
"We anticipate that continuing slow market conditions in parts of the globe and significant financial pressures in the commercial office market globally will adversely impact our future performance and demand for our products."
— Interface, Inc., Form 10-K for fiscal 2025, Item 7
The numbers of recent years back the warning. In the home segment AMS, office sales grew only 1.5 percent in 2025 and shrank 1.7 percent in 2024. Growth was carried by healthcare (2025: up 21.4 percent), government buildings (up 10.7 percent) and education (up 8.2 percent). If the office is now picking up again, it is a recovery in a market whose structural problems — remote work, falling space utilization, financing pressure on landlords — are far from solved.
Inconvenient Truth No. 5: Tariffs Hit Exactly Two Points — and a Court Just Struck Them Down
Interface manufactures a lot in-house, but not everything. That is precisely where the tariff risk comes from, and the annual report names it with unusual sharpness:
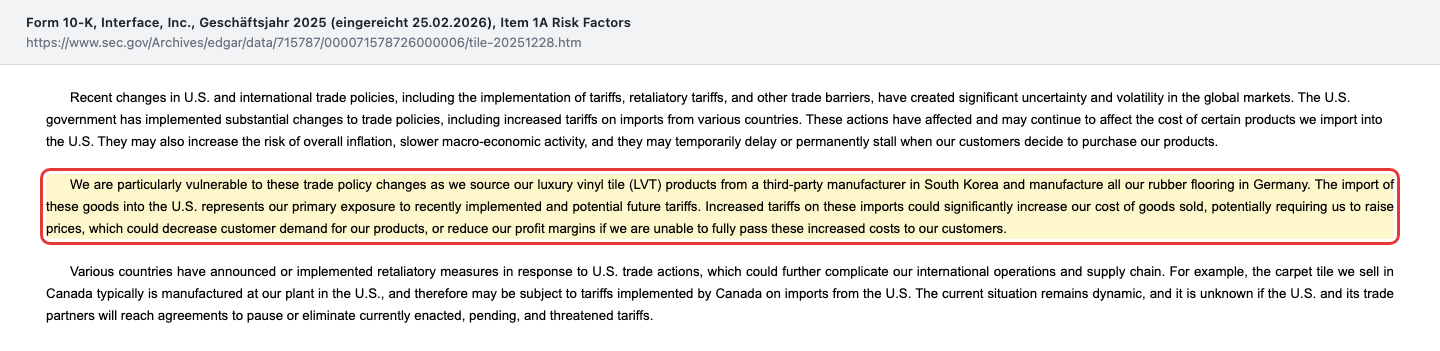
"We are particularly vulnerable to these trade policy changes as we source our luxury vinyl tile (LVT) products from a third-party manufacturer in South Korea and manufacture all our rubber flooring in Germany."
— Interface, Inc., Form 10-K for fiscal 2025, Item 1A
What it cost is in the same report: approximately $7.3 million of increased tariff costs in fiscal 2025 on rubber and luxury vinyl tile imports. For the first quarter of 2026 Interface again cites higher tariff costs as a drag on cost of sales, without quantifying them. How thoroughly a tariff bill can rearrange an income statement is something we worked through at forklift maker Hyster-Yale.
And then came February 2026. The quarterly report records that the U.S. Supreme Court invalidated tariffs imposed under the International Emergency Economic Powers Act, and that Interface considers certain tariffs it paid to be refundable:
"The Company believes certain tariffs previously paid may be refundable. The Company has not yet recognized any recovery of tariffs in its consolidated financial statements."
— Interface, Inc., Form 10-Q for the quarter ended April 5, 2026, Item 2
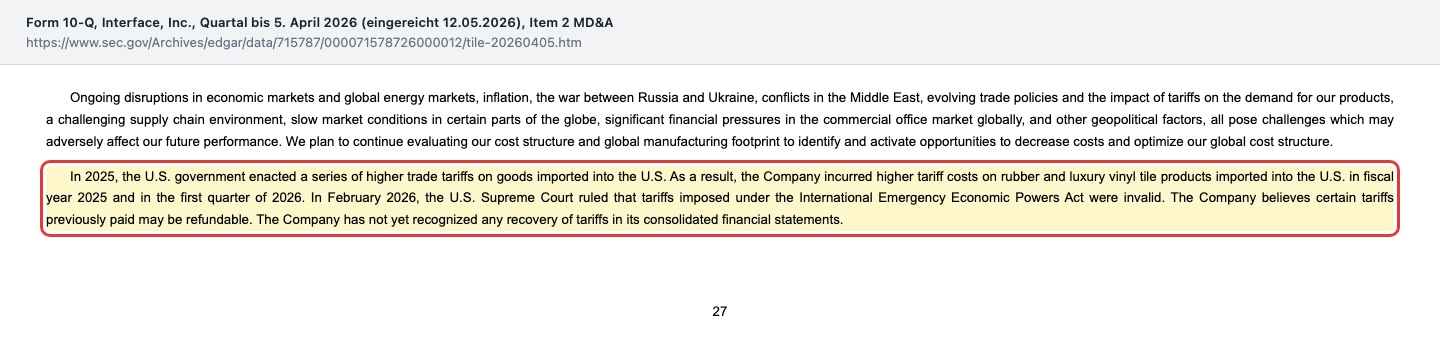
That is both an opportunity and a warning. If money comes back, it improves a quarterly result without a single additional square foot being installed. If it does not, nothing changes. Either way: anyone judging the next quarter has to look for that line.
What Went Right: The Debt
One thing Interface has genuinely cleaned up in recent years, and it gets lost in the calendar debate. Through the end of 2025 the company carried $300 million of 5.50 percent senior notes due 2028. On November 18, 2025 Interface issued a conditional notice of redemption; by December 3, 2025 the notes were retired — funded by a new $170 million term loan and cash on hand. At the same time the syndicated credit agreement was amended: the maturity moved from October 14, 2027 to December 3, 2030, the revolving facility shrank from $300 million to $250 million, and the weighted average interest rate at closing was estimated at 5.24 percent.
The effect shows up immediately in the income statement. Interest expense fell from $31.8 million (2023) through $23.2 million to $19.5 million (2025) — and in the first quarter of 2026 from $4.4 million to $2.7 million. As of April 5, 2026 the weighted average rate on drawn funds was 4.94 percent, with $226.3 million of available borrowing capacity. Interface confirms in the report that it complies with all covenants; the agreement requires a secured net leverage ratio of no more than 3.00 to 1.00 and an interest coverage ratio of at least 2.25 to 1.00. In short: financing is no longer a construction site.
What the Stock Costs — Valuation in Orders of Magnitude
First the frame, then the number. The cover page of the quarterly report shows exactly 58,056,192 shares outstanding as of May 7, 2026. Multiplied by the July 24, 2026 price of $32.98, that is a market value of roughly $1.91 billion. For context, because a daily quote says nothing about value: the only prices documented in the filings themselves come from the first-quarter 2026 repurchase table — Interface paid an average of $31.74 between February 2 and March 1 and an average of $26.04 between March 2 and April 5. Across that range the market value would be $1.51 billion to $1.84 billion.
Against results for the twelve months through April 5, 2026 — $1,420.5 million of net sales, $126.7 million of net income, $2.14 of diluted earnings per share — that means a price-to-sales ratio of roughly 1.1 to 1.35 and a price-to-earnings ratio of roughly 12 to 15. Book value per share is $10.93 (equity of $634.6 million as of April 5, 2026), putting the price-to-book ratio at 2.4 to 3.0. Adding net debt of $135.3 million gives an enterprise value of roughly $2.05 billion — about 9 times adjusted EBITDA for the last twelve months ($227.6 million).
That is neither a bargain nor an excess — it is the price of a steadily growing industrial company. The professionals' view: the fundamental data record exactly two covering analyst firms as of July 24, 2026, with an average price target of $40.50. Two opinions are a very thin foundation; with coverage that sparse, a consensus says more about the mood of two firms than about fair value. The dividend is a footnote: Interface tripled the quarterly payout from $0.01 to $0.03 per share in the first quarter of 2026 — $0.12 a year, a yield of roughly 0.4 percent.
Opportunities and Risks at a Glance
What speaks for it:
- Margins have improved for three straight years: gross margin 35.0 to 36.7 to 38.7 percent, operating margin 8.3 to 10.2 to 11.8 percent (fiscal 2023 through 2025).
- Cash from operations exceeded net income in each of those three years; free cash flow was $121.7 million most recently (2025).
- Financing is secured through December 3, 2030, net debt sits at 0.6 times adjusted EBITDA, and available borrowing capacity was $226.3 million (April 5, 2026).
- Currency-neutral orders rose 8.0 percent in the first quarter of 2026 — 11.2 percent in the international segment; that is the number the calendar does not touch.
- Interface raised its own full-year guidance: net sales of $1.450 billion to $1.480 billion instead of $1.420 billion to $1.460 billion.
- A possible tariff refund following the February 2026 ruling stands at zero on the books so far.
What speaks against it:
- The quarter that put the stock on the list ran a week longer than the comparison quarter — and the contribution of that week is quantified nowhere.
- Of 11.3 percent of sales growth, 6.8 percent remains currency-neutral; in the international segment 15.2 percent shrinks to 4.3 percent.
- The effective tax rate fell from 24.0 to 18.3 percent in the quarter — for full-year 2026 Interface itself plans on 26.0 percent, and 28.0 percent for the second quarter.
- Corporate office accounted for 44 percent of fiscal 2025 net sales and 47 percent in the first quarter of 2026 — a market whose financial pressure the company's own annual report warns about.
- Luxury vinyl tile comes from a single third-party manufacturer in South Korea and all rubber flooring from Germany — tariffs alone cost approximately $7.3 million extra in fiscal 2025.
- The company's own second-quarter 2026 guidance of $385 million to $395 million implies only 2.5 to 5.2 percent growth against $375.5 million a year earlier.
A Human Conclusion
Back to the calendar blindness from the start. At Interface it is unusually easy to cure, because the company supplies the note itself — in Note 1, in management's discussion, and in the header of the earnings release. Read only the percentages and you see an exceptional quarter. Turn one page and you see a good quarter helped by three tailwinds: a week, the euro, and the tax rate. All three are real, and all three are one-time.
This is not an indictment. Beneath those three tailwinds sits a company that lifted its gross margin by almost four points in two years, nearly halved its interest burden, and grew currency-neutral orders 8.0 percent. That is solid industrial work. Only: the price the market pays is the price for a company that keeps growing that way — and the next comparison period has 13 weeks again, a normal tax rate, and a euro that can also fall.
There is a charitable reading: orders grew faster than adjusted sales, the office business is turning positive again, and a tariff refund sits in the drawer as a free option. And there is a skeptical one: a company whose most important end market is shrinking structurally is being valued, after a quarter brightened by one-time items, at a level that tolerates little disappointment. Both readings rest on the same documents. Which one holds will be settled by a report due in early August 2026 — one that counts 13 weeks again.
What you make of it is your decision. And that is exactly as it should be.
Sources
- Interface, Inc. — Form 10-Q for the quarter ended April 5, 2026 (filed May 12, 2026), CIK 0000715787
- Interface, Inc. — Form 10-Q for the quarter ended September 28, 2025 (filed November 4, 2025)
- Interface, Inc. — Form 10-K for fiscal 2025 (filed February 25, 2026)
- Interface, Inc. — Form 10-K for fiscal 2024 (filed February 26, 2025)
- Interface, Inc. — Form 8-K earnings release dated May 8, 2026, Exhibit 99.1 (first quarter of fiscal 2026 and outlook)
- Interface, Inc. — Form 8-K dated December 3, 2025 — Items 1.01, 1.02 and 2.03: amended syndicated credit agreement, redemption of the 5.50 percent notes
- Interface, Inc. — Form 8-K dated November 18, 2025 — Item 2.04: conditional notice of redemption for the $300 million notes
- Interface, Inc. — Form 8-K dated September 9, 2024 — Item 4.01: change of auditor from BDO USA to Ernst & Young
- Source: fundamental data & SEC filings (annual and quarterly reports, 10-K/10-Q); ratios as of July 24, 2026
- Hook: rank 39 in the U.S. selection of our in-house "Big Earnings Surprise" stock scanner, as of July 25, 2026
This analysis is journalistic commentary on publicly available mandatory filings. It is not investment advice and not a solicitation to buy or sell securities. Stocks can fall to zero. All figures come from the sources named above and carry the as-of dates stated there. The author holds no position in Interface, Inc. at the time of publication.
Our Bottom Line at a Glance
- Operating performance positive
- Three years of rising net sales — $1,261.5 million, $1,315.7 million and $1,386.9 million in fiscal 2023 through 2025 — with a gross margin that climbed from 35.0 to 38.7 percent. Operating income rose from $104.5 million to $164.0 million. Currency-neutral orders grew 8.0 percent in the quarter ended April 5, 2026.
- Quality of the earnings surprise negative
- Per Note 1 of the quarterly report, the quarter ended April 5, 2026 ran 14 weeks against 13 a year earlier. Of 11.3 percent of sales growth, 6.8 percent remains currency-neutral, and the effective tax rate fell from 24.0 to 18.3 percent. Interface quantifies the contribution of the extra week nowhere.
- Balance sheet and financing positive
- On December 3, 2025 Interface redeemed $300 million of 5.50 percent notes and extended its syndicated credit facility to December 3, 2030. As of April 5, 2026, $196.7 million of debt stood against $61.2 million of cash and $634.6 million of equity; quarterly interest expense fell from $4.4 million to $2.7 million.
- Office market concentration negative
- Corporate office accounted for 44 percent of fiscal 2025 net sales and 47 percent in the quarter ended April 5, 2026. The fiscal 2025 annual report explicitly expects "significant financial pressures in the commercial office market globally" to weigh on future performance. In the home segment, office sales grew only 1.5 percent in 2025 and shrank 1.7 percent in 2024.
- Tariffs and sourcing neutral
- Luxury vinyl tile comes from a third-party manufacturer in South Korea and all rubber flooring from Germany; tariffs cost approximately $7.3 million extra in fiscal 2025. After the Supreme Court ruling of February 2026, Interface considers part of that refundable but had recognized nothing as of April 5, 2026 — opportunity and uncertainty in one.
- Valuation neutral
- A market value of roughly $1.91 billion (58,056,192 shares × $32.98, data as of July 24, 2026) equals a price-to-sales ratio of roughly 1.1 to 1.35 and a price-to-earnings ratio of roughly 12 to 15 on the twelve months through April 5, 2026. The caveat: only two analyst firms are on record, with a price target of $40.50.
Interface reported an exceptional quarter for the period ended April 5, 2026: net sales of $331.0 million (up 11.3 percent) and diluted earnings per share of $0.40 against $0.22. Three tailwinds helped, and all three are one-time: the quarter ran 14 weeks instead of 13, the euro added roughly $13.4 million, and the effective tax rate fell from 24.0 to 18.3 percent. Underneath sits a solid business — gross margin up from 35.0 to 38.7 percent in two years, interest expense down from $31.8 million to $19.5 million, net debt at 0.6 times adjusted EBITDA. The concentration risk remains the office market, whose financial pressure the company's own annual report warns about. Not investment advice.
What Our Rating Means
Open questions
The business works in principle, but one material question is open. As long as it stays open, our findings do not carry a quality verdict.
The business carries its own weight: net sales have risen for three years, the gross margin climbed from 35.0 to 38.7 percent, cash from operations exceeded net income in every one of those years, and the balance sheet as of April 5, 2026 shows an equity ratio of 52.6 percent with net debt at 0.6 times adjusted EBITDA — financing is secured through December 3, 2030 and interest expense fell from $31.8 million to $19.5 million. No customer accounts for more than 10 percent of sales, and there is no sign of a threat to the going concern. What is open is an operational question, and a weighty one: corporate office supplied 44 percent of fiscal 2025 net sales and 47 percent in the quarter ended April 5, 2026 — a market whose financial pressure the company's own annual report warns about, and where home-segment office sales grew only 1.5 percent in 2025 after shrinking 1.7 percent in 2024. On top of that, the latest standout quarter owes a meaningful share of its shine to three one-time tailwinds (14 weeks instead of 13, roughly $13.4 million from the euro, a tax rate of 18.3 instead of 24.0 percent), and Interface itself guides to only 2.5 to 5.2 percent growth for the second quarter; sourcing rests on two points as well, luxury vinyl tile from a single third-party manufacturer in South Korea and all rubber flooring made in Germany. That is not a threat to substance — but earnings power without the calendar, the euro and the tax benefit is not yet proven, hence yellow. The decision is yours.
A journalistic assessment by our editorial team at the time of the deep dive, based on public sources — not investment advice and not a solicitation to buy or sell. Your personal circumstances (investment goals, risk capacity, taxes) cannot be taken into account. What our levels mean, how verdicts are formed, and what conflicts of interest exist →
Worth Noting
- Interface came onto our research list at rank 39 in our in-house Big Earnings Surprise ranking (U.S. selection, as of July 25, 2026, relative strength rating 71 out of 100). The lists are recomputed daily — today's rank is not tomorrow's rank. The filter measures the gap between reported earnings and the analyst estimate; it does not count weeks.
- Calendar trap: Interface reports in 52- or 53-week fiscal years ending on the Sunday nearest December 31. The first quarter of 2026 ran from December 29, 2025 through April 5, 2026 and had 14 weeks; the prior-year quarter ended March 30, 2025 and had 13. Every annual and quarterly comparison with 2026 carries that difference — the extra week sits entirely in the first quarter.
- As-of note: balance sheet and income figures in this analysis come from the annual report for fiscal 2025 (as of December 28, 2025) and the quarterly report for the period ended April 5, 2026. Valuation ratios carry a data date of July 24, 2026. The only prices documented in filings come from the first-quarter 2026 repurchase table ($31.74 in February, $26.04 from March into early April) and therefore predate that data date.
- Risk of confusion: Interface, Inc. (TILE, flooring, Atlanta) has nothing to do with software companies of a similar name, nor with the ticker TILE on other venues. The two Form 15-15D filings of January 9, 2023 in the SEC record relate to retired debt securities, not to the common stock: the company has remained a reporting issuer throughout and most recently filed a quarterly report on May 12, 2026.
Frequently Asked Questions
Interface counts in weeks, not calendar months: its fiscal year ends on the Sunday nearest December 31. For 2026 that is January 3, 2027, so the year runs 53 weeks. The extra week fell into the first quarter, which ran from December 29, 2025 through April 5, 2026.
As reported, net sales rose 11.3 percent to $331.0 million in the quarter ended April 5, 2026. On a currency-neutral basis they were $317.6 million, up 6.8 percent. The difference of roughly $13.4 million came mostly from the stronger euro, according to the report.
Because the tax rate fell. Pre-tax income rose 68.9 percent to $28.9 million in the quarter ended April 5, 2026, while net income rose 81.6 percent to $23.6 million. The effective tax rate was 18.3 percent against 24.0 percent, mainly due to higher tax benefits from share-based compensation.
As of April 5, 2026, gross debt was $196.7 million against $61.2 million of cash, leaving $135.3 million of net debt. By the company's own math that is 0.6 times adjusted EBITDA for the last twelve months. The syndicated credit agreement matures on December 3, 2030.
Corporate office accounted for 44 percent of net sales in fiscal 2025, 47 percent in 2024 and 49 percent in 2023. In the quarter ended April 5, 2026 it was back to 47 percent. The fiscal 2025 annual report warns explicitly of significant financial pressures in the global commercial office market.
The U.S. Supreme Court invalidated tariffs imposed under the International Emergency Economic Powers Act. According to the quarterly report, Interface believes certain tariffs it paid may be refundable, but it had recognized no recovery as of April 5, 2026. Tariffs cost approximately $7.3 million extra in fiscal 2025 alone.
The outlook of May 8, 2026 calls for net sales of $385 million to $395 million, an adjusted gross profit margin of 39.9 percent and an adjusted effective tax rate of 28.0 percent. The prior-year quarter ended June 29, 2025 came in at $375.5 million — and like the coming one, it ran 13 weeks.
Ernst & Young LLP, beginning with fiscal 2025. The change was reported on September 9, 2024: the audit committee dismissed BDO USA after completion of the fiscal 2024 audit and appointed Ernst & Young. According to the filing there were no disagreements and no reportable events.
Found an error?
Did you spot a factual error, an outdated number, or a typo in this deep dive? Let us know briefly — your report goes straight to the editorial team.