Gold.com (GOLD): Buy What Sounds Like a Gold Mine, Get a Wholesaler on a 1.67 Percent Gross Margin
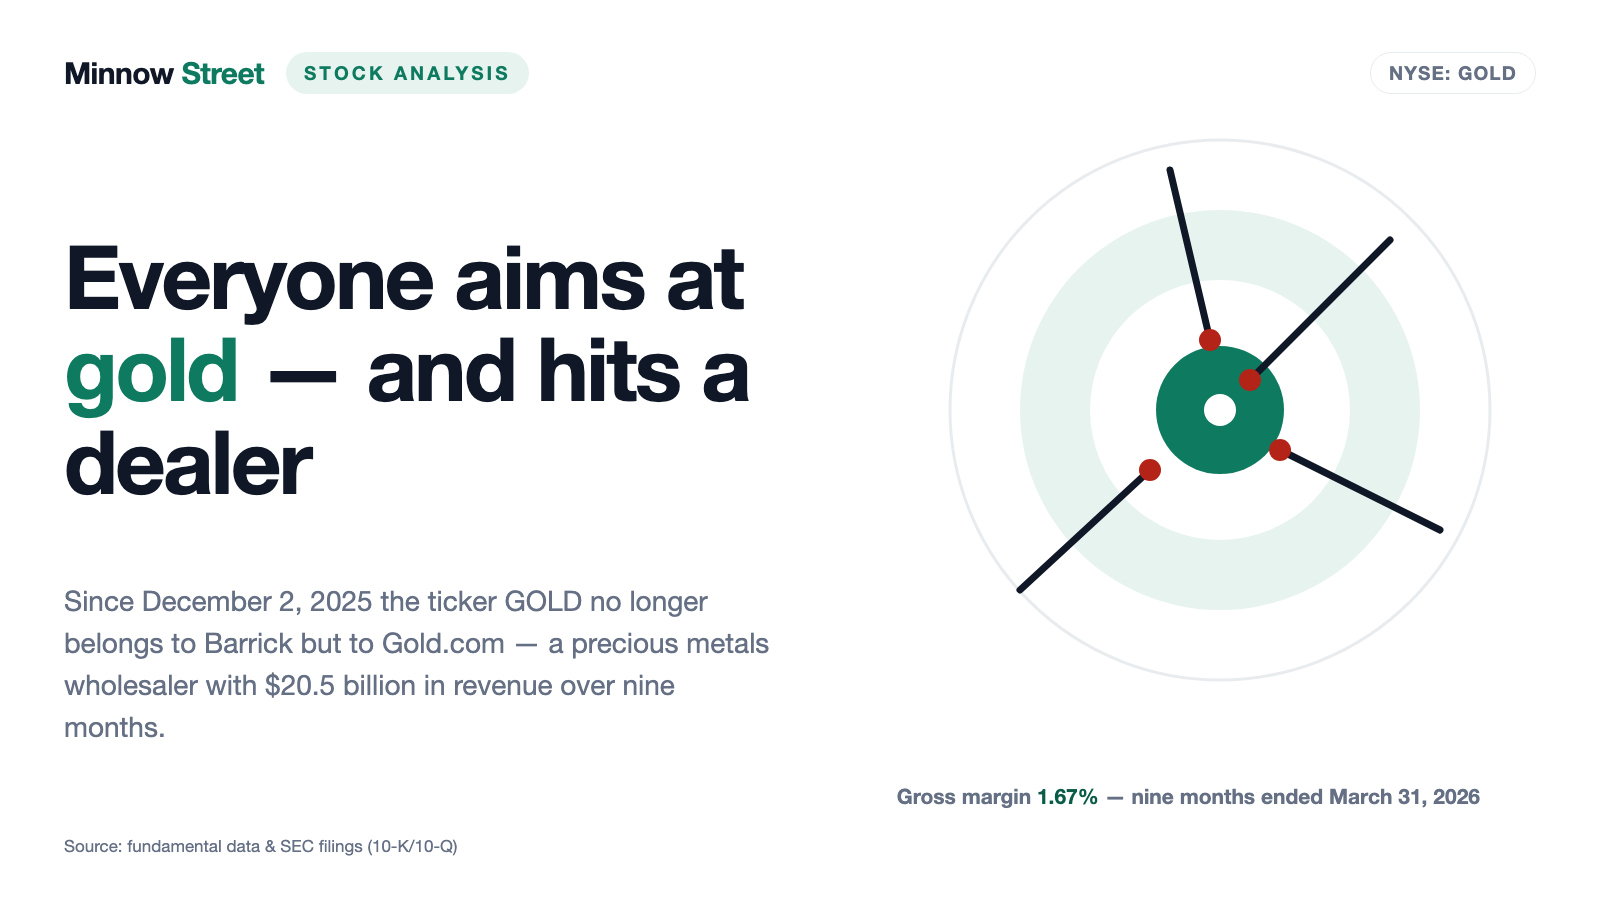
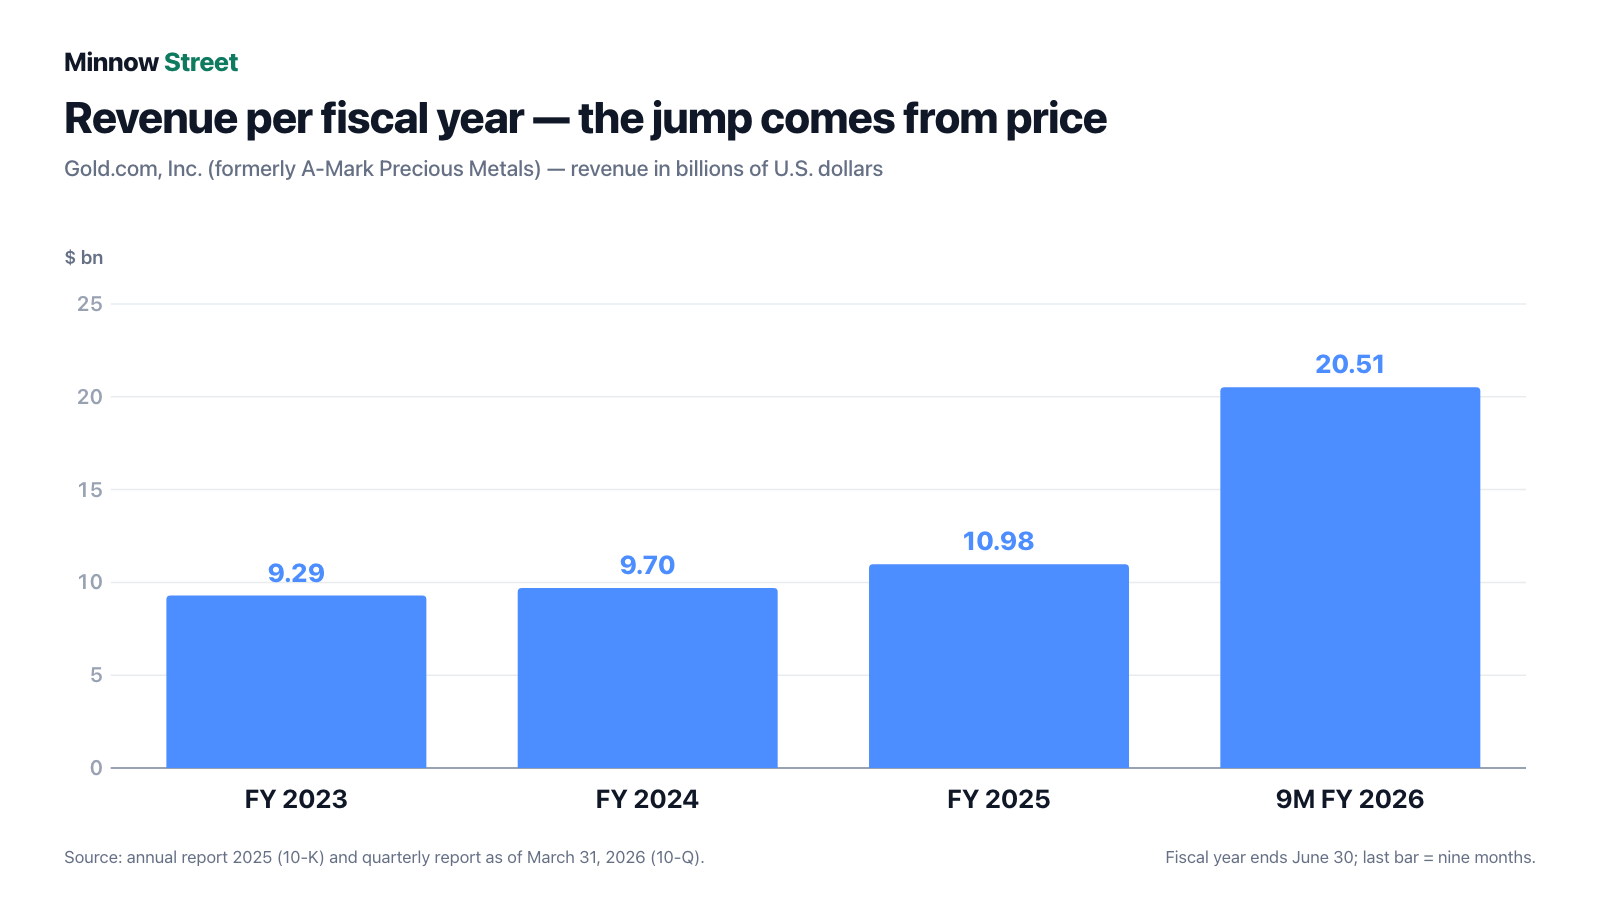
Since December 2, 2025 the ticker GOLD no longer belongs to Barrick but to Gold.com, Inc. — the precious metals wholesaler that used to be called A-Mark Precious Metals. The difference is not a label but a different business: in the nine months ended March 31, 2026 the company booked $20.5 billion in revenue and kept $342.8 million of gross profit — 1.67 percent. Gold ounces sold fell 14.1 percent over the same period; the revenue jump came from prices and forward sales. On top of that, stablecoin issuer Tether has held 11.6 percent since February 2026 — and is one of the largest counterparties at the same time. Not investment advice, just the question of what you would actually be holding.
 Thomas Mücke
Founder & Publisher
Thomas Mücke
Founder & Publisher
Chart
Interactive price chart (TradingView).
Note: pure fact-based analysis, not investment advice and not a solicitation to buy or sell. All figures without guarantee.
There is an investor weakness so ordinary it never earned a clever name — call it the ticker trap. It works like this: you want gold in your portfolio, you type "GOLD" into the order box, and the security that comes up is indeed called that. Your brain ticks the box: target hit. Except the ticker has been pointing somewhere else since December 2, 2025. On that day Gold.com, Inc. — until then A-Mark Precious Metals, Inc. (Nasdaq: AMRK) — changed its name and moved its listing from Nasdaq to the New York Stock Exchange. The ticker had come free because Barrick Gold Corporation renamed itself Barrick Mining Corporation on April 29, 2025 and has traded on the NYSE under the single letter "B" ever since. So buying GOLD today does not buy a gold mine; it buys a precious metals wholesaler. Let us make a deal: we read together what this company actually earns — in the quarterly report (10-Q) for the period ended March 31, 2026, the annual report (10-K) for fiscal 2025 and the resale prospectus of May 15, 2026. Because remember: a ticker is an address, not a description.

What Gold.com actually does — the warehouse behind the coin shop
Gold.com is not a miner but a precious metals middleman — in everyday terms: the cash-and-carry warehouse of the gold trade. The company digs nothing out of the ground; it buys, stores, packs, finances and resells. Headquarters are in Costa Mesa, California, and as of June 30, 2025 it employed 993 people (941 in North America, 50 in Asia, 2 in Europe). The chief executive is Gregory Roberts. The business rests on three legs.
First, wholesale ("Wholesale Sales & Ancillary Services"): bars, plates, grain and coins in gold, silver, platinum and palladium go to banks, sovereign mints, refiners, industrial customers and coin dealers, alongside services such as receiving, testing, storage and shipping, plus an in-house silver minting operation. This segment produced $7,792.0 million of revenue in the quarter ended March 31, 2026.
Second, direct-to-consumer: through a whole family of web shops and brands the company sells straight to retail investors and collectors. As of March 31, 2026 it counted 4,654,400 total customers, of whom 246,000 were active during the quarter, at an average order value of $5,618. Segment revenue for the quarter: $2,558.7 million.
Third, secured lending: a subsidiary lends against collateral — bullion, numismatic coins, even graded sports cards, all held in the company's own vaults. It is a small business: 337 loans outstanding as of March 31, 2026 (491 a year earlier) and $3.2 million of interest income for the quarter.
Recent growth has come largely from acquisitions: Spectrum Group International and Pinehurst in February 2025, AMS in April 2025, precious metals dealer Monex on January 2, 2026 for $49.9 million ($19.0 million in cash plus 560,000 of the company's own shares) and, on April 1, 2026, the remaining stake in minting operation Sunshine Minting for about $22.0 million. One point matters for every number in this analysis: the fiscal year ends June 30. Fiscal 2026 therefore ends on June 30, 2026, and "nine months ended March 31, 2026" means July 2025 through March 2026.
Which brings us to the central tension of this analysis, running through every chapter: the revenue looks like a conglomerate, the earnings look like a mid-cap — and the two move for different reasons.
How the stock landed on our desk
Honestly: not through a scanner. As of July 27, 2026, GOLD appears in none of our scanner lists — neither momentum nor quality nor value; those lists are recalculated daily, so the finding can change. The ticker surfaced during routine maintenance of our U.S. universe: the company name on file no longer matched what the ticker had meant for decades. Checking it against the register of the U.S. securities regulator, the SEC, produced the explanation — company number (CIK) 0001591588, former name "A-Mark Precious Metals, Inc." until December 1, 2025, industry code: wholesale jewelry, watches, precious stones and metals. The Nasdaq listing was given up voluntarily; the corresponding Form 25 is dated December 1, 2025.
This confusion is not a curiosity but an investment risk. To see the difference between a producer and a dealer, hold this analysis next to our work on actual gold miners — Allied Gold, which runs mines and whose earnings hinge on the cost per ounce produced, or TRX Gold, whose numbers depend on the ore grade of a single project. Both gain when the gold price rises, because their cost per ounce is largely fixed. A dealer is different: it earns the spread, not the price. When gold rises, its revenue rises almost automatically — its profit only if it can hold the spread between buying and selling.
The numbers over the years — credit where credit is due
First, what genuinely impresses. In the nine months ended March 31, 2026 Gold.com booked $20,508.4 million of revenue, up from $8,466.6 million a year earlier. Gross profit rose from $129.2 million to $342.8 million and net income attributable to the company from $7.0 million to $70.2 million. Diluted earnings per share jumped from $0.29 to $2.65. In the quarter ended March 31, 2026 alone the company earned $59.5 million, against a loss of $8.5 million in the same quarter a year earlier. Operating cash flow over the nine months came to $153.0 million (prior-year period: $85.4 million).
The direct-to-consumer arm delivers as well: its gross profit rose 368.1 percent to $117.8 million in the quarter ended March 31, 2026, at a segment gross margin of 4.603 percent — more than six times the wholesale margin. And the company has paid a quarterly dividend of $0.20 per share ($0.80 a year) since October 2022; the most recent one was declared on May 6, 2026 and paid on June 1, 2026. Financing is in good shape too: of the $427.5 million credit facility (maturing September 30, 2027) only $98.0 million was drawn as of March 31, 2026, leaving $329.5 million available, and all covenants were met. This is not a company on the edge. This is a dealer having a good year.
Now let us look at where that good year comes from.
Uncomfortable truth no. 1: revenue rose, volume fell
Anyone reading growth into the revenue jump is reading it wrong. The 10-Q for the period ended March 31, 2026 states the volumes explicitly — and they point the other way.
"Gold ounces sold for the nine months ended March 31, 2026 decreased 129,000 ounces, or 14.1%, to 787,000 ounces from 916,000 ounces in 2025. Silver ounces sold for the nine months ended March 31, 2026 decreased 10,589,000 ounces, or 23.4%, to 34,712,000 ounces from 45,301,000 ounces in 2025. On average, selling prices for gold increased by 53.8% and selling prices for silver increased by 103.9%."
— Gold.com, Inc., SEC quarterly report 10-Q for the period ended March 31, 2026, MD&A, wholesale segment

The company says as much itself, without hedging. The annual report for fiscal 2025 contains the sentence that carries this entire analysis:
"The Company operates in a high volume/low margin industry. Revenues are impacted by three primary factors: product volume, market prices, and market volatility. […] A significant increase or decrease in revenues can occur simply based on changes in the underlying commodity prices and may not be reflective of an increase or decrease in the volume of products sold."
— A-Mark Precious Metals, Inc., SEC annual report 10-K for fiscal 2025, MD&A
A second effect comes on top, and it is bigger than price. A substantial share of revenue comes from forward sales the company enters into to hedge — it sells metal forward to protect its own inventory against price swings. Those trades run through the books as revenue but carry essentially no profit.

Do the math: of the $5.357 billion increase in wholesale revenue, $4.371 billion came from forward sales — 82 percent. The filing states that forward sales "increase revenues but are associated with negligible gross profit." And you can see it in the margin: the wholesale segment's gross margin for the quarter was 0.755 percent — excluding forward sales, 2.933 percent. Over nine months: 0.657 percent including, 2.282 percent excluding. Rule of thumb: in this business model revenue is not a measure of size, it is a side effect.
Uncomfortable truth no. 2: every $100 of revenue leaves $1.67
If revenue says nothing about size, the margin has to. And at a precious metals wholesaler the margin is inherently thin — only thinner than most expect, and with a swing that hurts.
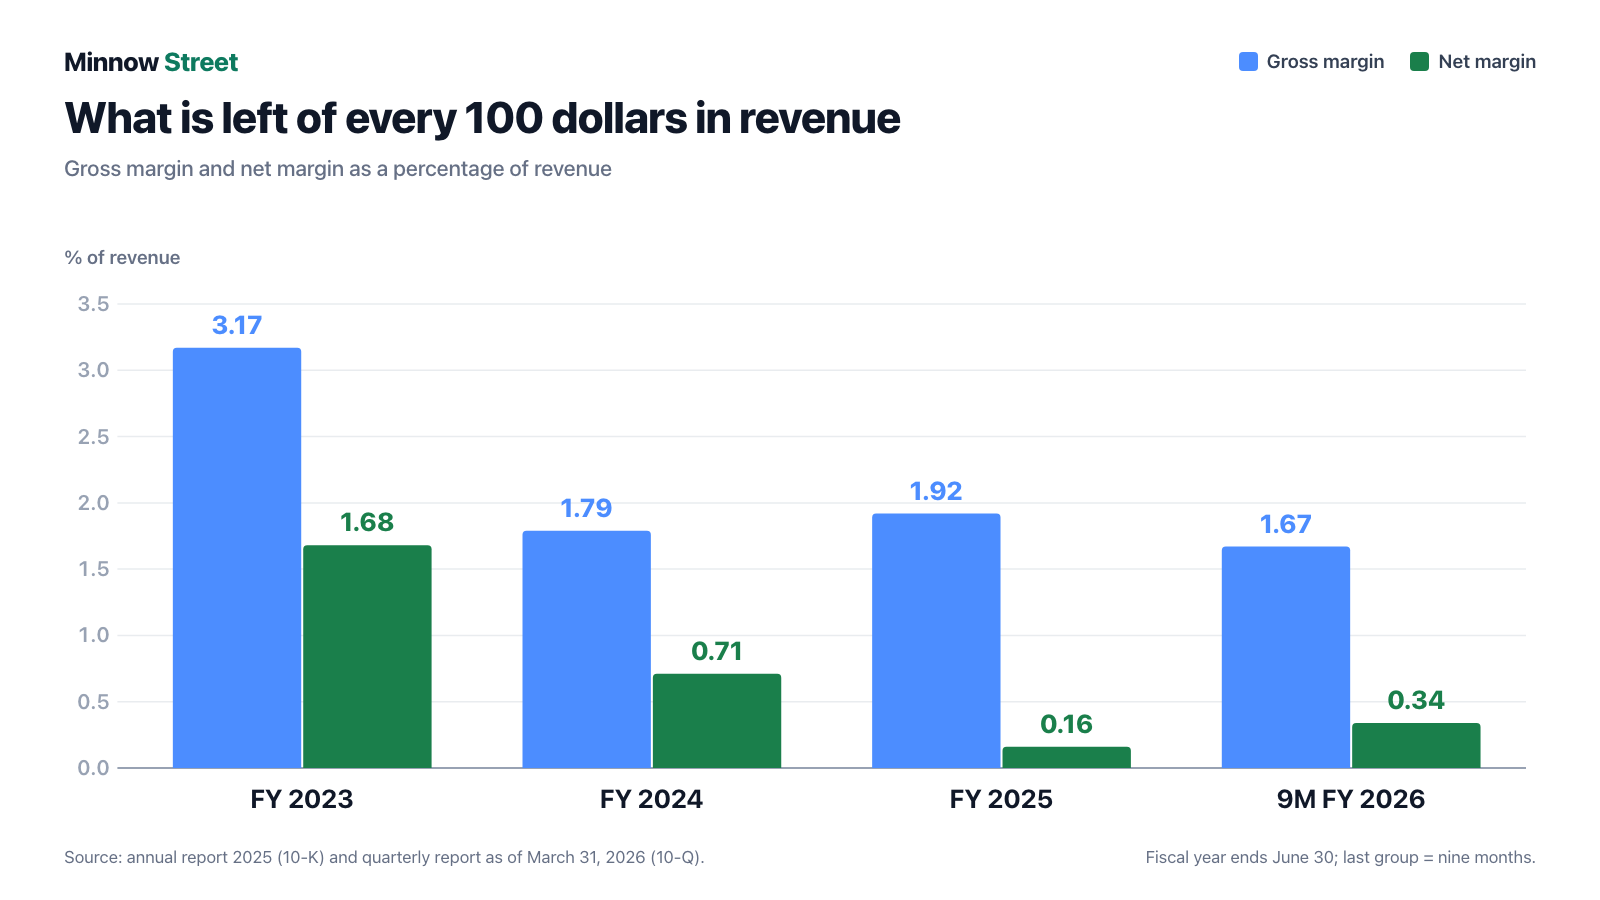
In numbers: in fiscal 2023, $9,286.6 million of revenue still left $294.7 million of gross profit (3.17 percent) and $156.4 million of net income. In fiscal 2025, $10,978.6 million of revenue left only $210.9 million of gross profit (1.92 percent) and $17.3 million of net income — 0.158 percent of revenue, or 71 cents per share. This is where investors miscount: revenue rose 18 percent between fiscal 2023 and fiscal 2025 while profit fell 89 percent.
The cost block shows why the margin is so sensitive. In the nine months ended March 31, 2026, $342.8 million of gross profit faced $197.6 million of selling, general and administrative expenses, $24.6 million of depreciation and amortization and $47.9 million of interest expense. Interest alone eats 14 percent of gross profit — that is the bill for a dealer having to finance its inventory. A year earlier it was $33.3 million. Rising metal prices do not just inflate revenue; they also make the warehouse more expensive.
Uncomfortable truth no. 3: a fifth of the balance sheet belongs to customers
Between June 30, 2025 and March 31, 2026 total assets grew from $2,215.4 million to $4,174.1 million — close to a doubling. Inventories rose from $1,279.5 million to $2,766.6 million. If that reads like a buying spree, the footnote has been missed.
On the liability side, liabilities on borrowed metals rose from $46.1 million to $916.7 million. Of that, the notes attribute $837.4 million to precious metal held in third-party storage "for the benefit of the customer": the customer has paid, legal title has not yet passed, so the metal sits in the company's inventories and is simultaneously carried as a liability. A fifth of total assets is therefore a pass-through item. Of the $2,766.6 million of inventories as of March 31, 2026, $1,447.1 million was tied up in this form ("restricted inventories").
This is accounting-correct and industry-standard — but it makes any ratio pulled mechanically from the balance sheet useless. A debt-to-equity ratio of 1.37 (as of July 27, 2026) sounds like a lot; a large part of it is metal the company merely stores. Conversely, the equity ratio of 29.3 percent (same date) looks weaker than the business is. Rule of thumb: with a warehouse operator, first ask who owns the warehouse.
Uncomfortable truth no. 4: the largest new shareholder is also the largest new customer
On February 4, 2026 Gold.com signed an agreement with TPM, S.A. de C.V., a subsidiary of the Tether group — the issuer of the world's largest dollar stablecoin. Tether bought 3,370,787 shares at $44.50 each, $150 million in total, settled in two tranches on February 9 and May 5, 2026. The price was 11.9 percent below the 10-day average price on February 4, 2026. After $8.8 million of transaction costs the company netted $117.6 million.

So far, a normal equity raise. What followed is the interesting part. First, $20 million of the proceeds went straight into XAU₮ — a gold-backed stablecoin issued by a Tether affiliate. Money flowed back to the buyer. Second, since March 16, 2026 a Tether nominee sits on the board: Juan Jose Sartori, head of special projects at a Tether entity; the right to at least one seat holds as long as Tether owns at least 5 percent. Third, three operating agreements followed within seven weeks: a master agreement for precious metal leases (February 25, 2026), a trading agreement (March 3, 2026) and a storage agreement (March 24, 2026), under which a Tether affiliate stores gold and silver at the company's facilities in Las Vegas.
The result shows up on the balance sheet as of March 31, 2026: $362.6 million of precious metal leases and customer advances from Tether — nine months earlier, zero. That equals 42.8 percent of the $847.3 million of equity. And since May 15, 2026 the 3,370,787 shares (11.6 percent of the 29,004,374 shares outstanding as of May 5, 2026) have been registered for resale; the 90-day lock-up expired on May 7, 2026.
That concentration is not a one-off but the shape of the business. In fiscal 2025 already, a single customer accounted for 18.6 percent of revenue: HSBC Bank, at $2,043.1 million (fiscal 2024: 21.8 percent; fiscal 2023: 12.8 percent). The annual report frames it itself — the largest customers are mostly counterparties in forward contract activity entered into for hedging rather than physical trading. And on the receivables side, 20.1 percent was owed by Deutsche Bank AG as of June 30, 2025. A wholesaler has few, large counterparties; that is normal. It also means that if one drops out, it is not a rounding error.
What the stock costs — valuation with care
Here is the first figure that misleads everyone: the price-to-sales ratio sits at roughly 0.05 (as of July 27, 2026). At any normal company that would set off a bargain alarm. Here it is meaningless — because revenue is goods flowing through, not value added. A wholesaler that buys a bar for 99 and sells it for 100 books 100 of revenue and earns 1. Its price-to-sales ratio has to be tiny. Applying that yardstick to GOLD compares a warehouse to a software company.
Earnings and book value are more useful. On trailing twelve-month earnings the price-to-earnings ratio is about 12.8, and about 11.3 on the analyst estimate for the current fiscal year (as of July 27, 2026). Book value per share stood at $29.76 as of March 31, 2026 ($847.3 million of equity over 28,474,034 shares), putting the price-to-book ratio at roughly 1.35. Enterprise value (market capitalization plus net financial debt) is about $1.71 billion, roughly 8.4 times operating earnings before depreciation and amortization. The dividend yield is a little above 2 percent, on a payout ratio of about 16 percent.
Two anchor prices sit in the filings themselves and do not age: Tether paid $44.50 per share in February 2026 — an 11.9 percent discount to the then-current average price, so willingly below market. And the resale prospectus reports an NYSE closing price of $40.56 on May 14, 2026. The analyst consensus target price stood at $65.80 as of July 27, 2026 — that is the professionals' view, but it is also just an opinion, and price targets on thinly covered stocks are rarely well argued.
The decisive valuation question is not "cheap or expensive" but: how much of fiscal 2026's earnings is repeatable? Nine months produced $2.65 per share, after $0.71 for all of fiscal 2025. Extrapolating that nine-month figure assumes precious metal prices keep moving the way they recently have and that trading spreads stay wide. The filing itself names the earnings driver as "wider premium spreads" — premiums that shrink again in calmer markets.
Opportunities and risks at a glance
What speaks for Gold.com:
- A real, long-established business with scale: 993 employees (June 30, 2025), three segments, 4,654,400 retail customers (March 31, 2026) and a market position that is hard to route around in this industry.
- Direct-to-consumer is the margin business: a 4.603 percent gross margin in the quarter ended March 31, 2026 against 0.755 percent in wholesale — every acquisition in that segment (Monex, AMS, Spectrum) lifts the group mix.
- Financing is sound: a $427.5 million credit facility to September 30, 2027, of which only $98.0 million was drawn as of March 31, 2026, leaving $329.5 million available, with all covenants met; operating cash flow of $153.0 million over nine months.
- A dividend with a record: $0.20 per quarter since October 2022, uninterrupted, at a payout ratio of about 16 percent (as of July 27, 2026).
- Fresh capital without debt: $117.6 million net from the Tether investment — equity, not interest expense.
What speaks against it:
- The margin is the entire margin for error: 1.67 percent gross and 0.34 percent net (nine months ended March 31, 2026) leave no room for mistakes. In fiscal 2025, $10.98 billion of revenue left $17.3 million.
- Earnings hang on volatility, not growth: gold ounces sold fell 14.1 percent over nine months. If markets calm down, premiums shrink — and profit with them.
- Concentration on both sides: one customer accounted for 18.6 percent of fiscal 2025 revenue; one shareholder had $362.6 million of metal leases and advances with the company as of March 31, 2026.
- Potential selling pressure: 3,370,787 shares (11.6 percent) have been registered for resale since May 15, 2026, with the lock-up expired on May 7, 2026.
- Interest takes its cut: $47.9 million of interest expense over nine months against $33.3 million a year earlier — rising metal prices make the warehouse more expensive, not cheaper.
- The confusion is itself a risk: anyone buying the stock as a gold price proxy is holding something else entirely.
A conclusion for humans, not for models
Back to the ticker trap. It is not stupid — it is convenient. Four letters, one click, the feeling of having done the right thing. And in this case the outcome is not even bad: Gold.com is a real company with 993 employees, three business lines, years of dividends and very decent numbers in the current fiscal year. It is simply something entirely different from what the ticker suggests.
A gold producer earns more when the gold price rises, because its cost per ounce is fixed. A dealer earns more when the market is nervous — because that is when the spread between buying and selling widens. Those are two different bets. The first is a bet on price, the second a bet on anxiety. Anyone putting GOLD in a portfolio out of fear of inflation has quietly taken the second one.
And then there is Tether. A stablecoin group buys 11.6 percent of a precious metals dealer, takes a board seat, signs three operating agreements within seven weeks, gets $20 million of its own purchase price back in the form of its own gold-backed token — and parks $362.6 million of metal and advances with the company. That can be an excellent partnership: reliable volume, predictable storage revenue, a foothold in a growing market. It can also mean that the prettiest number in the latest report rests on a single relationship. Both readings sit in the same filings; which one holds will show in the annual report for the fiscal year ending June 30, 2026.
What you make of that is your decision. And that is exactly as it should be.
Sources
- Gold.com, Inc. — SEC quarterly report (10-Q) for the period ended March 31, 2026 (filed May 11, 2026): balance sheet, statements of income and cash flows, Note 1 (name change), Note 6 (inventories), Note 14 (related parties), Note 15 (financing agreements), MD&A (segments, volumes, forward sales, liquidity)
- A-Mark Precious Metals, Inc. — SEC annual report (10-K) for fiscal 2025 ended June 30, 2025 (filed September 11, 2025): business description, headcount, risk factors, dividend policy, Note 18 (customer and supplier concentrations), Note 19 (segments)
- Gold.com, Inc. — SEC resale prospectus (Form S-3ASR) of May 15, 2026: Tether investment, purchase price, investor rights agreement, leasing, trading and storage agreements, share count as of May 5, 2026, NYSE closing price of May 14, 2026
- Form 25 of December 1, 2025: voluntary withdrawal from Nasdaq
- SEC quarterly report (10-Q) for the period ended December 31, 2025 and for the period ended September 30, 2025
- Source: fundamental data & SEC filings (annual and quarterly reports, 10-K/10-Q) — valuation figures as of July 27, 2026
This analysis is editorial commentary and expressly not investment advice, not a buy or sell recommendation and not a solicitation to buy or sell securities. Stocks can suffer substantial losses, up to and including the total loss of the capital invested. All figures come from the primary sources linked above and carry the reporting date stated with them; they can change with every new filing. The author holds no position in Gold.com, Inc. at the time of publication. Please make every investment decision yourself and seek independent advice if in doubt.
Our Bottom Line at a Glance
- Current-year earnings positive
- In the nine months ended March 31, 2026 net income attributable to the company rose from $7.0 million to $70.2 million and diluted earnings per share from $0.29 to $2.65; operating cash flow came to $153.0 million (prior-year period $85.4 million). The quarter ended March 31, 2026 produced $59.5 million of profit after an $8.5 million loss in the same quarter a year earlier.
- Quality of revenue growth negative
- The revenue jump is mostly price and hedging, not volume: gold ounces sold fell 14.1 percent over nine months to 787,000 and silver ounces fell 23.4 percent. Of the $5.357 billion increase in wholesale revenue in the quarter ended March 31, 2026, $4.371 billion came from forward sales that the filing describes as carrying negligible gross profit.
- Margin and margin for error negative
- Gross margin was 1.67 percent in the nine months ended March 31, 2026, 1.92 percent in fiscal 2025 and still 3.17 percent in fiscal 2023. In fiscal 2025, $10,978.6 million of revenue left just $17.3 million of net income — 0.158 percent. Interest expense of $47.9 million over nine months consumes 14 percent of gross profit.
- Concentration and entanglement negative
- One customer accounted for 18.6 percent of fiscal 2025 revenue (HSBC Bank, $2,043.1 million); Deutsche Bank AG accounted for 20.1 percent of receivables as of June 30, 2025. New shareholder Tether (11.6 percent, board seat since March 16, 2026) simultaneously had $362.6 million of metal leases and advances with the company as of March 31, 2026 — 42.8 percent of equity.
- Balance sheet and financing neutral
- The $427.5 million credit facility (maturing September 30, 2027) was drawn by only $98.0 million as of March 31, 2026, leaving $329.5 million available with all covenants met. Total assets doubled in nine months to $4,174.1 million — but $837.4 million of that is metal held for customers that does not economically belong to the company.
- Risk of confusion negative
- The ticker GOLD has belonged to a dealer since December 2, 2025, not to Barrick (today Barrick Mining Corporation, NYSE: B, since April 29, 2025). Anyone buying the stock as a substitute for gold price exposure actually holds a trading business whose earnings hinge on spreads and market nervousness, not on the gold price itself.
Gold.com, Inc. is the ticker trap in its purest form: four letters that sound like a gold mine have belonged since December 2, 2025 to a precious metals wholesaler that booked $20,508.4 million of revenue in nine months and kept $342.8 million of gross profit — 1.67 percent. Gold ounces sold fell 14.1 percent over the same period; the revenue jump came from prices and from hedging forward sales that the filing says carry almost no profit. The business is real, financing is sound and the dividend has run since October 2022 — but earnings hang on trading spreads, on one customer worth 18.6 percent of revenue and, newly, on a shareholder that also has $362.6 million of metal and advances inside the company. Not investment advice.
Worth Noting
- GOLD did not reach our research list through a scanner — as of July 27, 2026 the stock appeared in none of our scanner lists, which are recalculated daily. The ticker surfaced during an identity check of our U.S. universe: the company name on file no longer matched what the ticker had stood for over decades.
- Risk of confusion: Barrick Gold Corporation has been named Barrick Mining Corporation since April 29, 2025 and trades on the NYSE under "B" (a Canadian foreign private issuer reporting on 40-F/6-K). Gold.com, Inc. is a U.S. domestic filer reporting on 10-K/10-Q with a fiscal year ending June 30.
- All operating figures come from the primary SEC filings with the reporting dates stated; valuation figures carry a data date of July 27, 2026. Analyses are evergreen — daily prices are not an investment case, and the two prices documented in the filings ($44.50 for the Tether investment in February 2026 and the $40.56 NYSE close on May 14, 2026) serve only as dated anchors.
Frequently Asked Questions
No. Barrick Gold Corporation renamed itself Barrick Mining Corporation on April 29, 2025 and has traded on the New York Stock Exchange under the ticker "B" ever since. The freed-up ticker GOLD was taken over on December 2, 2025 by Gold.com, Inc. — until then A-Mark Precious Metals, Inc. (Nasdaq: AMRK). Buying GOLD today therefore buys a precious metals wholesaler, not a gold producer.
Gold.com, Inc. of Costa Mesa, California trades precious metals through three segments: wholesale sales of bars, coins and grain together with storage and shipping services; direct-to-consumer sales to retail investors through its own web shops (4,654,400 customers as of March 31, 2026); and secured lending against collateral in bullion, numismatic coins and graded sports cards (337 loans outstanding as of March 31, 2026). The company employed 993 people as of June 30, 2025.
Because revenue is goods flowing through, not value added. A dealer books the full sale price of the metal as revenue and earns only the spread. In the nine months ended March 31, 2026, $20,508.4 million of revenue produced just $342.8 million of gross profit — 1.67 percent. After operating costs, depreciation and $47.9 million of interest expense, $70.2 million of net income was left, or 0.34 percent of revenue.
On June 30. Fiscal 2025 ran from July 1, 2024 to June 30, 2025, and fiscal 2026 ends on June 30, 2026. The most recent quarterly report (10-Q), filed May 11, 2026, therefore covers the third quarter of fiscal 2026 — the months of January through March 2026 — plus the nine months from July 2025 through March 2026. Comparing these figures with calendar years puts you half a year out.
For two reasons. First, average selling prices in the nine months ended March 31, 2026 rose 53.8 percent for gold and 103.9 percent for silver, while volumes fell 14.1 and 23.4 percent respectively. Second, hedging forward sales run through the books as revenue: in the quarter ended March 31, 2026 alone, $4.371 billion of the $5.357 billion increase in wholesale revenue came from such trades — with negligible gross profit.
Tether subsidiary TPM, S.A. de C.V. bought a total of 3,370,787 shares at $44.50 on February 4, 2026 ($150 million, an 11.9 percent discount to the 10-day average price), giving it 11.6 percent. It has nominated a board member since March 16, 2026. As of March 31, 2026 the company held $362.6 million of Tether metal leases and customer advances. The shares have been registered for resale since May 15, 2026.
The price-to-sales ratio of about 0.05 (as of July 27, 2026) is misleading, because for a dealer revenue is goods flowing through. More meaningful are a price-to-earnings ratio of about 12.8 and a price-to-book ratio of about 1.35 on book value of $29.76 per share as of March 31, 2026. What matters is how much of fiscal 2026 earnings is repeatable: $2.65 per share in nine months, after $0.71 for all of fiscal 2025.
Yes. Since October 2022 the company has paid a regular quarterly dividend of $0.20 per share, or $0.80 a year. The most recently declared payment dates from May 6, 2026 and was paid on June 1, 2026. The payout ratio stood at about 16 percent of earnings as of July 27, 2026. The board decides each quarter anew and explicitly ties the payment to its bank covenants as well.
Found an error?
Did you spot a factual error, an outdated number, or a typo in this deep dive? Let us know briefly — your report goes straight to the editorial team.