Friedman Industries Stock: Revenue Doubled — Measured From the Loss-Making Bottom of a Steel Cycle
Our scanner reports triple-digit revenue growth, but at the small steel processor Friedman Industries that is the upswing of a price cycle — measured, of all places, from a loss-making low — plus an acquisition. We read the annual report (10-K): a profit that hangs almost entirely on the steel price spread, a prior year that stayed in the black only thanks to futures contracts, and a cheap price-to-earnings ratio sitting right at peak earnings. Not investment advice — just an honest look at what a cheap price-to-earnings ratio is really worth at the top of a steel cycle.
 Thomas Mücke
Founder & Publisher
Thomas Mücke
Founder & Publisher
Chart
Interactive price chart (TradingView).
Note: pure fact-based analysis, not investment advice and not a solicitation to buy or sell. All figures without guarantee.
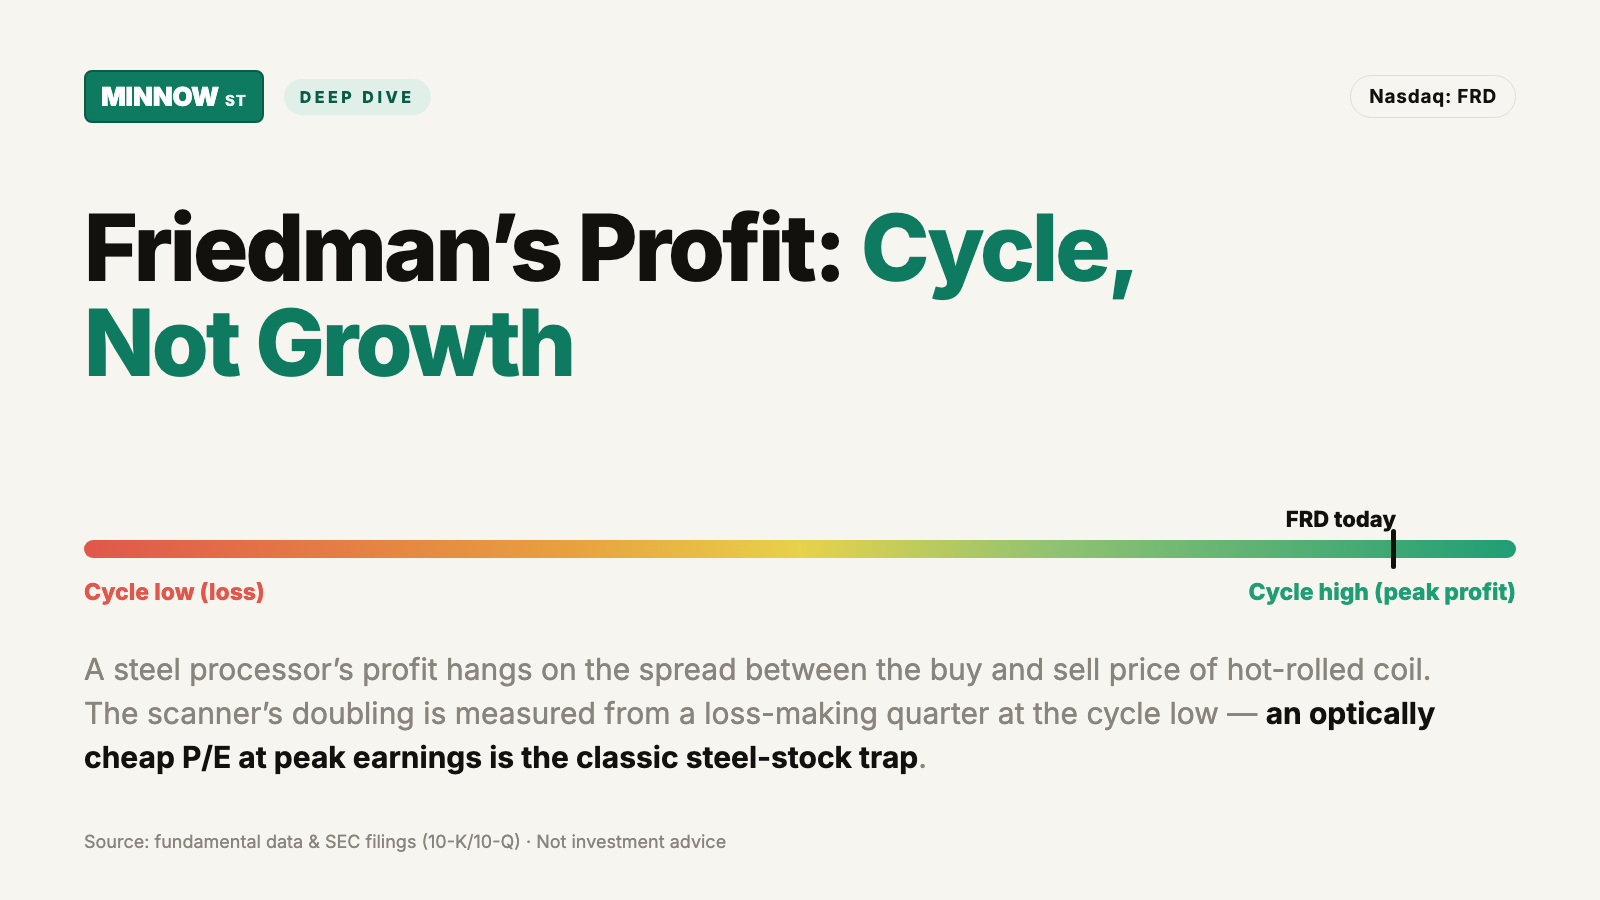
There is one metric that draws investors in like a magnet: a low price-to-earnings ratio. When a stock costs only twelve times its annual profit and revenue has just doubled, a bell rings in your head: "cheap and growing — got to have it." Exactly this reflex — call it the cheap-P/E trap — is especially expensive with cyclicals, because it skips one simple question: is this profit at the start of an upswing or at the peak? At a steel company, a low price-to-earnings ratio is often not a buy signal but a warning sign — it shows up precisely when profit has reached its cyclical high and is about to fall. So let's make a deal: before you touch a single share of Friedman Industries (Nasdaq: FRD), we read together what the company reported to the U.S. securities regulator, the SEC. A filing to the SEC is honest under penalty of law. In the end, you decide for yourself.
What Friedman actually does
Friedman Industries is a small steel middleman and processor from Texas. Think of the business as a sawmill for steel: Friedman buys large hot-rolled steel coils ("hot-rolled coil" in the trade) from a handful of big steel mills, levels and cuts them into sheet and plate, and welds part of the volume into pipe for oil, gas and construction applications. It sells to steel distributors and downstream processors. The decisive point: Friedman does not earn money on the steel itself, but on the spread between what it pays for a coil and what it gets for the cut-to-size products. And that spread swings wildly up and down with the steel price. The annual report describes the core business soberly:
"Friedman Industries, Incorporated is a manufacturer and processor of metals and operates in two reportable segments: flat-roll products and tubular products."
— Friedman Industries, Inc., SEC annual report 10-K for fiscal year 2026, Exhibit 13.1
Because profit hangs so tightly on the steel price, Friedman additionally hedges with futures contracts — whose gains and losses land directly in the income statement. Remember these two levers: the steel price cycle and the futures contracts. They explain almost everything that follows. One calendar quirk belongs right here: Friedman's fiscal year ends March 31 — so "fiscal year 2026" means April 2025 through March 2026.
Where the stock shows up in our scanner
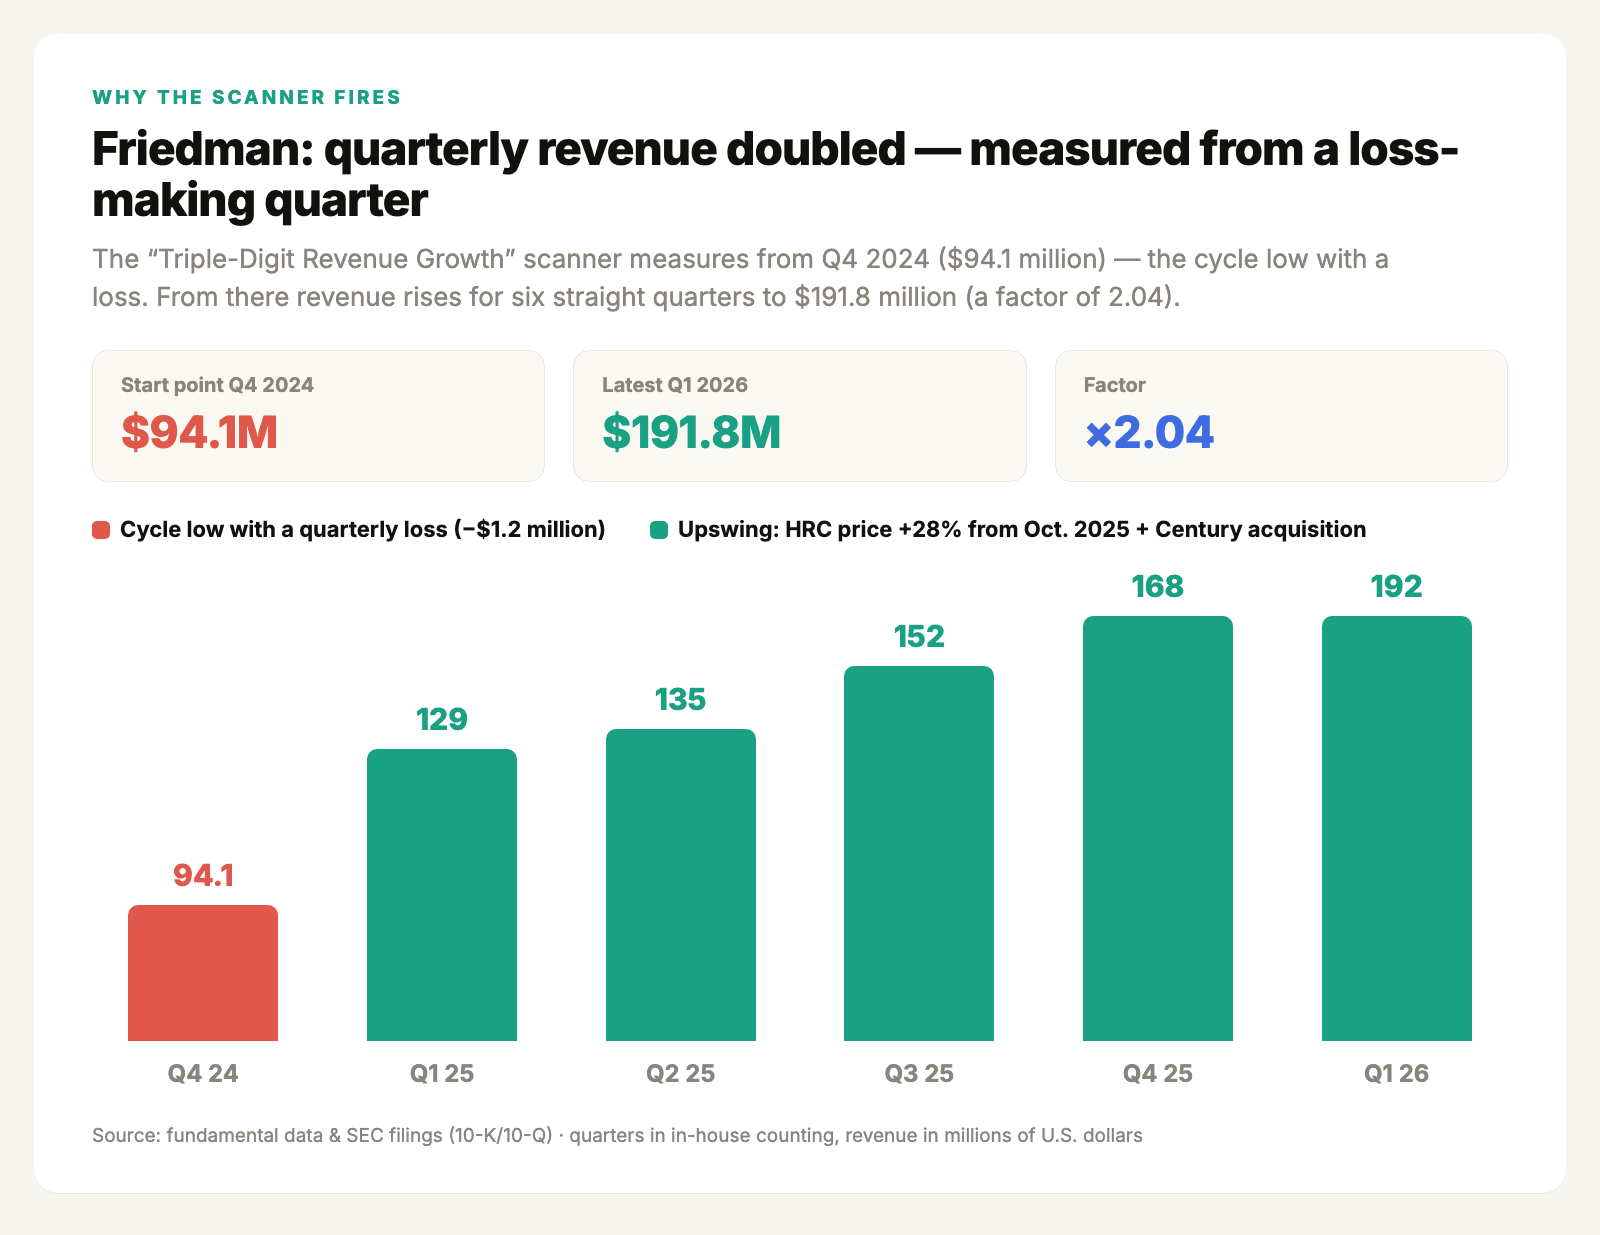
Every day we run about 3,500 stocks through our scanners. Friedman fires in 13 filters (data as of July 8, 2026), among them "Triple-Digit Revenue Growth". And formally the hit is correct: quarterly revenue climbed without interruption from $94 million (fourth quarter of 2024) to $192 million (first quarter of 2026) — more than a doubling.
The catch sits in the starting point. The fourth quarter of 2024 was no normal base — it was the cycle low with a loss: the steel price had crashed about 40 percent before it, and Friedman was in the red that quarter. The "doubling" therefore measures upward from the bottom of a price cycle — it looks like growth, but it is recovery. Remember this tension: the scanner is measuring a cyclical upswing, not structural growth. Here is how to get there yourself: on minnowstreet.com, open "Scanner" in the menu, open the "Triple-Digit Revenue Growth" filter and look for the FRD row.
What the filings say — the uncomfortable truths
Uncomfortable truth no. 1: The "growth" is steel cycle plus acquisition
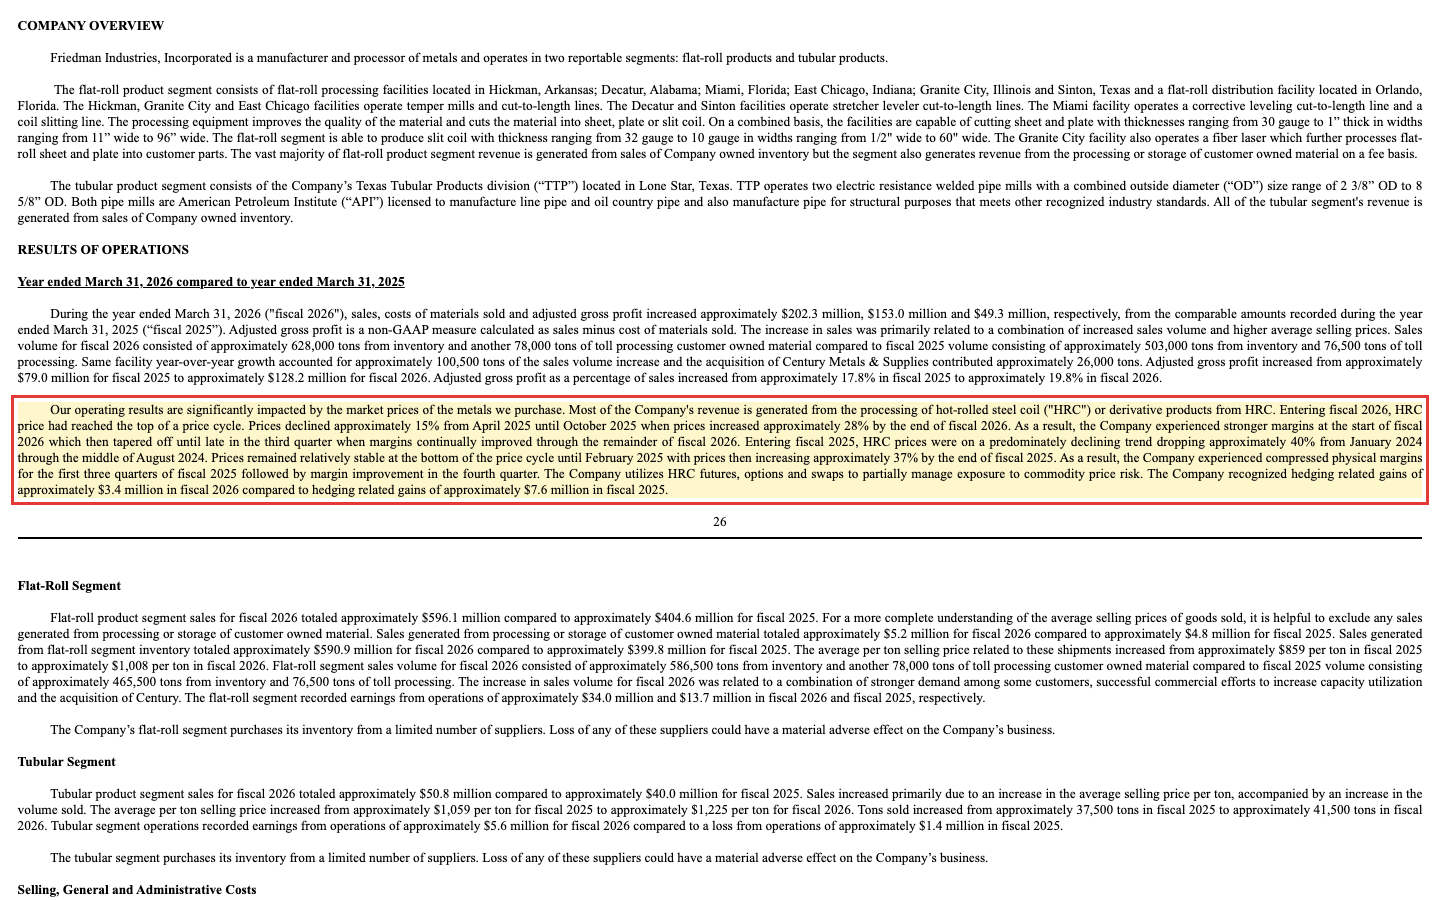
The annual report itself names what drove revenue — and it is not structural success, but the price cycle:
"Entering fiscal 2026, HRC price had reached the top of a price cycle. Prices declined approximately 15% from April 2025 until October 2025 when prices increased approximately 28% by the end of fiscal 2026."
— Friedman Industries, Inc., SEC annual report 10-K for fiscal year 2026, Exhibit 13.1, Management's Discussion and Analysis
Add an acquisition on top: at the end of August 2025, Friedman took over the metals trader Century Metals, which alone contributed $61.5 million of the $202 million revenue increase. How much this business is a cycle rather than a growth path shows in the multi-year view — profit is a roller coaster with two loss years:
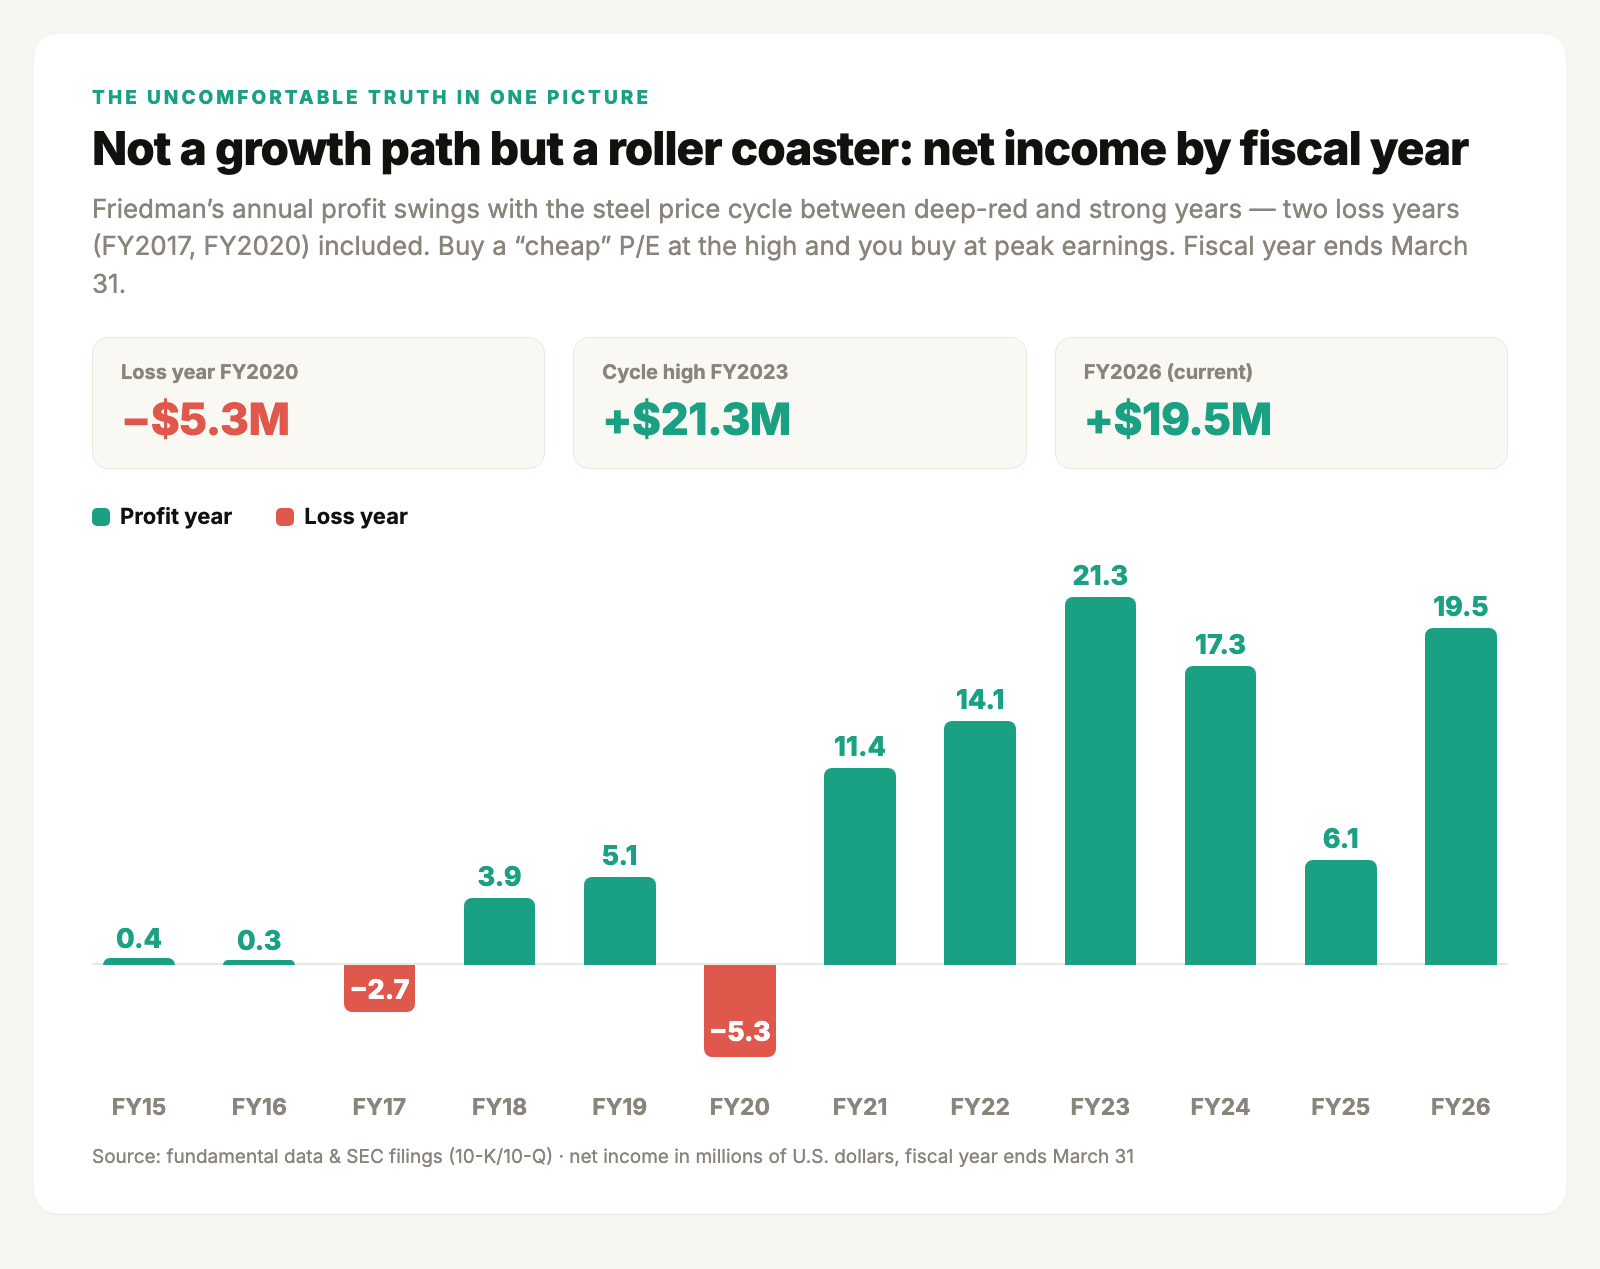
Only part of the increase was genuine operating performance: 100,500 more tons of volume came from existing plants, 26,000 tons from the acquisition. Back in the summer of 2022, quarterly revenue already stood near today's level at roughly $162 million — followed by eight quarters of decline. Remember: at a cyclical, today's revenue is no guarantee of tomorrow's.
Uncomfortable truth no. 2: Without futures contracts, the prior year would have been nearly a zero
Here it gets uncomfortable. Friedman hedges with steel futures — and in fiscal year 2025, almost the entire profit came from exactly these futures contracts, not from the steel business:
"The Company recognized hedging related gains of approximately $3.4 million in fiscal 2026 compared to hedging related gains of approximately $7.6 million in fiscal 2025."
— Friedman Industries, Inc., SEC annual report 10-K for fiscal year 2026, Exhibit 13.1, Management's Discussion and Analysis
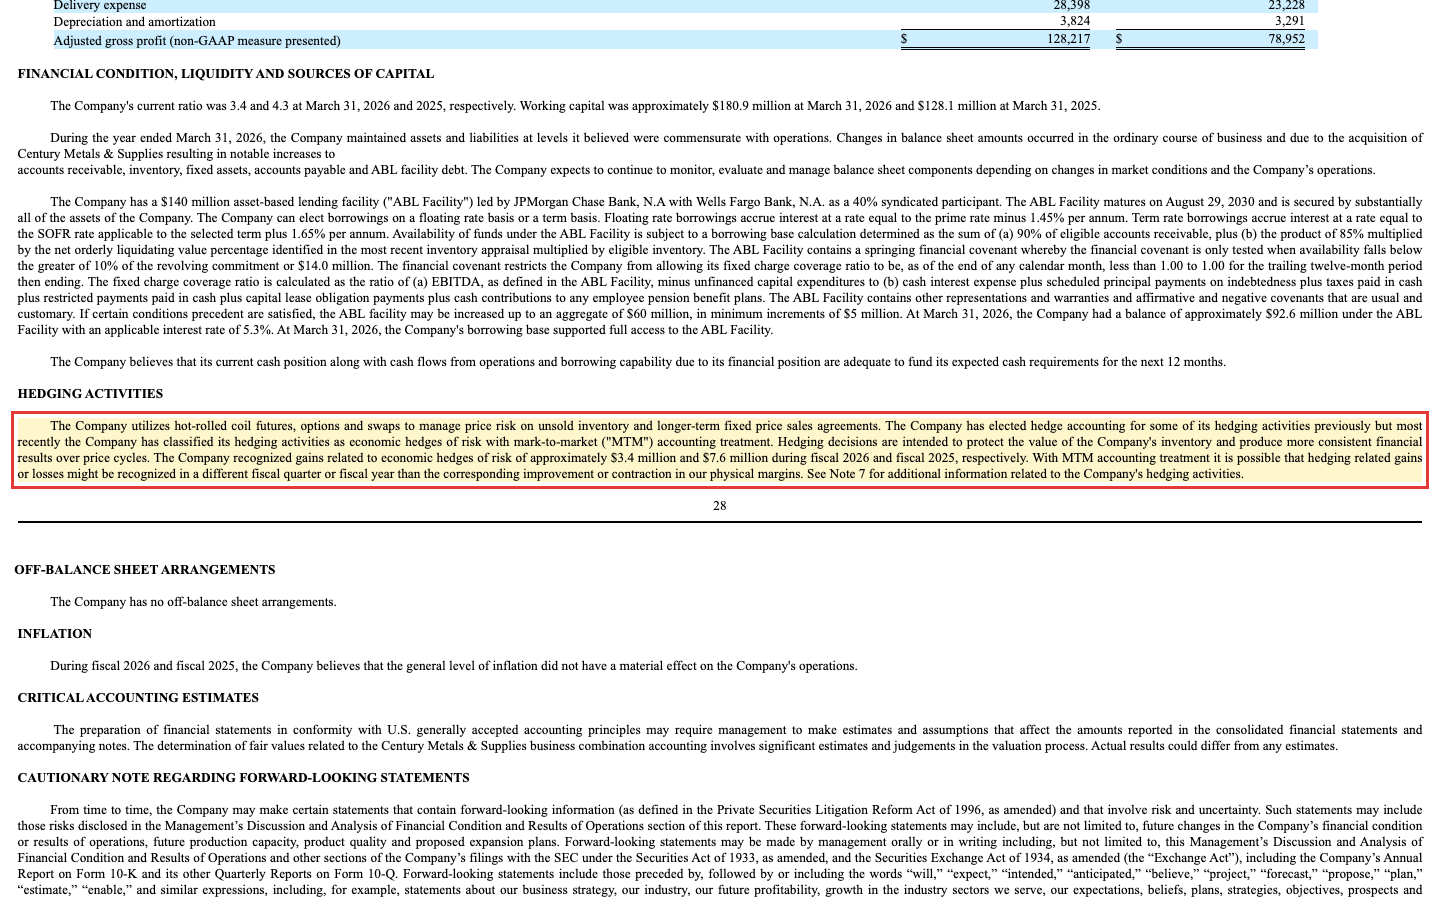
Do the math yourself: in fiscal year 2025, total pre-tax profit stood at $7.7 million — of which $7.6 million, roughly 99 percent, came from the futures book. Without these bets on the steel price, the year would have been close to break-even. Even in the strong fiscal year 2026, $3.4 of the $26.4 million in pre-tax profit came from hedging, plus $1.4 million from a paper-gain remeasurement of the acquisition purchase price. The hedging is expressly intended (it is meant to smooth results across the cycles) — but it also means: part of the "profit" is a successful price bet, not money earned in the core business.
Uncomfortable truth no. 3: Paper profit, thin cash box, growing credit lever
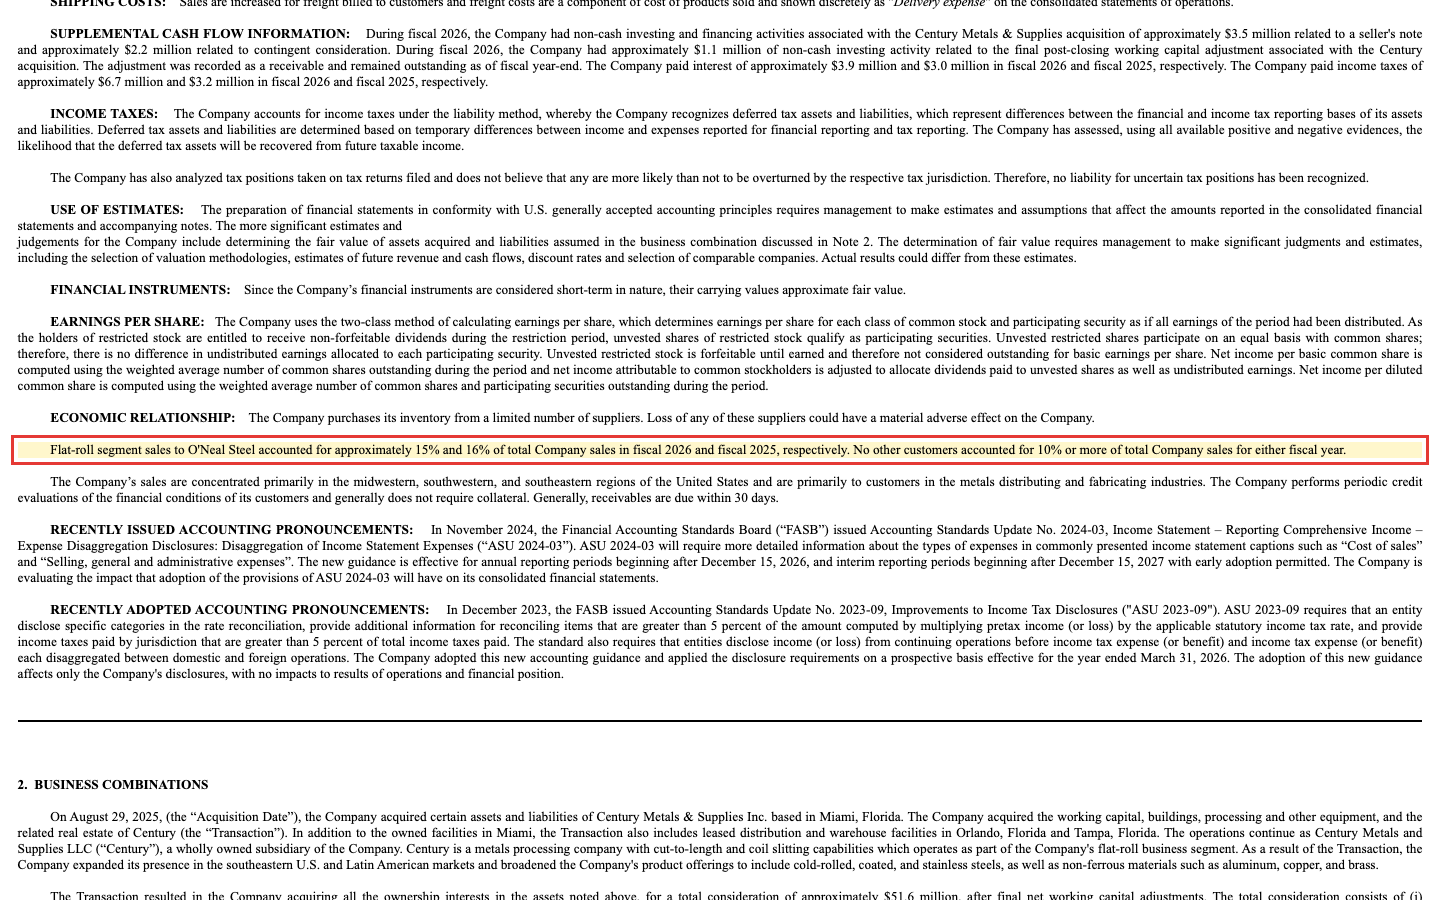
The reported profit of $19.5 million in fiscal year 2026 sounds strong. But little of it arrived as actual cash: operating cash flow came in at just $8.5 million (the prior year was even negative at minus $4.4 million). The reason is typical of an upswing — rising prices inflate inventories and receivables and tie up capital. To shoulder the Century acquisition, Friedman also drew heavily on its credit line: the facility, secured by practically all assets, rose from $47.7 to $92.6 million, while only $2.45 million sits in the cash box. "Low-debt," as Friedman was long known, the company has not been since the acquisition. And a concentration risk remains: a single customer, the steel distributor O'Neal Steel, accounts for 15 percent of revenue:
"Flat-roll segment sales to O'Neal Steel accounted for approximately 15% and 16% of total Company sales in fiscal 2026 and fiscal 2025, respectively. No other customers accounted for 10% or more of total Company sales for either fiscal year."
— Friedman Industries, Inc., SEC annual report 10-K for fiscal year 2026, Exhibit 13.1, Note 1
Valuation — the peak-earnings trap
Now back to the cheap-P/E trap from the opening. Friedman costs roughly 12.5 times its fiscal-2026 profit — optically cheap. But this profit is a cyclical high. Compute the price-to-earnings ratio on the prior year's profit ($6.1 million) and it would stand around 39. And the best evidence that the market itself expects falling profits: the forward price-to-earnings ratio, at 14.4, sits above the current 12.5 — a clear sign of expected earnings decline. On top of that, the share price has run far ahead of the story: it trades roughly 37 percent above the highest price of the entire fiscal year 2026; the rally came only after the results. On substance, Friedman is not expensive (price-to-sales 0.37, price-to-book 1.6, solid equity) — but that is precisely the trap: a cyclical always looks cheap at peak earnings.
Opportunities and risks at a glance
What speaks for Friedman:
- Substance-heavy valuation: price-to-sales 0.37, price-to-book 1.6, equity of roughly $151 million, high liquidity in current assets, a very good Altman Z-score (an early-warning gauge of insolvency risk built from several balance-sheet ratios).
- Organic delivery too: 100,500 more tons of volume from existing plants; the tubular segment turned from loss to profit; the adjusted gross margin edged up.
- The Century acquisition genuinely diversifies (stainless steel, non-ferrous metals, Florida and Latin America) and was already profitable in 2026; an earn-out ties the purchase price to performance.
- A small but reliable dividend payer with a low payout ratio and hardly any dilution; the hedging program kept fiscal year 2025 out of the red.
What speaks against it:
- The "growth" is a steel price upswing from a loss-making low plus an acquisition, not a structural trend; annual profits are a roller coaster with loss years.
- In fiscal year 2025, roughly 99 percent of pre-tax profit came from futures contracts, not from the steel business.
- Paper profit instead of cash (operating cash flow well below net income), thin cash reserves and a fully secured credit facility nearly doubled for the acquisition.
- Concentration risks (one customer at 15 percent, few suppliers), micro-cap illiquidity and a share price 37 percent above the fiscal-year high; the forward price-to-earnings ratio signals falling profits.
A human conclusion
Remember the cheap-P/E trap from the opening — the reflex to grab anything that is "cheap and growing"? After the look into the filings you now know why exactly this combination is dangerous at a steel stock. The low price-to-earnings ratio does not appear because the stock is underestimated, but because profit sits at the cyclical high — and the "triple-digit growth" is the recovery from a loss-making low, amplified by an acquisition and a successful price bet in the futures markets. That is one half of the truth.
The other half: Friedman is a thoroughly solid small company. It is valued with plenty of substance, has genuinely moved more steel organically, turned its pipe business around and broadened itself with the Century acquisition. If you understand the steel cycle and deliberately bet on a continued friendly price environment — and do not pick your entry right at peak earnings — this can be a considered cyclical investment. Just not the growth stock the doubled revenue figure dresses up as.
What you make of it is your decision. And that is exactly as it should be. What matters is only that you know what you are betting on — the steel price, not structural growth. How a scanner-pleasing revenue line can measure something quite different from operating growth is something we dissected at Riot Platforms — and how a full commodity cycle can leave a company with nothing earned at the end, at ProPetro.
Sources
All original documents used in this analysis — to read for yourself:
- Friedman Industries, Inc. — SEC annual report 10-K for fiscal year 2026 (Exhibit 13.1 with Management's Discussion and Analysis and financial statements; fiscal year ended March 31, 2026; filed June 11, 2026)
- Friedman Industries, Inc. — SEC quarterly report 10-Q as of December 31, 2025 (filed February 9, 2026)
- Friedman Industries, Inc.'s complete SEC filing history: EDGAR overview (sec.gov)
- Fundamental data (metrics, valuation, quarterly and annual series); in-house stock scanner, data as of July 8, 2026.
Transparency & disclaimer: This analysis is a journalistic contextualization of publicly available information and is not investment advice, not a financial analysis in the regulatory sense, and not a solicitation to buy or sell securities. Stock investments carry substantial risks up to total loss. All information without guarantee; the data cut-off is noted in the text in each case. The author holds no position in Friedman Industries stock at the time of publication.
Our Bottom Line at a Glance
- Substance & balance sheet positive
- Valued with plenty of substance (price-to-sales 0.37, price-to-book 1.6), roughly $151 million of equity, high liquidity in current assets, a very good Altman Z-score. A small but reliable dividend payer with a low payout ratio.
- Revenue "growth" negative
- The doubling is measured from the loss-making low of the steel price cycle (fourth quarter of 2024) and amplified by the Century acquisition ($61.5 million). Annual results are a roller coaster between $78 and $647 million of revenue with two loss years — not a structural trend.
- Earnings quality negative
- In fiscal year 2025, roughly 99 percent of pre-tax profit ($7.6 of $7.7 million) came from futures contracts, not from the steel business; in 2026 too, $3.4 of $26.4 million came from hedging plus a $1.4 million paper gain. Operating cash flow ($8.5 million) well below the reported profit.
- Balance-sheet risk negative
- A thin cash box ($2.45 million), the credit facility secured by practically all assets nearly doubled from $47.7 to $92.6 million for the acquisition. Concentration risks: one customer at 15 percent of revenue, few suppliers with a "material adverse effect" warning.
- Valuation & share price negative
- The optically cheap price-to-earnings ratio of 12.5 sits at peak earnings (about 39 on the prior year's profit); the forward P/E of 14.4 signals expected earnings decline. The share price stands roughly 37 percent above the fiscal-year high, and as a micro cap the stock is illiquid.
Friedman Industries is a thoroughly solid small steel processor with a substance-heavy balance sheet — but the doubled revenue figure that triggers the scanner is a steel price upswing from a loss-making low plus an acquisition, not structural growth. Profit hangs on the price cycle and partly on futures contracts, the cheap price-to-earnings ratio sits at the peak, and the share price has run far ahead of the story. A considered cyclical investment for those who know the cycle, not a growth stock. Not investment advice.
What Our Rating Means
- If you don't own the stock
- In our view, the documented risks clearly outweigh — we see no basis for an entry.
- If you hold it in your portfolio
- In our view, the findings carry enough weight to warrant a critical look at your own position.
A journalistic assessment by our editorial team at the time of the deep dive, based on public sources — not investment advice and not a solicitation to buy or sell. Your personal circumstances (investment goals, risk capacity, taxes) cannot be taken into account. What our categories mean, how verdicts are formed, and what conflicts of interest exist →
Worth Noting
- The fiscal year ends March 31; "fiscal year 2026" is April 2025 through March 2026. The quarterly figures for January through March 2026 are derived from the annual report (10-K) — there is no separate quarterly filing for a fiscal fourth quarter.
- As a smaller reporting company, Friedman is exempt from the risk-factors chapter ("Item 1A. Risk Factors — Not required"); disclosure is correspondingly thinner than at larger companies.
- Price and valuation figures are dated July 6-8, 2026; analyses are evergreen, daily prices are not a buy argument.
Frequently Asked Questions
Friedman Industries (Nasdaq: FRD) is a small U.S. steel processor from Texas. It buys hot-rolled steel coils, levels and cuts them into sheet and plate (flat-roll products segment) and welds part of the volume into pipe for oil, gas and construction applications (tubular products segment). Money is earned above all on the spread between the purchase and sale price of the steel.
Mainly because of the steel price cycle and an acquisition, not structural growth. The starting point (fourth quarter of 2024) was the cycle low with a loss; afterwards the steel price rose again by about 28 percent from October 2025. In addition, Century Metals, acquired in August 2025, contributed $61.5 million of the $202 million revenue increase.
With a cyclical, caution is in order. The price-to-earnings ratio of 12.5 sits at peak earnings; computed on the prior year's profit it would stand around 39. The forward price-to-earnings ratio, at 14.4, is even above the current one — so the market itself expects falling profits. At steel stocks, a cheap P/E is often a warning sign, not a buy signal.
In fiscal year 2025, astonishingly little: $7.6 of the mere $7.7 million in pre-tax profit came from futures contracts (hedging) — roughly 99 percent. Without these price bets, the year would have been close to break-even. Even in the strong fiscal year 2026, $3.4 of the $26.4 million in pre-tax profit came from hedging, plus $1.4 million from a paper-gain remeasurement.
On substance, yes (solid equity, high liquidity in current assets, a good Altman Z-score), but the cash box is thin at $2.45 million, and for the Century acquisition the credit facility, secured by nearly all assets, was almost doubled from $47.7 to $92.6 million. Operating cash flow ($8.5 million) also came in well below the reported profit.
Friedman Industries is listed on the Nasdaq Global Select Market (ticker FRD; formerly on the NYSE American). It is a micro cap with a market value of roughly $240 million and only about 7.1 million shares; daily trading volume is correspondingly small and the stock swings sharply.
Found an error?
Did you spot a factual error, an outdated number, or a typo in this deep dive? Let us know briefly — your report goes straight to the editorial team.