Dollar General: Shrink Fell by a Third — and Suddenly the Turnaround Looks Real
Dollar General runs 20,959 stores, most of them in towns of fewer than 20,000 people. Earnings fell for two straight years, then turned: $1,512.3 million in fiscal 2025 after $1,125.3 million the year before. The reason sits in a line item almost nobody reads — shrink included in cost of goods sold dropped from $928.9 million to $634.3 million. That is 56 percent of the entire pre-tax increase. We read the annual report (10-K) for the year ended January 30, 2026 and the quarterly report (10-Q) for the period ended May 1, 2026 line by line: what is really turning, what was a one-time clean-up, and what pushes back in 2026. Not investment advice — just the question of how much turnaround fits into a number that cannot be halved twice.
 Thomas Mücke
Founder & Publisher
Thomas Mücke
Founder & Publisher
Chart
Interactive price chart (TradingView).
Note: pure fact-based analysis, not investment advice and not a solicitation to buy or sell. All figures without guarantee.
Table of contents
- The one-off trap
- What Dollar General actually does
- How the stock landed on our desk
- The numbers over the years — given their due
- What the filings say — the uncomfortable truths
- Valuation: cheap on sales, ordinary on earnings
- Opportunities and risks at a glance
- A human conclusion
- Sources
The one-off trap
There is a mental trap that springs shut exactly when a battered company finally delivers again: the one-off trap. Earnings rise, the headline sounds like a turnaround — and the mind books the jump as new strength, even though it came from a single item that cannot repeat. A clean-up is not a business model.
Dollar General Corporation (NYSE: DG) is the perfect test case. Net income fell for two straight years, then turned: $1,512.3 million in fiscal 2025 after $1,125.3 million the year before — up 34 percent. Before the reflex takes over, let us make a deal: we read the annual report (10-K) for the year ended January 30, 2026 and the quarterly report (10-Q) for the period ended May 1, 2026 together, and specifically the lines where the jump actually happens. Keep this sentence for the whole piece: an earnings jump tells you something changed — not whether it can change again.
What Dollar General actually does
Dollar General is not a dollar store, whatever the name suggests. It is a small-format convenience retailer for places where a supermarket does not pencil out. The annual report puts it plainly: the company is the largest discount retailer in the United States by number of stores — 20,959 locations across 48 states and Mexico as of February 27, 2026. An average store carries roughly 7,500 square feet of selling space, the new standard format about 8,500. Roughly 80 percent of the stores sit in towns of 20,000 people or fewer. A typical store is staffed by a manager, one or more assistant managers and four or more sales associates; in total the company employs about 194,000 people (as of February 27, 2026).
What sells is what runs out fastest: the consumables category — food, paper products, cleaning supplies, health and beauty, pet supplies — accounted for just over 82 percent of net sales in fiscal 2025. The rest splits into seasonal merchandise (10.1 percent), home products (5.2) and basic apparel (2.7). That is the bind of the model: consumables bring traffic but carry the thinnest margin. Which is why Dollar General has fought for years to get more non-consumables into the basket — in the first quarter of fiscal 2026 it managed that for the fifth consecutive quarter, as the filing explicitly notes.
The company names its direct competitors itself: Walmart, Family Dollar and Dollar Tree. And it describes its customer base without varnish:
"Our core customers are often among the first to be affected by negative or uncertain economic conditions and among the last to feel the effects of improving economic conditions, particularly when trends are inconsistent and of an uncertain duration."
— Dollar General Corporation, SEC annual report 10-K for fiscal 2025, Item 7 MD&A ("Executive Overview")
That is the heart of the investment case, and it cuts both ways. When life gets more expensive, customers trade down from pricier retailers to Dollar General. When life gets too expensive, those same customers buy less, reach for smaller pack sizes and leave the higher-margin seasonal goods on the shelf. Dollar General benefits from some hardship, not from a lot of it.
There is also a construction site in the next room: pOpshelf, the company's own concept for home décor, health and beauty and party goods, ended fiscal 2025 with 180 standalone stores. In the fourth quarter of fiscal 2024 a store portfolio optimization review forced impairment charges of $214.2 million — the majority of which, the filing says, related to pOpshelf locations. Keep that in mind: the company has itself acknowledged that not every growth idea carries.
How the stock landed on our desk
We run roughly 3,500 stocks through our scanners every day. Dollar General reached the research list through our in-house stock scanner "Turnaround Candidates": rank 24 of 60 U.S. hits, turnaround check 6 of 8 points, measured on the live list on July 26, 2026. To reproduce it: open the scanner, set the country filter to "US", and sort by the "turnaround check" column. These lists are recalculated daily — the rank and the score are a dated snapshot, not a permanent state.
The model behind it has four pillars, and two of them are mandatory. Fail them and you are out, however good the rest looks.
- Pillar 1 — the crash: the stock must trade at least 50 percent below its all-time high. Without a real crash there is no turnaround; otherwise the scanner catches ordinary growth stocks.
- Pillar 2 — survival: the Altman Z-score must be at least 1.1. That metric is a bankruptcy early-warning system: it compresses liquidity, profitability, leverage and asset efficiency into a single number. Below 1.1 lies the distress zone — the classic turnaround mistake is going bankrupt before the turn. Add at most one balance-sheet warning flag and positive equity.
Only then does the actual turnaround check apply: eight points, four from the quarterly numbers (revenue direction, net margin, operating cash flow, healing balance sheet) and four from market behavior (price above the 50-day line, short-term relative strength beating long-term, insider buying, institutions adding). A stock is shown once it reaches at least 6 of 8. Dollar General sits at exactly 6 of 8, the display floor — two of the eight tests come up empty.
Pillar 2 is comfortable: the Altman Z-score stands at 4.87 (data cut-off July 26, 2026), far above the distress zone and even above the 3.0 mark at which the metric is considered safe. The Piotroski balance-sheet check reads 7 of 9. No survival problem here.
Pillar 1 is where it gets tight — and that belongs on the table. Our platform measures the distance to the all-time high at −51.0 percent (data cut-off July 26, 2026). That leaves only 1.0 percentage point of headroom above the mandatory −50 percent threshold. Arithmetically a price of roughly $120 — against $117.20 on July 26, 2026 — breaks pillar 1: the stock leaves the list without anything changing in the business. We checked the number against our own price history: on a dividend-adjusted basis we get −51.6 percent, on unadjusted closing prices (highest close $260.44 on October 28, 2022 against $117.23 on July 24, 2026) −55.0 percent, which implies a threshold near $130. All three measures sit in the same corridor — the difference comes from dividend adjustment, not from a data error.
And now the punchline: the average price target of the 31 analysts covering the stock is $130.90 (data cut-off July 26, 2026). If the professionals are right, the stock falls out of the very list through which we found it. That is not a criticism of the scanner — it is its design: it hunts crashes that are turning, not recoveries that have already run. Keep the distinction: a scanner rank is an invitation to research, not a verdict on the company.
At the same data cut-off Dollar General also appears in other lists, among them "Altman Z: Balance Sheet Fortress" and "Stan Weinstein: Stage 1" (base building). That, too, is a snapshot dated July 26, 2026 and changes with every recalculation.
The numbers over the years — given their due
Start with what genuinely impresses: revenue never fell. Not in a single year. $37.8 billion in fiscal 2022, then $38.7 billion, then $40.6 billion and most recently $42.7 billion in fiscal 2025. Same-store sales rose 3.0 percent in fiscal 2025 after 1.4 percent the year before. Dollar General never had a demand problem — the customers kept coming.
Earnings told a different story:
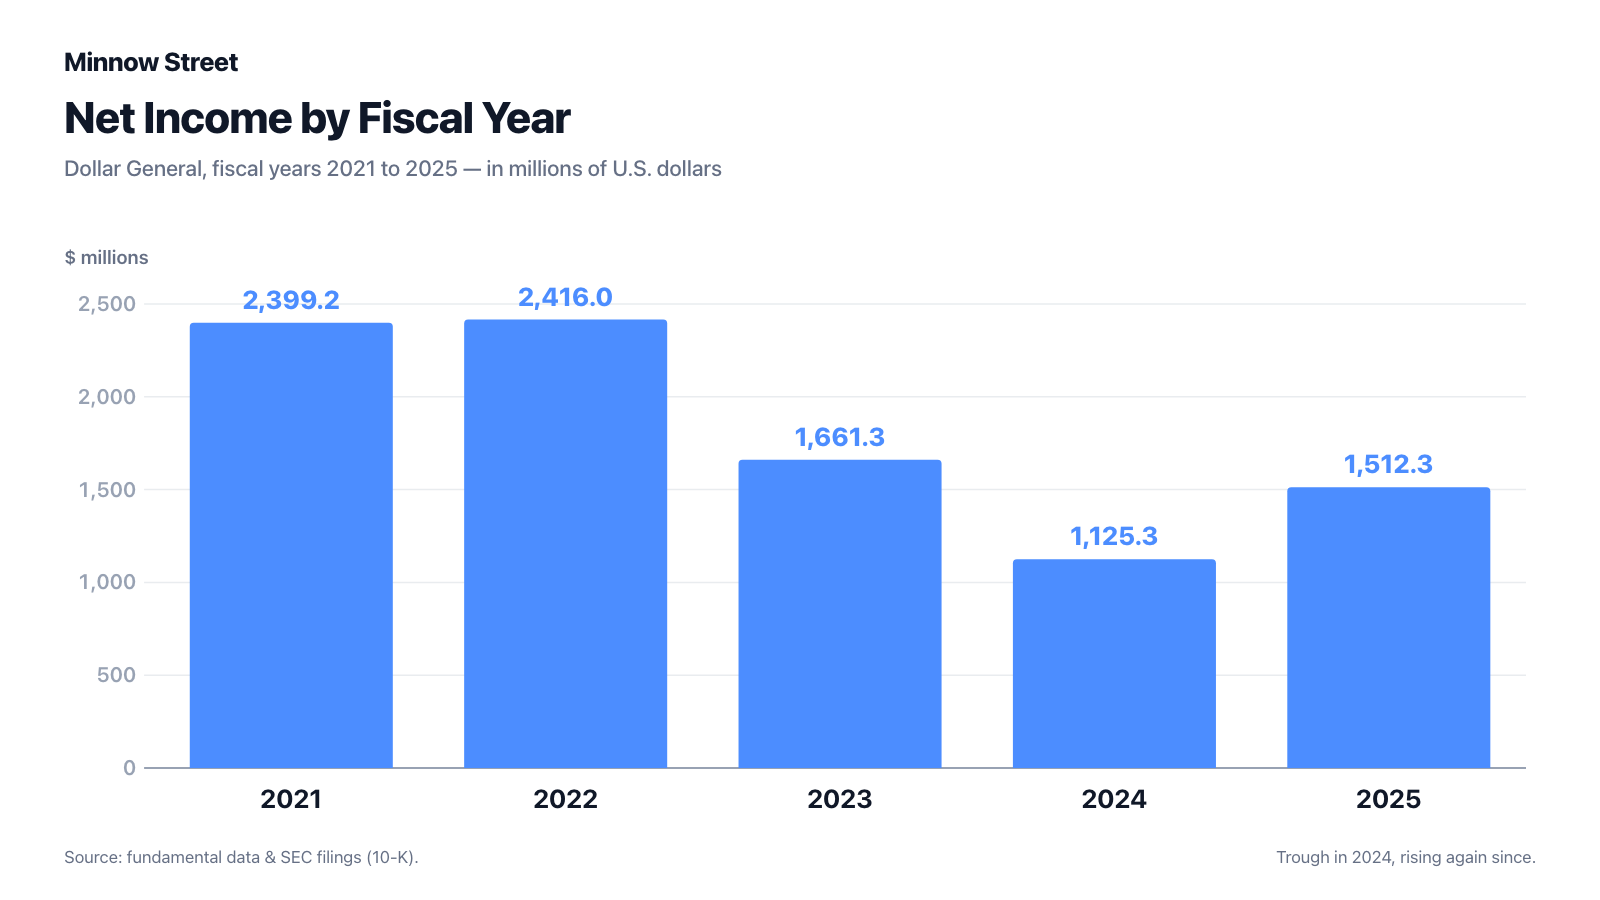
From the peak of $2,416.0 million (fiscal 2022) the line went to $1,661.3 million and then to $1,125.3 million (fiscal 2024) — down 53 percent in two years, on rising revenue. That is the definition of a margin problem. And that is exactly where the turn begins: $1,512.3 million in fiscal 2025, up 34 percent. In plain language: the store was full the whole time, but less and less of the money made it out the back — now more of it does.
The balance sheet is healing visibly as well. Operating cash flow — the money the business actually brings in — rose from $2,391.8 million (fiscal 2023) through $2,996.1 million to $3,634.5 million (fiscal 2025). After $1,241.2 million of capital expenditures, roughly $2,393 million of free cash flow remained in fiscal 2025, against $691.6 million in fiscal 2023. Equity grew from $7,413.7 million (January 31, 2025) to $8,512.0 million as of January 30, 2026; total debt stood at $4.6 billion at the balance sheet date, after repayments of long-term obligations of $1.7 billion in fiscal 2025 alone (fiscal 2024: $770.2 million). Net interest expense dropped accordingly from $326.8 million (fiscal 2023) through $274.3 million to $230.6 million (fiscal 2025). That is not cosmetics; that is real deleveraging.
The turn continued into the first quarter of fiscal 2026 — in smaller steps. In the 13 weeks ended May 1, 2026 net sales rose 3.4 percent to $10,787.0 million, same-store sales 2.0 percent (customer traffic up 1.4 percent, average transaction up 0.5 percent). Gross profit grew 5.5 percent and the gross margin 65 basis points to 31.62 percent. Net income rose 13.3 percent to $444.1 million and diluted earnings per share 12.4 percent to $2.00. Average sales per square foot: $271, up from $265. Inventory turnover: 4.5, up from 4.2.
One detail keeps the curve honest: despite the jump, fiscal 2025 net income is still 37 percent below the fiscal 2022 peak — and revenue has grown by a quarter since then. The margin is not back; it is on its way. Which brings us to the uncomfortable truths.
What the filings say — the uncomfortable truths
Uncomfortable truth no. 1: half the earnings jump sits in a line nobody reads
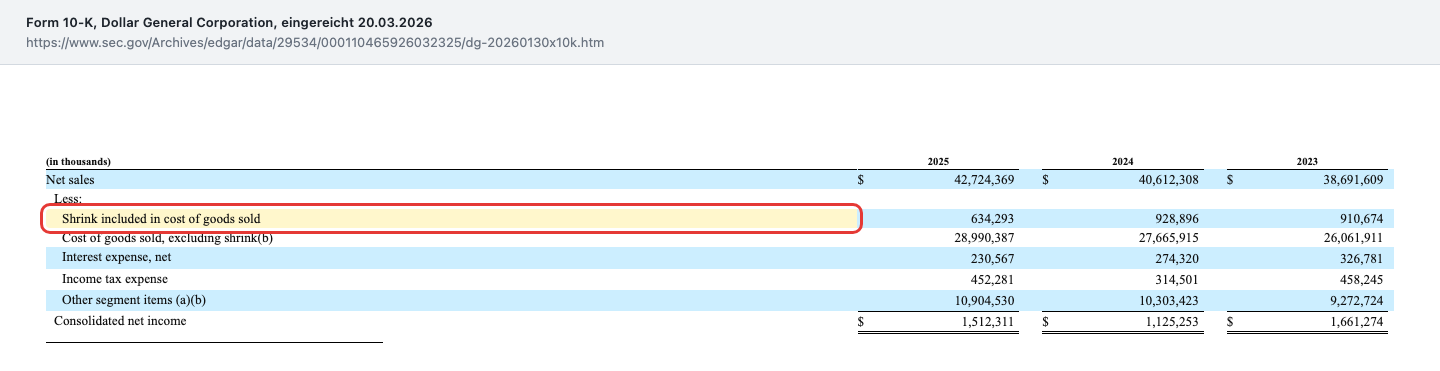
Deep inside the segment table of the annual report sits an item with the unremarkable name "Shrink included in cost of goods sold." In plain terms: everything that disappears between the loading dock and the register. Shoplifting, internal loss, spoilage, mis-posting. For a retailer that is not a footnote but a hard cost line.
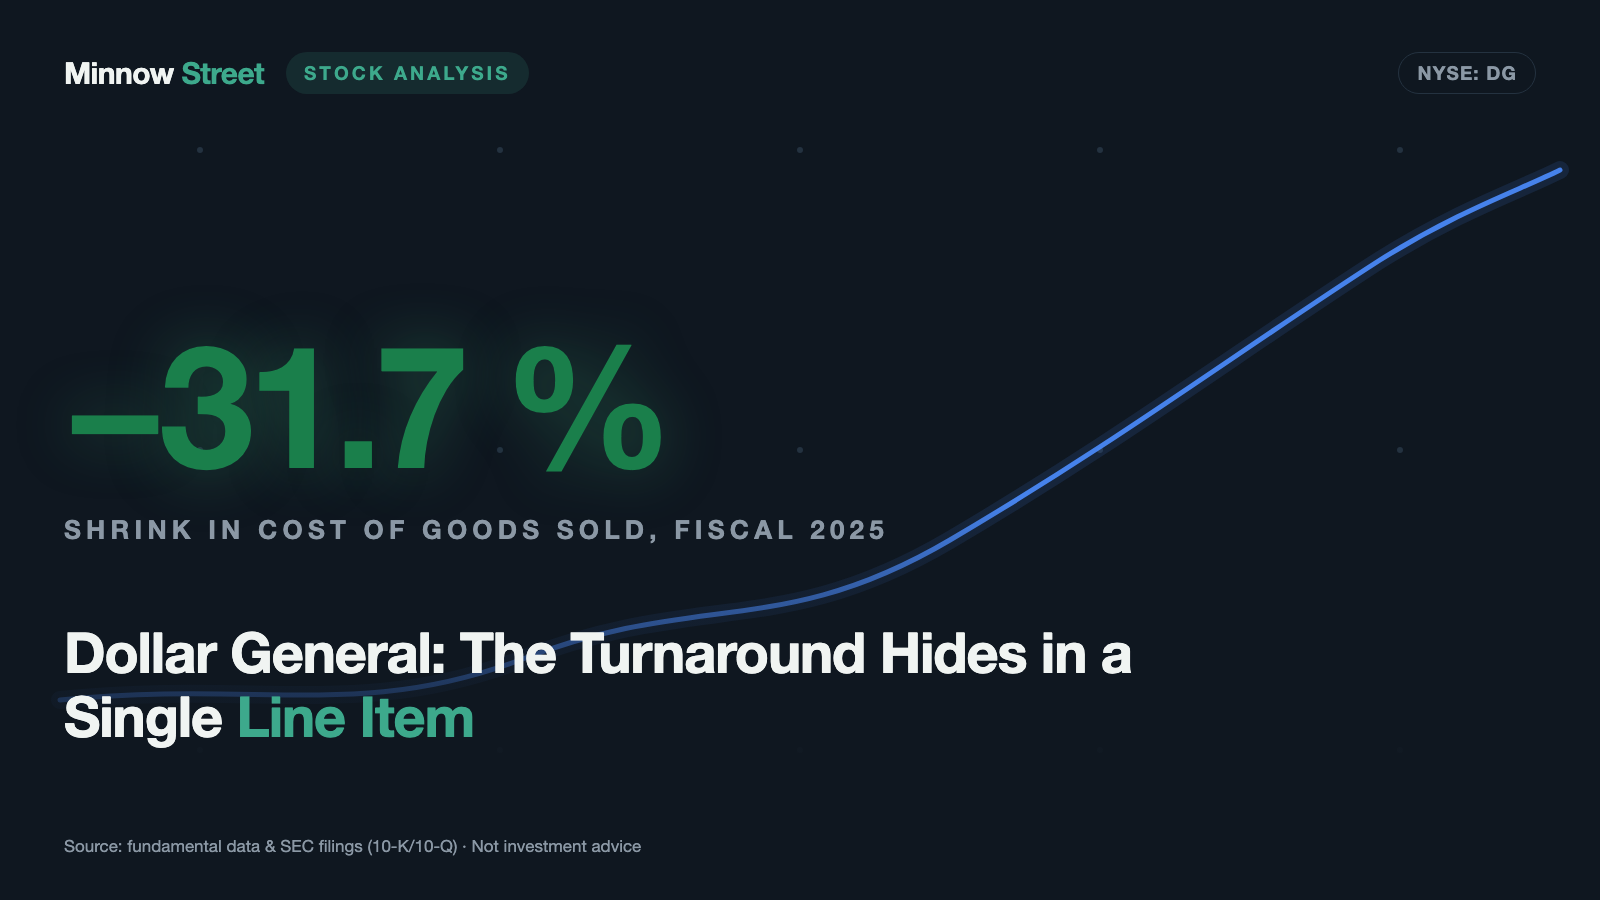
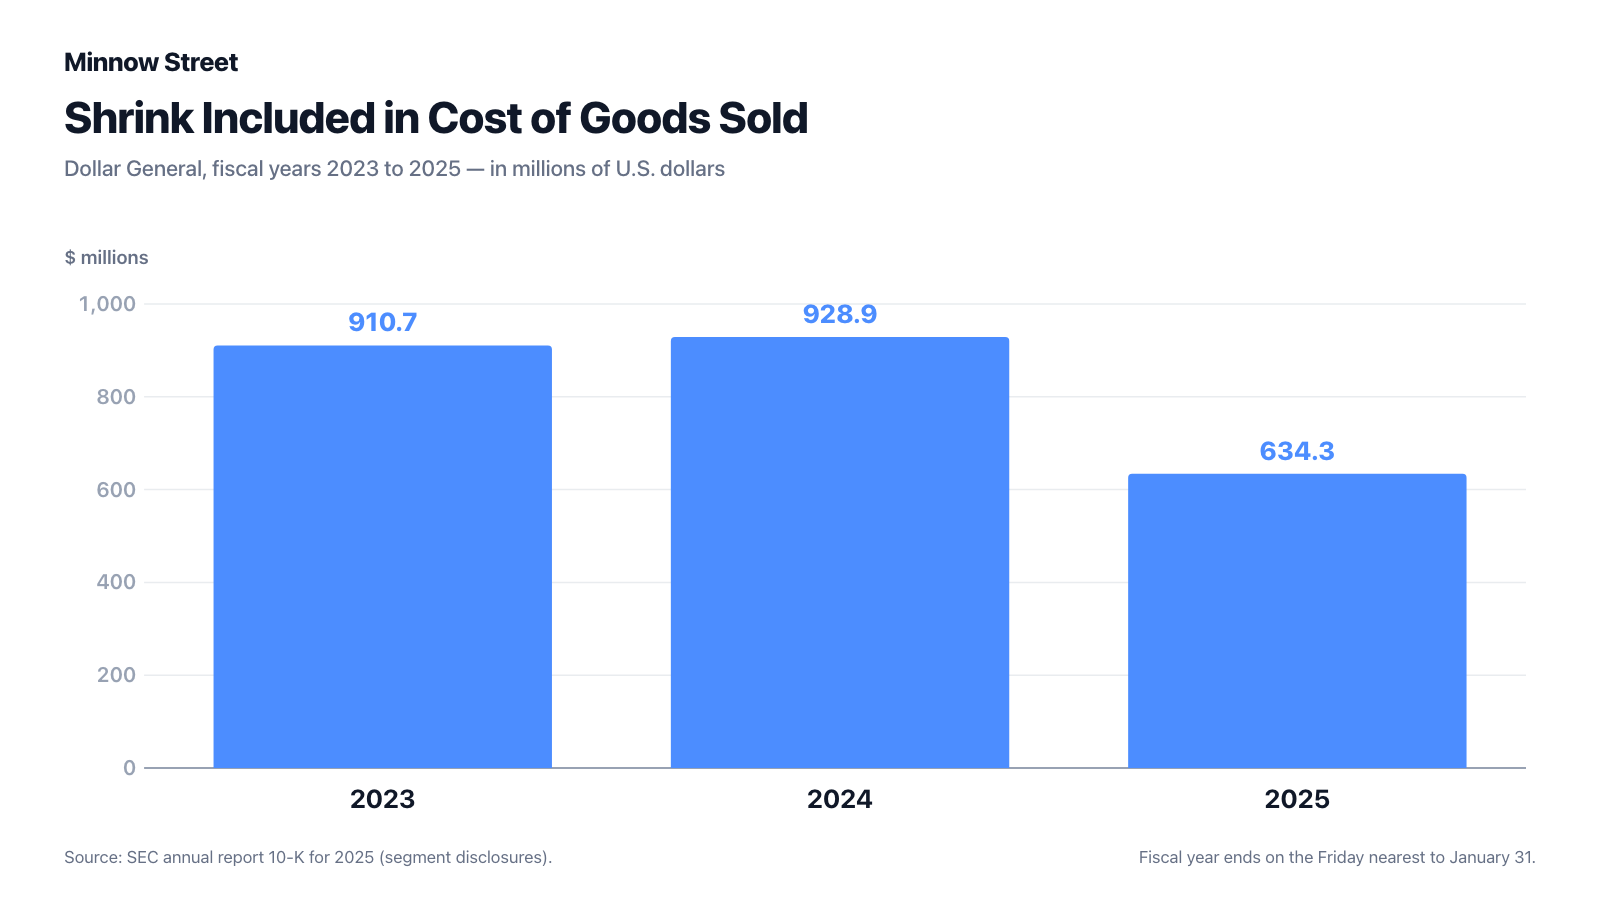
The numbers: $910.7 million (fiscal 2023), $928.9 million (2024), $634.3 million (2025). That is a decline of 31.7 percent in a single year. Measured against net sales that is 2.35 percent, then 2.29 percent and most recently just 1.48 percent. Per store, roughly $30,000 of merchandise still vanishes each year, measured against the 20,959 stores as of February 27, 2026.
Now the calculation that matters. Pre-tax income rose in fiscal 2025 from $1,439.8 million to $1,964.6 million, an increase of $524.8 million. The drop in shrink alone accounts for $294.6 million — 56 percent of the entire increase. Another $43.8 million (8 percent) comes from lower interest expense. Together, two items that have little to do with selling merchandise explain roughly two thirds of the earnings jump. The company names the driver itself:
"In 2025, gross profit increased by 9.0%, and as a percentage of net sales increased by 107 basis points to 30.7%, compared to 2024, primarily driven by lower shrink, higher inventory markups and lower inventory damages, partially offset by an increased LIFO provision."
— Dollar General Corporation, SEC annual report 10-K for fiscal 2025, Item 7 MD&A ("Gross Profit")
This is expressly not accounting sleight of hand — shrink really did fall, and cutting it is hard operational work: merchandise protection, locked shelves, less self-service on certain items, better inventory processes. The company deserves credit. But the decisive question is: how many times can you collect the same shrink? Going from 2.29 percent of sales to 1.48 percent is an enormous step. Going from 1.48 percent to 0.67 percent would be the next equally large one — and that is simply not achievable in retail.
The latest quarter confirms exactly that. In the 13 weeks ended May 1, 2026 shrink fell from $176.1 million to $153.2 million — down $22.9 million, or 13.0 percent, from 1.69 percent to 1.42 percent of net sales. The direction holds; the pace has slowed by a multiple. Remember: the shrink lever is real, but it is a diminishing lever.
Uncomfortable truth no. 2: in March 2025 the credit covenants had to be loosened
A healthy company does not need an exception from its banks. Dollar General needed one. The annual report describes it matter-of-factly:
"On March 11, 2025, we amended the credit agreement governing the Revolving Facility to increase the maximum leverage ratio and decrease the minimum fixed charge ratio through January 30, 2026, or earlier at our option upon achieving certain financial covenant milestones (“Covenant Relief Period”). During the Covenant Relief Period, we were restricted from repurchasing shares of our common stock and the ability to incur certain additional liens and subsidiary debt was reduced."
— Dollar General Corporation, SEC annual report 10-K for fiscal 2025, Item 7 ("Revolving Facility")

Fairness demands the other half of the picture: as of January 30, 2026 all covenants were met, the relief window expired on schedule, the $2.375 billion revolving facility was entirely undrawn, and the commercial paper program of up to $2.0 billion showed no notes outstanding on the consolidated balance sheet. For fiscal 2026 the company expects combined borrowings of at most roughly $400 million at any one time. That is a comfortable position.
The episode still leaves a mark — in the rating. From the filing:
"In 2025, Standard & Poor’s changed our outlook from “Negative” to “Stable,” and Moody’s changed our rating from Baa2 to Baa3 and our outlook from “Negative” to “Stable.”"
— Dollar General Corporation, SEC annual report 10-K for fiscal 2025, Item 1A Risk Factors (liquidity)

Translated: Baa3 is the bottom rung of the investment-grade ladder. One notch below begins the territory the market calls high yield — where many institutional investors are no longer allowed to buy. The quarterly report for the period ended May 1, 2026 confirms the status unchanged: Moody's Baa3 (commercial paper P-3), Standard & Poor's BBB (A-2), both outlooks stable. Because the interest margins on the revolving facility are contractually tied to the long-term rating, this is not a beauty contest: against $4.6 billion of debt, a further downgrade would land straight in the income statement. Remember: the company is not in danger — but it carries less cushion than its blue-chip reputation suggests.
Uncomfortable truth no. 3: in 2026 a new line works against the margin — fuel
Dollar General does a lot of its own driving. The company runs a private truck fleet to supply 20,959 stores, many of them far off the main roads. That is exactly where 2026 brings headwind, and the quarterly report says so with unusual directness:
"Furthermore, we incurred significantly higher fuel costs in the first quarter of 2026, and we expect this trend to continue for an uncertain duration."
— Dollar General Corporation, SEC quarterly report 10-Q for the period ended May 1, 2026, Item 2 MD&A

Elsewhere the same filing notes that the progress on shrink and damages helped "partially mitigate our significant fuel costs." That names the mechanism openly: part of the shrink gain is consumed before it reaches the bottom line. It shows up in selling, general and administrative expenses, which rose 25 basis points in the quarter to 25.70 percent of net sales — driven, per the filing, by depreciation and amortization, utilities and property taxes.
Two further cost lines push back in 2026. First, taxes: the Work Opportunity Tax Credit expired for employees hired after December 31, 2025. The annual report warns that absent reauthorization the company "will experience a significant negative impact to the effective tax rate in future years" — in the first quarter of fiscal 2026 the effective rate was already 24.9 percent, up from 23.4 percent a year earlier. Second, tariffs: on February 20, 2026 the United States Supreme Court invalidated the tariffs imposed under the International Emergency Economic Powers Act; the filing states that significant uncertainty exists regarding potential refunds and replacement tariffs. Tariffs had "no material impact" in fiscal 2025 — for 2026 that is an open account.
Uncomfortable truth no. 4: three years without buybacks, a frozen dividend — and $1.38 billion nobody touches
Anyone expecting capital returns should read the financing section. Dollar General repurchased not a single share in fiscal 2023, 2024 and 2025 — the filing repeats the phrase "did not repurchase shares of our common stock" for each of those years. The quarterly dividend has been unchanged at $0.59 per share; cash dividends paid were $518.0 million (fiscal 2023), $519.0 million (2024) and $519.5 million (2025). On June 1, 2026 the board again declared $0.59 per share. That is stability — and also three years without an increase.
The interesting part sits in the quarterly report for the period ended May 1, 2026. The covenant-driven buyback ban had lapsed on January 30, 2026. Available would be an authorization of roughly $1.38 billion with no expiration date — about 5.4 percent of the market value. Repurchased in the quarter: nothing. Instead the company repaid $1.7 billion of long-term obligations in fiscal 2025 and plans $1.4 billion to $1.5 billion of capital spending in fiscal 2026 across roughly 4,730 real estate projects — 450 new U.S. stores, about 10 more in Mexico, 2,000 full remodels (Project Renovate) and 2,250 partial remodels (Project Elevate).
You can approve of that: with a rating on the investment-grade edge, paying down debt and investing in the stores is the more sensible order. But you should know it. Anyone buying Dollar General for capital returns is buying a company that currently puts its money into concrete, shelving and debt repayment — at a dividend yield of roughly 2.0 percent and a payout ratio of 33.4 percent (data cut-off July 26, 2026). How strongly such capital discipline shapes the perception of a retailer also came up in our analysis of Kohl's: the flow of capital tells you more about management confidence than any guidance does.
Valuation: cheap on sales, ordinary on earnings
How expensive is the stock? What matters is the order of magnitude, not the daily price. At roughly $25.5 billion of market value (220,586,647 shares per the cover page of the quarterly report dated May 29, 2026, price $117.20 on July 26, 2026), the ratios come out roughly as follows: price-to-earnings around 17 (about 16 on expected earnings), price-to-sales around 0.6, price-to-book around 3.0, price to free cash flow around 8.8 and an enterprise value near 12 times operating profit before depreciation. Return on equity stands at 18.9 percent, net margin at 3.6 percent (all values as of July 26, 2026).
Translated: measured on sales, the stock looks optically cheap — 0.6 times revenue sounds like a bargain. But that is precisely the trap with retailers: a discounter with a 3.6 percent net margin must carry a low price-to-sales ratio, because so little of each sales dollar survives. The more honest yardstick is earnings — and a multiple of roughly 17 for a thin-margin retailer is not a fire-sale price but an ordinary valuation. All the more so given that earnings themselves just jumped sharply.
The professionals are correspondingly split: of 31 analysts, 8 rate the stock a strong buy and 4 a buy, 18 sit on hold, one on strong sell; the average price target is $130.90 (data cut-off July 26, 2026). That is not euphoria but the typical stance toward a turnaround that is half proven. For a dated anchor from the filing itself: as of August 1, 2025 the cover page of the annual report puts the market value of shares held by non-affiliates at $21.1 billion, based on a closing price of $108.53. For a sense of how differently the market prices quality versus recovery, compare a very different business model from the same scanner list — our analysis of Moody's.
Two figures should not be overlooked. First, leverage: $4.6 billion of debt against $3,634.5 million of annual operating cash flow — barely more than one year of cash generation, not a problem number. Second, the price path, purely as a dated anchor: the 52-week high is $156.24 (February 27, 2026), the 52-week low $95.94 (November 6, 2025), the closing price $117.23 on July 24, 2026. The stock swung more than 60 percent within nine months — at a beta of just 0.25 against the broad market. It does not move with the market; it moves with its own story.
Opportunities and risks at a glance
What speaks for Dollar General:
- Demand was never the problem: revenue rose without interruption from $37.8 billion (fiscal 2022) to $42.7 billion (fiscal 2025), same-store sales up 3.0 percent most recently and 2.0 percent in the first quarter of fiscal 2026, with customer traffic up 1.4 percent.
- The earnings turn is documented, not asserted: net income $1,512.3 million (fiscal 2025) after $1,125.3 million, gross margin up 107 basis points to 30.7 percent, and a further 65 basis points to 31.62 percent in the first quarter of fiscal 2026.
- The balance sheet is healing under its own power: operating cash flow $3,634.5 million (fiscal 2025) after $2,391.8 million (fiscal 2023), equity $8,512.0 million after $7,413.7 million a year earlier, $1.7 billion of long-term obligations repaid in fiscal 2025 alone, net interest expense down from $326.8 million to $230.6 million.
- No survival risk in the metrics: Altman Z-score 4.87, Piotroski F-score 7 of 9, equity ratio 27.9 percent, and a $2.375 billion revolving facility entirely undrawn as of January 30, 2026 (data cut-off July 26, 2026).
- Structural tailwind for the format: about 80 percent of the 20,959 stores sit in towns of 20,000 people or fewer — there Dollar General is often the nearest full assortment, not the cheapest of many alternatives.
What speaks against it:
- The earnings jump has a single, finite driver: $294.6 million of the $524.8 million pre-tax increase (56 percent) comes from lower shrink; in the first quarter of fiscal 2026 that decline had already shrunk to $22.9 million.
- The margin is structurally thin: 3.6 percent net margin, 5.9 percent operating margin, 82 percent of sales in the lowest-margin category — against Walmart, Dollar Tree and Family Dollar, at least one of which has far greater purchasing power.
- The financing side carries scars: covenants loosened from March 11, 2025, buybacks prohibited through January 30, 2026, and a Moody's downgrade from Baa2 to Baa3 — the lowest investment-grade notch, with interest margins contractually tied to the rating on $4.6 billion of debt.
- New cost lines push back in 2026: "significantly higher fuel costs" with an explicitly open end, an expired employment tax credit (effective tax rate 24.9 percent in the quarter versus 23.4 percent), and unresolved tariff questions after the Supreme Court ruling of February 20, 2026.
- Capital returns on a low flame: three fiscal years without a single share repurchase, a quarterly dividend unchanged at $0.59 for years, and $1.38 billion of authorization left untouched even after the ban lapsed. Plus the warning shot from the fourth quarter of fiscal 2024: $214.2 million of impairment charges, mostly on pOpshelf locations.
A human conclusion
Back to the one-off trap. Its core is not that Dollar General is pretending — quite the opposite: the company writes into its own filings where the earnings came from, names shrink as the driver, and warns in the same breath about this year's fuel costs. Read the filings and you are not deceived. Its core is that our minds read a jump as speed when it was a one-time clean-up.
What actually happened fits into one sentence: a company with stable demand stopped losing a third of its shrink and thereby earned a third more. That is very good news — and news that cannot repeat at this size. From here the turnaround has to come from the slow things: more non-consumables in the basket, 4,730 remodels a year, a store manager who stays instead of quitting. That is grinding work without a headline.
So the honest question is not "is the turnaround here?" but: do you trust a discounter with a 3.6 percent net margin to walk the second half of the road without a one-off — while fuel, taxes and tariffs push the other way? If yes, you have a thesis, and the numbers support it. If no, you had a headline. What you do with that is your decision. And that is exactly how it should be.
Sources
Every primary document used in this analysis — for you to read yourself:
- Dollar General Corporation — SEC annual report 10-K for fiscal 2025 (52 weeks ended January 30, 2026, filed March 20, 2026)
- Dollar General Corporation — SEC annual report 10-K for fiscal 2024 (filed March 21, 2025)
- Dollar General Corporation — SEC quarterly report 10-Q for the period ended May 1, 2026 (filed June 2, 2026) — most recent periodic report
- Dollar General Corporation — SEC quarterly report 10-Q for the period ended October 31, 2025 (filed December 4, 2025)
- Dollar General Corporation — SEC current report 8-K dated June 2, 2026 (quarterly results, annual meeting votes, dividend declared June 1, 2026)
- Complete SEC filing history for Dollar General Corporation: EDGAR overview (sec.gov)
- Screener and metric data: our in-house stock scanner (data cut-off July 26, 2026), including the Turnaround Candidates scanner (U.S. selection, rank 24 of 60, turnaround check 6 of 8, measured July 26, 2026) — the lists are recalculated daily.
- Metrics, price history and analyst estimates from fundamental data (data cut-off July 26, 2026), reconciled with the SEC filings.
Transparency & disclaimer: This analysis is a journalistic contextualization of publicly available information and is not investment advice, not a financial analysis in the regulatory sense, and not a solicitation to buy or sell securities. Stock investments carry substantial risks up to total loss. All information without warranty; the data cut-off is noted in the text. The author holds no position in Dollar General shares at the time of publication.
Our Bottom Line at a Glance
- Demand & business model positive
- Revenue rose without interruption from $37.8 billion (fiscal 2022) to $42.7 billion (fiscal 2025), with same-store sales up 3.0 percent most recently after 1.4 percent. The quarter ended May 1, 2026 added another 2.0 percent, carried by 1.4 percent more customer traffic. With 20,959 stores, about 80 percent of them in towns of 20,000 people or fewer, the company is often the nearest place to shop in its markets.
- Earnings turn positive
- Net income turned from $1,125.3 million (fiscal 2024) to $1,512.3 million (fiscal 2025), with the gross margin up 107 basis points to 30.7 percent. In the quarter ended May 1, 2026 it added another 65 basis points to 31.62 percent, operating profit rose 10.8 percent to $638.5 million and diluted earnings per share 12.4 percent to $2.00.
- Source of the earnings jump negative
- Pre-tax income rose $524.8 million in fiscal 2025. Of that, $294.6 million (56 percent) came from shrink falling from $928.9 million to $634.3 million and another $43.8 million (8 percent) from lower interest expense. In the quarter ended May 1, 2026 the shrink decline was down to $22.9 million ($153.2 million after $176.1 million) — the lever is fading.
- Balance sheet & financing neutral
- Operating cash flow rose from $2,391.8 million (fiscal 2023) to $3,634.5 million (fiscal 2025), equity from $7,413.7 million to $8,512.0 million, and $1.7 billion of long-term obligations was repaid in fiscal 2025 alone; total debt stood at $4.6 billion as of January 30, 2026. At the same time the credit covenants had to be loosened on March 11, 2025 through January 30, 2026, with a buyback ban in force, and Moody's cut the rating in 2025 from Baa2 to Baa3 — the lowest investment-grade notch.
- Cost lines in 2026 negative
- The quarterly report for the period ended May 1, 2026 cites "significantly higher fuel costs" and expects the trend to continue "for an uncertain duration"; selling, general and administrative expenses rose 25 basis points in the quarter to 25.70 percent of net sales. Add the Work Opportunity Tax Credit that expired for hires after December 31, 2025 (effective tax rate 24.9 percent in the quarter versus 23.4 percent) and unresolved tariff questions after the Supreme Court ruling of February 20, 2026.
- Valuation & capital returns neutral
- Roughly $25.5 billion of market value (220,586,647 shares, price $117.20 on July 26, 2026) equates to a price-to-earnings ratio near 17 and a price-to-sales ratio of 0.6 — at a 3.6 percent net margin the latter is no bargain signal. Of 31 analysts the average price target is $130.90, with 18 of them on hold. There have been no buybacks since fiscal 2023, and the dividend is unchanged at $0.59 per quarter.
Dollar General has left the bottom behind: after two years of falling profits, fiscal 2025 net income rose from $1,125.3 million to $1,512.3 million, the gross margin by 107 basis points to 30.7 percent and operating cash flow to $3,634.5 million — on revenue that never fell. The uncomfortable half: 56 percent of the pre-tax increase came from a single line, shrink, which dropped from $928.9 million to $634.3 million and contributed only $22.9 million in the quarter ended May 1, 2026. Working against it are "significantly higher fuel costs" with an open end, an expired tax credit and unresolved tariff questions. The financing is solid but scarred: covenants loosened from March 11, 2025, a Moody's rating of Baa3 since 2025, three years without a buyback. Not investment advice.
What Our Rating Means
Open questions
The business works in principle, but one material question is open. As long as it stays open, our findings do not carry a quality verdict.
The business demonstrably works: revenue has not fallen in any of the last five fiscal years, operating cash flow reached $3,634.5 million in fiscal 2025, equity grew to $8,512.0 million, the Altman Z-score stands at 4.87 and the Piotroski F-score at 7 of 9. Nothing supports red: no going-concern doubt, positive and growing equity, $230.6 million of interest expense against $2,203.7 million of operating profit, and an undrawn $2.375 billion credit facility. Green is out of reach because the operating question is too large and too open: 56 percent of the fiscal 2025 pre-tax increase came from lower shrink, which had already flattened to $22.9 million in the quarter ended May 1, 2026, while the filing reports "significantly higher fuel costs" of uncertain duration. A turnaround whose second half is still ahead is yellow — even when the balance sheet can carry it. The decision is yours.
A journalistic assessment by our editorial team at the time of the deep dive, based on public sources — not investment advice and not a solicitation to buy or sell. Your personal circumstances (investment goals, risk capacity, taxes) cannot be taken into account. What our levels mean, how verdicts are formed, and what conflicts of interest exist →
Worth Noting
- Hook: our in-house stock scanner "Turnaround Candidates" — rank 24 of 60 U.S. hits, turnaround check 6 of 8, measured on the live list on July 26, 2026. The lists are recalculated daily; rank and score are a dated snapshot, not a permanent state. 6 of 8 is also the display floor.
- The scanner's two mandatory pillars: at least 50 percent below the all-time high and an Altman Z-score of at least 1.1. Pillar 2 is comfortably met at 4.87; pillar 1 only narrowly, with a stored distance of −51.0 percent (dividend-adjusted, data cut-off July 26, 2026). If the price rises above roughly $120 (from $117.20 on July 26, 2026), pillar 1 breaks and the stock leaves the list without anything changing in the business. The average analyst price target of $130.90 sits above that threshold.
- Plausibility check on the all-time-high figure: the stored value of −51.0 percent was recomputed against our own price history. Unadjusted closing prices give −55.0 percent (highest close $260.44 on October 28, 2022 against $117.23 on July 24, 2026); dividend-adjusted prices give −51.6 percent. All measures sit in the same corridor — there is no misplaced all-time high here.
- No takeover situation: as of July 26, 2026 the SEC filing history contains neither a solicitation/recommendation statement (SC 14D9) nor a merger document. The tender offer documents (SC TO-T) from 2014/2015 belong to the company's own, ultimately failed bid for Family Dollar. The 2026 proxy-related materials concern shareholder proposals that were rejected on May 28, 2026.
- The fiscal year ends on the Friday nearest to January 31: fiscal 2025 = 52 weeks ended January 30, 2026. The most recent periodic report is the 10-Q for the period ended May 1, 2026 (filed June 2, 2026); after that, as of the July 26, 2026 data cut-off, only the current report 8-K of the same day and routine insider filings were on file.
- Price figures are dated valuation anchors, not buy arguments: price $117.20 (data cut-off July 26, 2026), closing price $117.23 on July 24, 2026, 52-week high $156.24 (February 27, 2026), 52-week low $95.94 (November 6, 2025). Cross-check on market value: 220,586,647 shares per the cover page of May 29, 2026 times $117.23 gives $25.86 billion — matching the value from fundamental data. A further anchor sits in the annual report itself: $21.1 billion of non-affiliate market value as of August 1, 2025 at a closing price of $108.53.
- Risk of confusion: Dollar General Corporation (DG) is not Dollar Tree, Inc. (DLTR) and not the Dollar Tree subsidiary Family Dollar — both are named as competitors in the annual report. The ticker DG stands for other companies on other exchanges; the reference here is the NYSE listing under CIK 0000029534.
Frequently Asked Questions
Dollar General Corporation (NYSE: DG), headquartered in Goodlettsville, Tennessee, is the largest U.S. discount retailer by store count: 20,959 stores across 48 states and Mexico as of February 27, 2026, with roughly 194,000 employees. An average store carries about 7,500 square feet of selling space, and about 80 percent sit in towns of 20,000 people or fewer. Just over 82 percent of net sales come from consumables such as food, paper products and health and beauty items.
Because a single cost line collapsed. Shrink included in cost of goods sold — theft, loss and spoilage — fell from $928.9 million (fiscal 2024) to $634.3 million (fiscal 2025), from 2.29 percent to 1.48 percent of net sales. Pre-tax income rose by $524.8 million; $294.6 million of that, or 56 percent, came from this line alone, plus another $43.8 million from lower interest expense. Net income climbed from $1,125.3 million to $1,512.3 million.
Dollar General uses a 52- to 53-week fiscal year ending on the Friday nearest to January 31. Fiscal 2025 covered 52 weeks and ended on January 30, 2026 — so it maps largely onto calendar year 2025. The current fiscal 2026 ends on January 29, 2027. The first quarter of fiscal 2026 covered the 13 weeks ended May 1, 2026.
The metrics say yes: Altman Z-score 4.87, Piotroski F-score 7 of 9, equity ratio 27.9 percent (data cut-off July 26, 2026). As of January 30, 2026, $4.6 billion of debt stood against $3,634.5 million of annual operating cash flow, and the $2.375 billion revolving facility was undrawn. One caveat remains: on March 11, 2025 the credit covenants had to be loosened, and Moody's cut the rating in 2025 from Baa2 to Baa3 — the lowest investment-grade notch.
The scanner requires two mandatory pillars: at least 50 percent below the all-time high and an Altman Z-score of at least 1.1. Dollar General clears both — comfortably on pillar 2 at 4.87, but only narrowly on pillar 1 at −51.0 percent (data cut-off July 26, 2026). If the price rises above roughly $120, the stock drops out of the list without anything changing in the business. The turnaround check reads 6 of 8 points — exactly the display floor. The lists are recalculated daily.
The quarterly dividend has been unchanged at $0.59 per share; the board most recently declared it on June 1, 2026. In fiscal 2025 that cost $519.5 million, the dividend yield is around 2.0 percent and the payout ratio 33.4 percent (data cut-off July 26, 2026). There were no share repurchases in fiscal 2023, 2024 or 2025 — and none in the first quarter of fiscal 2026 either, even though roughly $1.38 billion of authorization remains available.
No. As of July 26, 2026 the SEC filing history contains neither a solicitation/recommendation statement (SC 14D9) nor a merger document. The tender offer and soliciting materials from 2014 and 2015 stem from the company's own — ultimately failed — bid for Family Dollar. The most recent proxy-related materials concern shareholder proposals, including one on a human rights policy; both proposals were rejected on May 28, 2026.
That the engine stalls. The decline in shrink was $294.6 million in fiscal 2025 but only $22.9 million in the first quarter of fiscal 2026. At the same time the quarterly report cites "significantly higher fuel costs" with an open end, the Work Opportunity Tax Credit has expired for hires from 2026 onward, and the tariff question is unresolved after the Supreme Court ruling of February 20, 2026. At a 3.6 percent net margin, each of those lines carries weight.
Found an error?
Did you spot a factual error, an outdated number, or a typo in this deep dive? Let us know briefly — your report goes straight to the editorial team.