CCC Intelligent Solutions: $254 Million in Cash, $1.7 Million in Profit
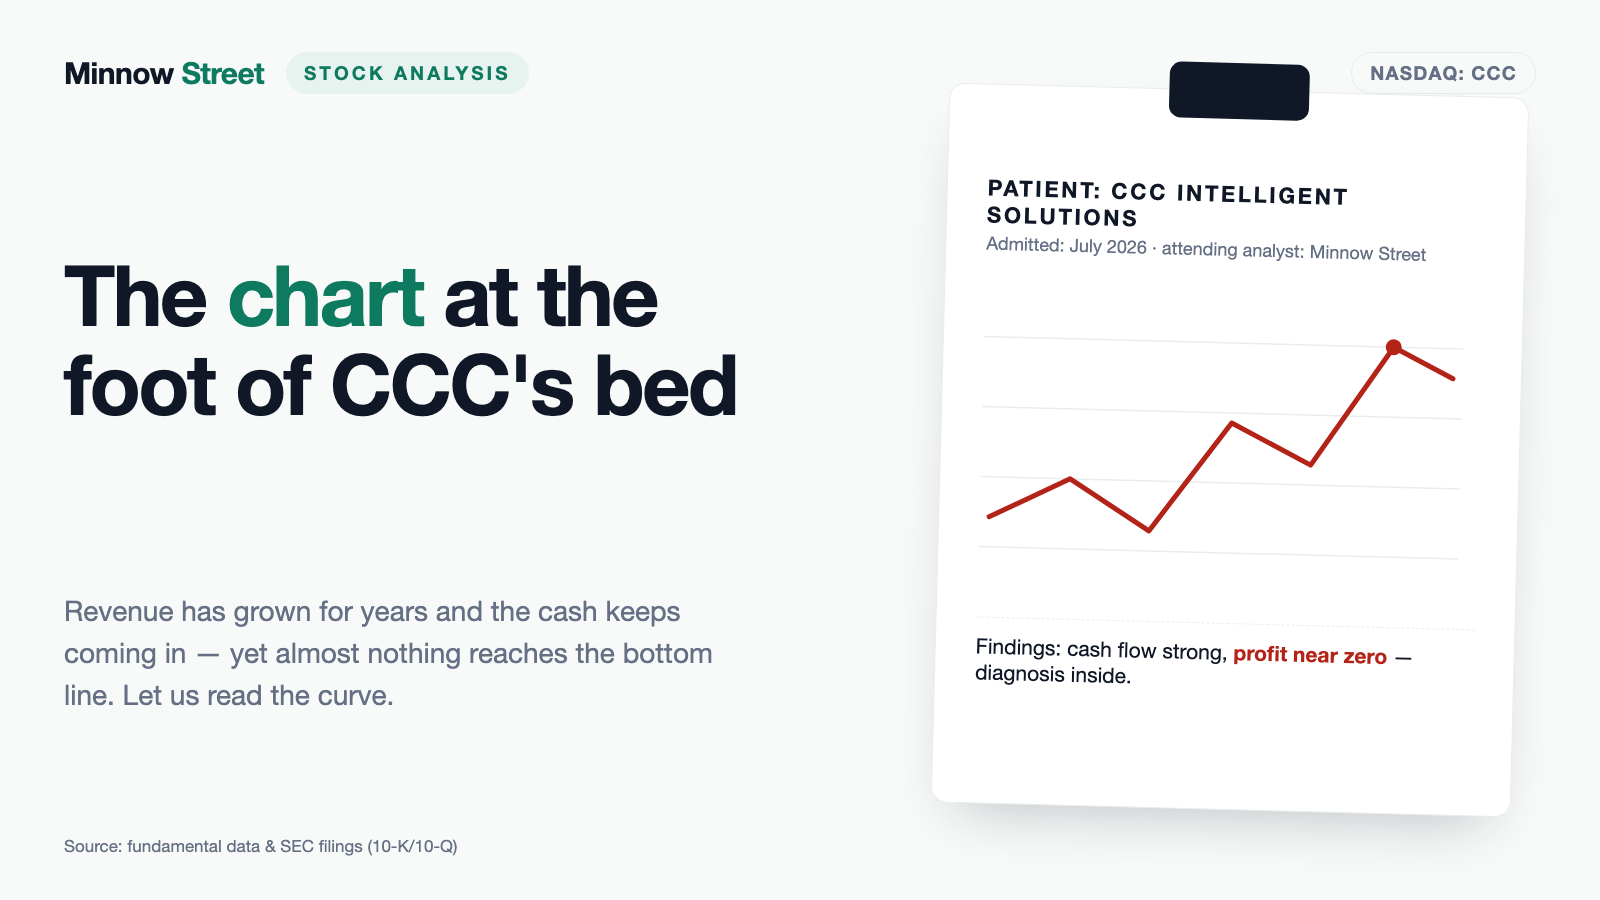
27 of the 30 largest U.S. auto insurers run their collision claims through CCC's software. In 2025 revenue rose 11.9 percent to $1,057.0 million and free cash flow reached $254.5 million — and the bottom line showed $1.7 million. In between sit $175.4 million of stock-based compensation, $600 million of buybacks charged straight against the accumulated deficit, and $1,955.6 million of goodwill. We read the 2025 annual report and the March 31, 2026 quarterly report to find out who actually collects this company's earnings. What you get at the end is not advice but a stack of numbers you have to weigh yourself.
 Thomas Mücke
Founder & Publisher
Thomas Mücke
Founder & Publisher
Chart
Interactive price chart (TradingView).
Note: pure fact-based analysis, not investment advice and not a solicitation to buy or sell. All figures without guarantee.
There is a thinking trap every one of us knows from a shop window: the discount tag. A price crossed out, a smaller one beside it. Your head instantly computes the difference and calls it savings. What it never checks is the crossed-out price itself. At CCC Intelligent Solutions Holdings Inc. (NASDAQ: CCC) the number on that tag is unusually large: the stock trades roughly 60 percent below its all-time high. Except that high was set on January 25, 2021 — six months before CCC was listed at all. Back then the security was an empty shell company holding cash in trust and a promise.
So let us make a deal. Before we talk about the discount, we read together what the company itself filed with the U.S. securities regulator, the SEC: the annual report (10-K) for 2025, filed February 24, 2026, and the quarterly report (10-Q) for March 31, 2026, filed April 30, 2026. Those documents are honest under penalty of law. And they describe a business that earns money with remarkable reliability, a profit line that still sits near zero, and $600 million that in 2025 went past shareholders straight into the accumulated deficit.
What this analysis covers
- What CCC actually does — the software between a dented fender and an insurer
- Where the stock landed on our desk
- The numbers over the years — what genuinely impresses
- What the filings say — five uncomfortable truths
- Valuation — what the market pays for $254 million of cash flow
- Opportunities and risks at a glance
- A human conclusion
- Sources
What CCC actually does — the software between a dented fender and an insurer
Picture somebody rear-ending you. What follows looks to you like paperwork and phone calls. In the background, five parties exchange data: your insurer, the body shop, the parts supplier, the appraiser and the carmaker with its repair procedures. That exchange is what CCC sells, as cloud software on subscription. The company sits in Chicago, says it was founded in 1980, and as of December 31, 2025 employed roughly 2,185 people plus 568 contingent workers — 2,105 in the United States and 80 abroad.
The numbers behind it are bigger than the name suggests. More than 35,000 businesses are connected to the platform. According to the annual report the network processes more than 600 million interface transactions a year — every time information passes from one participant to the next, say from an insurer to a repair facility. And CCC says it has processed more than $2 trillion of historical data over its life, which feeds its estimating and review models.
How does it earn from that? Almost entirely on subscription. Of $1,057.0 million in 2025 revenue, $1,013.9 million came from software subscriptions and only $43.1 million from services — 95.9 percent recurring. Contracts typically run three to five years. And customers stay: gross dollar retention, the share of prior-year revenue still coming from customers who remain, stood at 98 to 99 percent in every single quarter of 2023, 2024 and 2025. Net dollar retention, the same measure including expansion within the existing base, ran at 105 to 108 percent. In plain terms: of every hundred revenue dollars from last year, 98 to 99 come back — and those who stay buy another five to eight percent on top.
There is a rare property alongside that: no single customer accounted for more than 10 percent of revenue in 2023, 2024 or 2025, even though 27 of the 30 largest U.S. auto insurers by direct written premium are customers. Concentration shows up only in receivables, where one customer represented roughly 11 percent of the balance as of December 31, 2025, as it did a year earlier.
That frames the central tension of this analysis, and it runs through every chapter that follows: the business is about as predictable as a business gets — and almost nothing arrives at the bottom of the income statement. The question is not whether CCC makes money. The question is who receives it.
Where the stock landed on our desk
We run roughly 3,200 stocks through our scanners every day. CCC reached the research list through our in-house turnaround candidates scanner — and we will say straight away how far down. On July 27, 2026 the U.S. selection held 60 hits. Exactly one of them scored 8 of 8 points on the turnaround checklist, 15 scored 7, and 44 scored 6 — CCC among them. The detail page shows only the 25 strongest hits. CCC is not on it. With that many ties we claim no exact rank: CCC sits in the group covering places 17 through 60. Our German sister site showed an identical distribution the same day. These lists are recomputed daily — any placement is a dated snapshot.
So why write about the stock at all? Because the research turned up something that has little to do with the checklist. First, though, the mechanics, so you can follow them yourself: open the scanner, set the country filter to U.S., sort by the turnaround column.
The model has two mandatory pillars. Fail either one and a stock drops out immediately:
- Pillar 1 — the crash: the stock must trade at least 50 percent below its all-time high. No crash, no turnaround.
- Pillar 2 — survival: the Altman Z-score (an early-warning measure for insolvency built from several balance-sheet ratios) must exceed 1.1, equity must be positive and no more than one balance-sheet warning flag may be present. Plus tradability: price above $3, daily dollar volume above $2 million.
Only then does the turnaround checklist apply: eight points, four from the quarterly numbers and four from market behavior. CCC takes all four operating points — first-quarter 2026 revenue 11.8 percent above the prior-year quarter, net margin of 5.5 percent against 5.0 percent three quarters earlier and 2.9 percent in the previous quarter, positive operating cash flow, and interest coverage improving from 1.33 to 2.65. Of the four market points it takes two: price above the 50-day line and net institutional accumulation of $135 million. Missing are turning relative strength (three months weaker than twelve) and net insider buying — over the past twelve months there were zero purchases against two sales.
And now the part we will not bury: two of the three metrics that put CCC on this list do not survive a check against the audited statements. We recomputed them because our own recipe demands it, and we quote our own figures rather than the stored ones.
First, the distance from the all-time high. Our data set carries minus 69.46 percent. The price history over 1,457 trading days since October 5, 2020 does not support that: the highest close is $14.70 on January 25, 2021, the highest intraday print $16.11 on February 3, 2021. Against the July 24, 2026 close of $5.82 those are minus 60.4 percent and minus 63.9 percent respectively. The mandatory threshold of minus 50 percent is cleared on any reading, so pillar 1 holds — but the stored value cannot be reconstructed from the prices. Something else matters more: both highs date from January and February 2021. The business combination did not close until July 30, 2021. What is measured here as an all-time high is the price of a shell company at the peak of the 2021 blank-check boom, not a peak of the operating business. The highest close after the combination is $13.35, set September 29, 2023.
Second, the Altman Z-score. The stored value is 2.92. Recompute the original formula with the audited 2025 statements and a market value of $3,416 million and you get 0.90 — below the scanner threshold of 1.1. The arithmetic in plain terms: 1.2 times 0.0283 (working capital to total assets) plus 1.4 times minus 0.4743 (retained earnings to total assets) plus 3.3 times 0.0263 (operating income to total assets) plus 0.6 times 1.9056 (market value to liabilities) plus 1.0 times 0.2958 (revenue to total assets). The outlier is the second term: an accumulated deficit of $1,695.1 million pulls the formula down by 0.66 points on its own. In fairness: the formula was designed for manufacturers and punishes exactly the two things an acquisition-financed software company inevitably carries — a deficit from the past and little revenue per balance-sheet dollar. It says little about solvency here, since 2025 operating cash flow was $315.5 million against $71.0 million of interest expense and the contractual leverage ratio stayed below its 3.5 threshold. A ratio is only as good as the balance sheet it was built for.
Third, the Piotroski score, a nine-point checklist for balance-sheet quality. The stored value is 7 of 9. Using the audited 2025 figures against 2024 we arrive at 4 of 9. Passing: positive profit, positive operating cash flow, cash flow above profit, and a reduced share count. Failing: return on assets (0.05 percent against 0.98), leverage (35.4 percent of total assets against 23.9), current ratio (1.43 against 3.65), gross margin (73.5 percent against 75.6) and asset turnover (0.296 against 0.297). Four of nine is no catastrophe — but it is not the balance sheet a 7 implies. We ran into a comparable gap between stored and computed figures earlier in this series, in our analysis of Rocket Companies.
One last data point we will not hide: the scanner row carries a market value for CCC of $2.604 billion. But 586,940,536 shares (cover page of the quarterly report, April 28, 2026) at $5.82 produce $3.42 billion. Everything below uses the recomputed figure.
The numbers over the years — what genuinely impresses
Start with what honestly impresses: this business grows without zigzags. Revenue climbed from $866.4 million (2023) to $944.8 million (2024) to $1,057.0 million (2025), up 11.9 percent in the last year. CCC breaks down where the increase came from: 5 percentage points from existing customers buying more, 4 points from the EvolutionIQ acquisition, and 3 points from new customers. The first quarter of 2026 continued at $281.3 million against $251.6 million, up 11.8 percent.
Cash flow is more impressive still. Operating cash flow rose from $250.0 million (2023) to $283.9 million (2024) to $315.5 million (2025). Subtract purchases of software, equipment and property ($61.0 million in 2025) and free cash flow comes to $254.5 million — after $230.9 million and $195.0 million in the two prior years. That is the kind of series you want to see.
Except a second series sits right beside it, at almost the same magnitude:
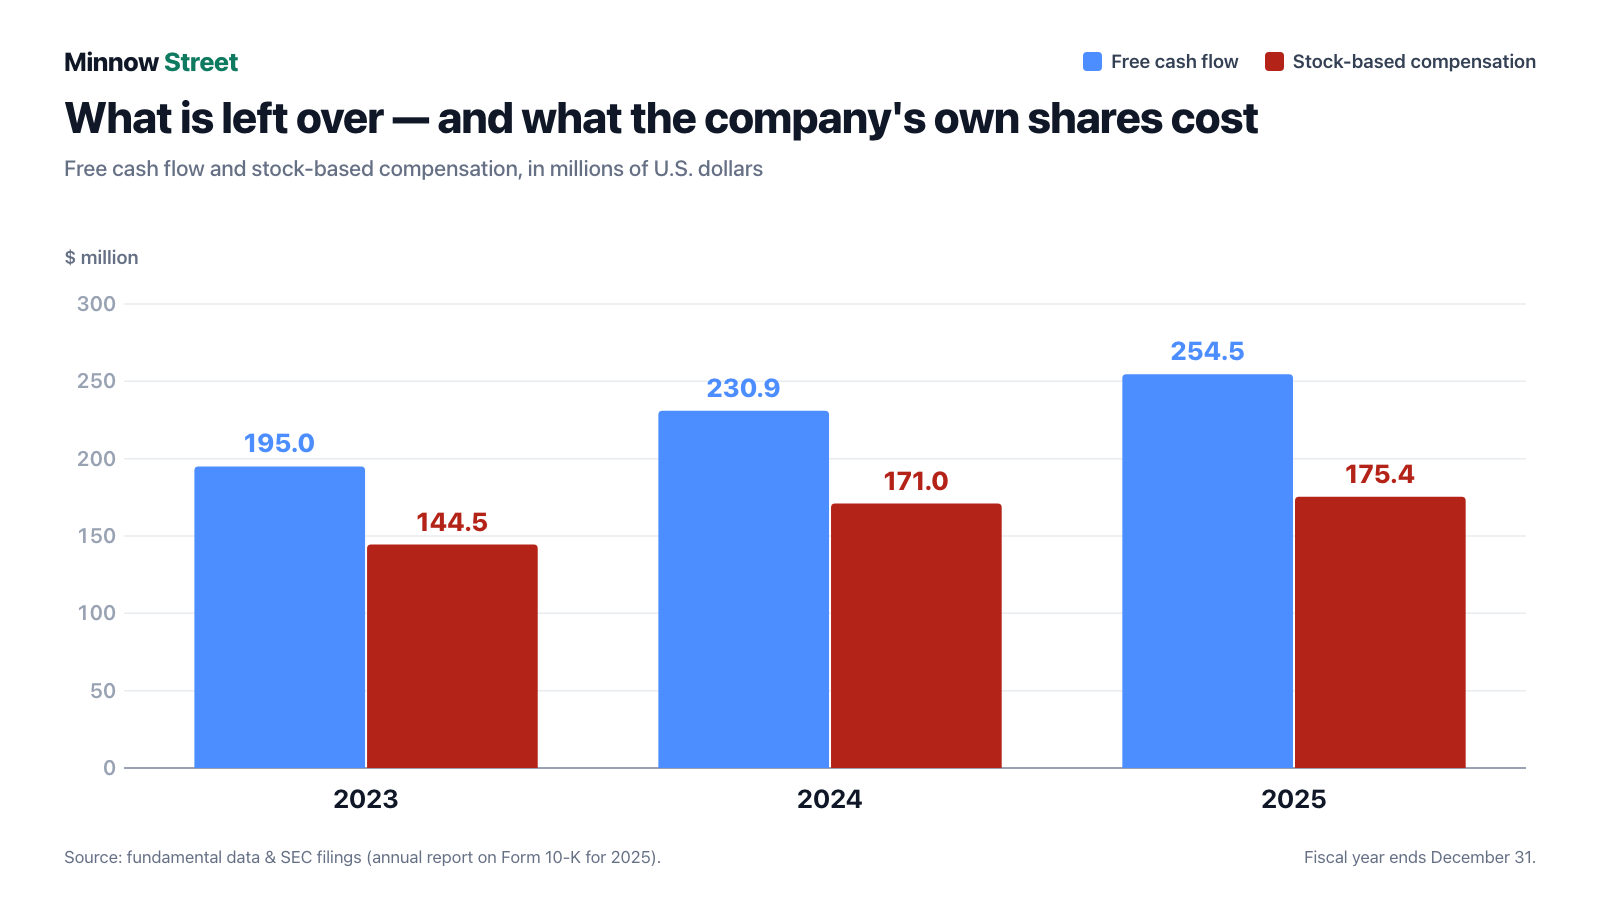
Stock-based compensation reached $175.4 million in 2025 — 68.9 percent of free cash flow. In 2023 it was $144.5 million against $195.0 million of cash flow (74.1 percent), in 2024 $171.0 million against $230.9 million (74.1 percent). The gap is widening, but slowly is the right word.
And profit? That series reads: minus $90.1 million (2023), plus $31.2 million (2024), plus $1.7 million (2025). The first quarter of 2026 delivered $15.4 million of profit after an $18.7 million loss a year earlier — the turn the scanner is measuring. It does not come from revenue alone: research and development fell year over year from $61.8 million to $52.5 million, selling and marketing from $48.3 million to $39.4 million, general and administrative from $67.1 million to $49.6 million. A good part of that is lower stock compensation, since the prior-year quarter still carried the one-off charges from the EvolutionIQ deal.
The company prefers to measure itself by adjusted EBITDA — earnings before interest, taxes, depreciation, amortization, stock compensation, acquisition costs and several other items. That came to $436.0 million in 2025, up 9.7 percent, a margin of 41.2 percent. For 2026 CCC guided (as of April 30, 2026) to revenue of $1,155 million to $1,163 million and adjusted EBITDA of $484 million to $490 million. One caveat worth holding on to: that measure excludes the $175 million of stock compensation. It is useful for tracking operations. It is not what reaches you.
What the filings say — five uncomfortable truths
No. 1: The profit is a rounding error — and the cash register is still right
$1.7 million of profit on $1,057.0 million of revenue is a net margin of 0.16 percent. In the same year $254.5 million flowed in freely. Both numbers are true. The path from one to the other is the actual story:
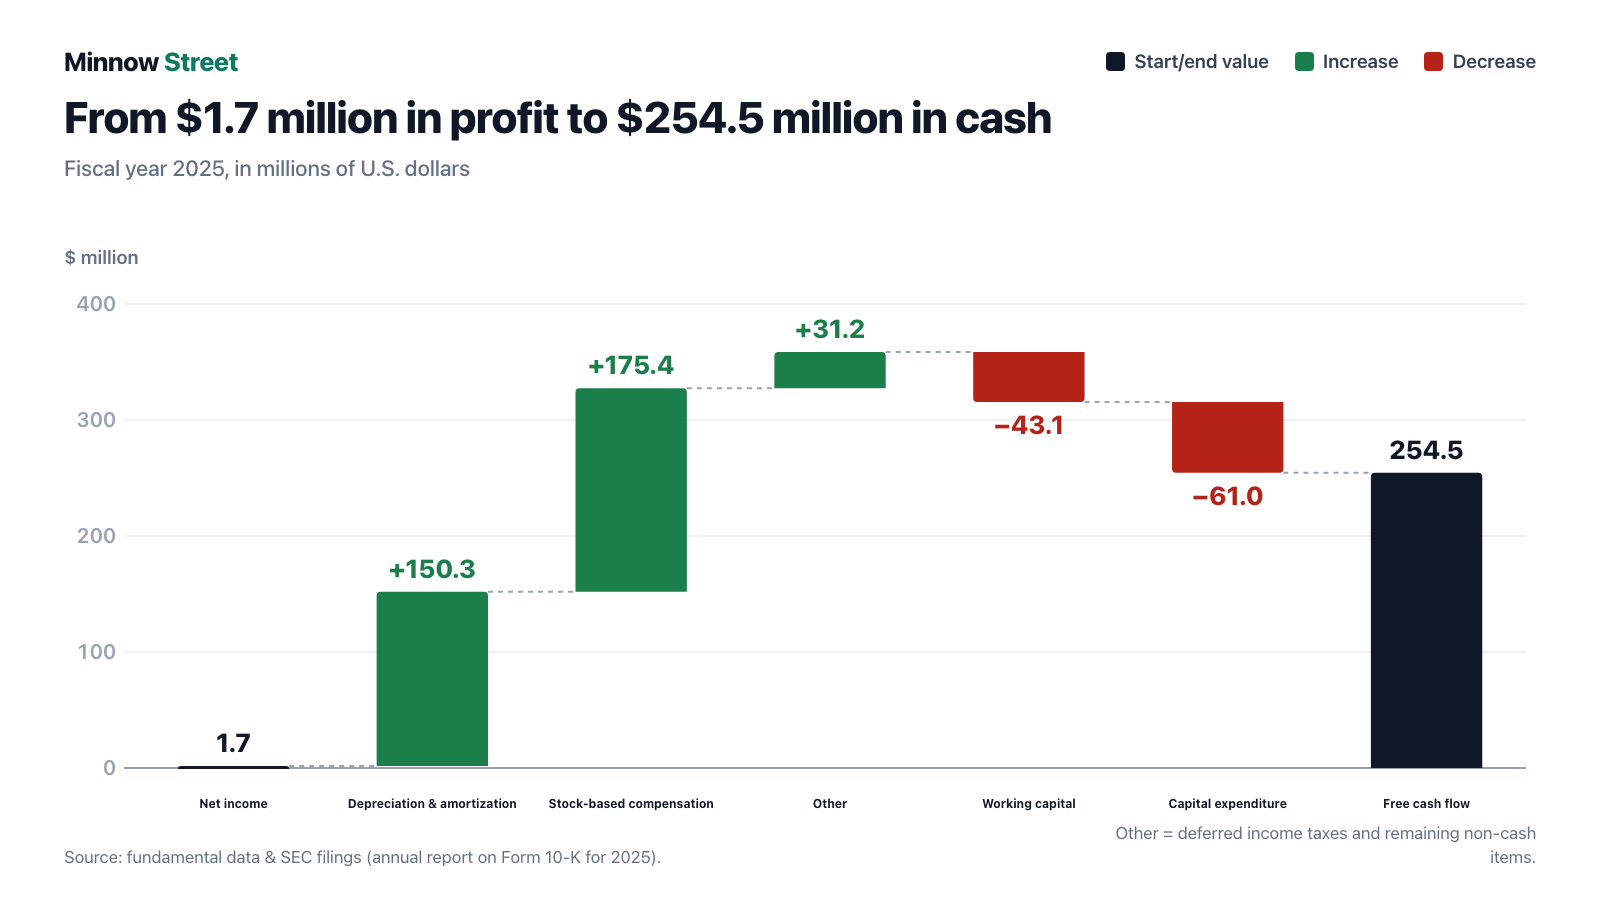
You get from $1.7 million of profit to $254.5 million of cash flow by adding back $150.3 million of depreciation and amortization (of which $91.5 million is amortization of intangibles from older acquisitions), $175.4 million of stock compensation and $31.2 million of deferred taxes and other non-cash items, then subtracting $43.1 million tied up in working capital and $61.0 million of capital expenditure. By far the largest building block is compensation.
How large that item really is appears in a single paragraph of the March 31, 2026 quarterly report:
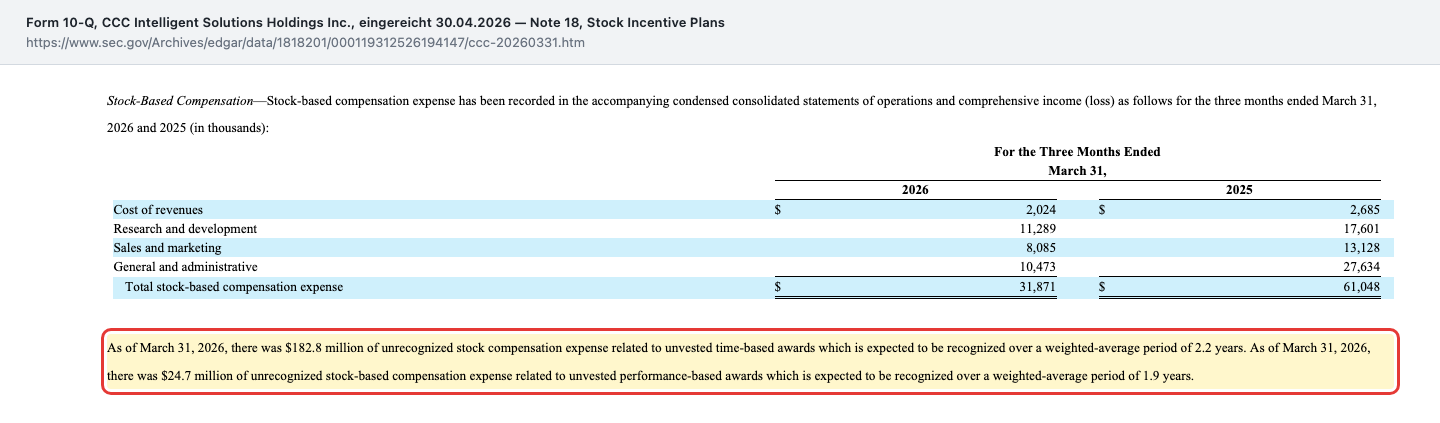
As of March 31, 2026, $182.8 million of time-based and another $24.7 million of performance-based awards had not yet been expensed — $207.5 million in total, spread over roughly the next two years. That is about 6 percent of the market value. The good news sits in the same table: first-quarter 2026 expense fell to $31.9 million from $61.0 million a year earlier. If that is not a one-off, the ratio shifts noticeably.
An everyday picture for it: imagine a bakery that pays its staff not in cash but in slices of the bakery. The till is full at close of business — no money went out. It is just that the bakery is a little less yours the next morning. That is what the income statement measures, and exactly what free cash flow leaves out.
No. 2: $600 million of buybacks, booked past the income statement
In 2025 CCC repurchased $600.0 million of its own stock: 32,229,693 shares for $300.0 million under the December 2024 program, plus an accelerated repurchase of another $300.0 million from December 12, 2025. None of it appears in the income statement. The notes explain why: the purchase price above par value is charged directly to the accumulated deficit. Which is how the deficit grew during 2025 from $1,095.2 million to $1,695.1 million — in a year that ended in profit. By March 31, 2026, after a further $100.0 million of buybacks in March, it stood at $1,780.3 million.
None of that is improper, or even unusual. What is interesting is where the money came from:

"Pursuant to the terms of the Fifth Amendment, the Company incurred incremental term loans in an aggregate principal amount of $300.0 million, which were used to fund the 2025 Accelerated Share Repurchase (“ASR”) program (Note 17)."
— CCC Intelligent Solutions Holdings Inc., SEC quarterly report 10-Q for March 31, 2026, Note 16
So the buyback was not paid out of free cash flow but half out of a loan increase. The traces sit in the balance sheet: cash fell from $399.0 million (end of 2024) to $111.2 million (end of 2025) to $36.9 million as of March 31, 2026. The term loan rose to $1,287.7 million, maturing January 23, 2032, at a weighted-average rate of 5.8 percent in the first quarter of 2026. The buyback did its job: the share count fell from 629,207,115 (end of 2024) to 605,449,050 (end of 2025) to 586,940,536 as of April 28, 2026. The accelerated program settled on February 27, 2026 with a final delivery of 9,606,474 shares; in total 42,847,472 shares came back at an average price of $7.00. As of March 31, 2026, $100.0 million of authorization remained.
No. 3: 85 percent of the balance sheet is memory of old acquisitions
As of March 31, 2026 CCC carried total assets of $3,470.8 million. Of that, $1,955.6 million was goodwill and $987.8 million other intangibles — $2,943.3 million together, or 84.8 percent. Goodwill is the amount a buyer paid above the fair value of the individual assets acquired; it arises on purchase and cannot be sold.
Deduct both from equity of $1,721.2 million and you are left with tangible book value of minus $1,222.2 million. That is not an alarm signal — for software companies with an acquisition history it is the norm, and the equity ratio of 49.6 percent looks solid on paper. But it means that what is reported as equity consists almost entirely of purchase prices from the past. Write the goodwill down and the equity goes with it. CCC has demonstrated that this can happen: in 2023 it wrote off the entire goodwill of its China unit — $77.4 million, computed with a weighted average cost of capital of 12.5 percent. The impairment test as of November 30, 2025 found no write-down needed for either remaining unit.
No. 4: The most expensive acquisition delivered 4 percent of revenue and an $89 million loss
On January 6, 2025 CCC acquired EvolutionIQ for $674.3 million — $420.6 million in cash, $250.4 million in its own shares (26,035,603 shares at a volume-weighted average price of $11.83) and $3.2 million for held-back options. EvolutionIQ provides AI-powered guidance for disability and injury claims management. Only $167.9 million of the purchase price was allocated to identifiable assets; $537.8 million became goodwill — 80 percent of the price.
What the deal delivered in its first year appears in the notes to the annual report:
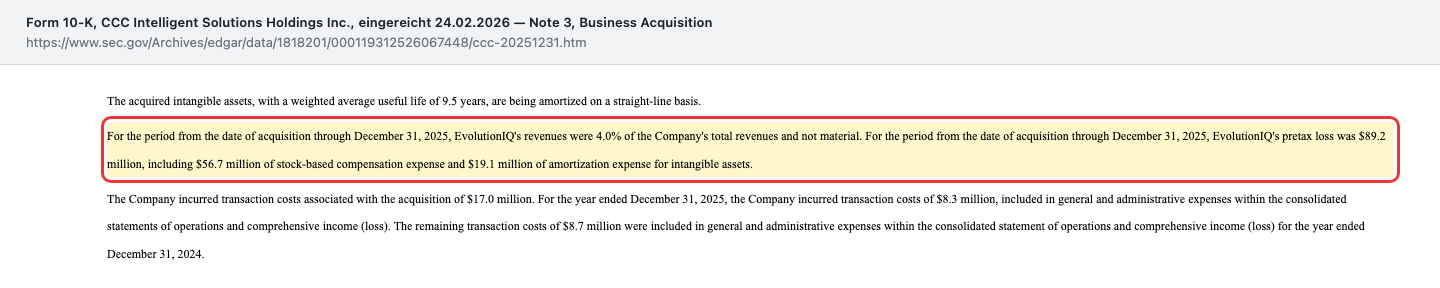
"For the period from the date of acquisition through December 31, 2025, EvolutionIQ's revenues were 4.0% of the Company's total revenues and not material. For the period from the date of acquisition through December 31, 2025, EvolutionIQ's pretax loss was $89.2 million, including $56.7 million of stock-based compensation expense and $19.1 million of amortization expense for intangible assets."
— CCC Intelligent Solutions Holdings Inc., SEC annual report 10-K for 2025, Note 3
Work out what that means for the consolidated numbers: without EvolutionIQ, CCC would have reported considerably more than $1.7 million of profit in 2025 — and roughly 8 percent revenue growth instead of 11.9 percent. The two effects belong together and must not be read separately. In fairness: an acquisition that costs money in its first year is normal, and part of the $56.7 million of stock compensation inside it is retention pay for the acquired team that runs off on schedule. Of the 10,356,096 restricted shares issued in the deal, $23.7 million of expense remained unrecognized as of December 31, 2025, spread over roughly one year. The question is not whether the deal cost money up front. The question is whether 4 percent of revenue ever justifies $537.8 million of goodwill.
No. 5: The shell company is still on the books
Back to the discount tag. CCC did not reach the market through a conventional initial public offering but through a merger with a blank-check company — Dragoneer Growth Opportunities Corp., incorporated in the Cayman Islands on July 3, 2020 as a special purpose acquisition company, a SPAC. The agreement with the then CCC parent, Cypress Holdings Inc., is dated February 2, 2021 and closed on July 30, 2021. The SEC entity record still lists Dragoneer as a former name.
Three remnants of that structure are still in the filings:
- 8,625,000 sponsor shares. They belong to the Dragoneer side, are non-transferable, and are forfeited on the tenth anniversary of closing — July 30, 2031 — unless the stock trades at or above $13.00 on twenty of thirty consecutive trading days, or a change of control occurs.
- 15.0 million earnout shares for the former owners, issuable at $15.00 under the same conditions. They have not been issued and therefore do not appear in the share count.
- The warrants. They carried an exercise price of $11.50 and were redeemed in May 2024 for 3,809,200 shares. Until then their fair value swung through earnings: plus $14.4 million in 2024, minus $15.1 million in 2023.
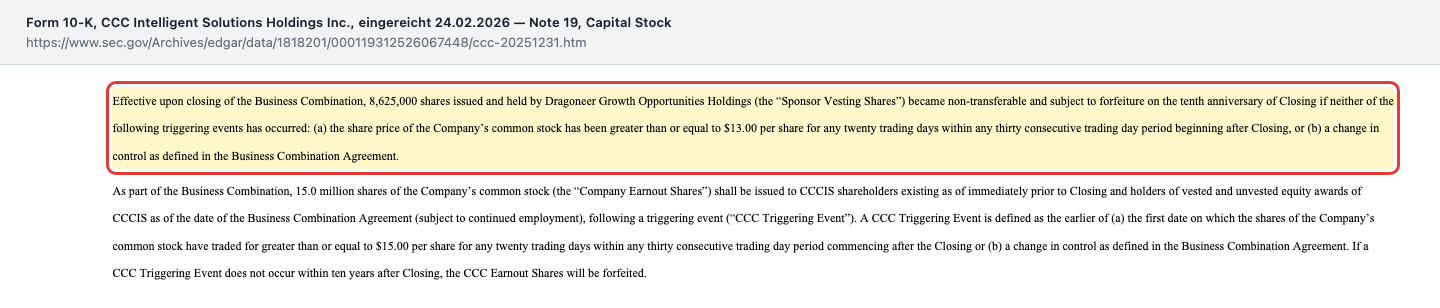
"Effective upon closing of the Business Combination, 8,625,000 shares issued and held by Dragoneer Growth Opportunities Holdings (the “Sponsor Vesting Shares”) became non-transferable and subject to forfeiture on the tenth anniversary of Closing if neither of the following triggering events has occurred: (a) the share price of the Company's common stock has been greater than or equal to $13.00 per share for any twenty trading days within any thirty consecutive trading day period beginning after Closing, or (b) a change in control as defined in the Business Combination Agreement."
— CCC Intelligent Solutions Holdings Inc., SEC annual report 10-K for 2025, Note 19
Those thresholds are the market's quiet verdict on the share price. At $5.82 (July 24, 2026) the sponsor shares are 123 percent away from their $13.00 trigger and the earnout shares 158 percent from $15.00. Both packages are effectively worthless unless something changes.
The second part of the SPAC legacy was the exit wave of the original owners. Over three years existing holders sold 69.9 million shares (2023), 171.5 million (2024) and 109.3 million (2025) through secondary offerings — proceeds that went entirely to the sellers and never reached the company. In all three years CCC repurchased its own shares alongside; in March 2025, for instance, 7,000,000 shares for $72.3 million directly in connection with such an offering. You may read that generously as an orderly transition into public float. You may also ask who carried the price risk during that transition.
Valuation — what the market pays for $254 million of cash flow
Before the arithmetic: these are dated anchors, not buy arguments. Price $5.82 (close of July 24, 2026), 586,940,536 shares (quarterly report cover page, April 28, 2026) — a market value of roughly $3.42 billion. Add financial debt of $1,287.7 million and the $26.0 million note payable to the China minority investor, subtract $36.9 million of cash, and enterprise value comes to about $4.69 billion.
From there the orders of magnitude: on trailing four-quarter revenue of $1,086.7 million the price-to-sales ratio is roughly 3.1; on free cash flow of $254.5 million the price-to-free-cash-flow ratio is roughly 13.4. Enterprise value equals 10.8 times adjusted EBITDA of $436.0 million. Building a price-to-earnings ratio on reported profit would be nonsense — $1.7 million produces a four-digit number. On the average 2026 earnings estimate of $0.44 per share the multiple works out at roughly 13.
For a subscription business with 96 percent recurring revenue, 98 to 99 percent gross retention and a 41 percent adjusted margin, that is not expensive — it is roughly what a solid but slow-growing software house fetches. The market is pricing neither growth fantasy nor collapse, but a company whose 11 percent growth is believed and whose profit turn is not yet.
The professional view: as of July 27, 2026 there are 13 analyst estimates — six strong buy, three buy, three hold, one sell; the average price target is $8.80, roughly 51 percent above the July 24, 2026 close. Consensus figures like that are a mood reading, not a forecast, and they are routinely marked down when a share price falls. For a comparable software business carrying heavy stock compensation and heavy goodwill, see our analysis of Twilio.
A word on leverage, because it is the real brake on this stock: net debt of roughly $1,276.8 million as of March 31, 2026, or 2.9 times adjusted EBITDA. Interest expense was $71.0 million in 2025, covered just 1.3 times by operating income of $93.8 million; in the first quarter of 2026 that improved to 2.4 times ($48.8 million against $20.3 million). The loan runs to January 23, 2032, quarterly amortization is a modest $3.3 million, and a $250 million revolving facility sits alongside. There is no refinancing pressure for years — but any further billion of buybacks now goes either into debt or against cash flow.
Opportunities and risks at a glance
What speaks for CCC:
- The network as a moat. More than 35,000 connected businesses, 27 of the 30 largest U.S. auto insurers, more than 600 million interface transactions a year. An insurer does not swap out a system like that casually — the annual report puts average customer relationships at more than ten years.
- Predictable revenue. 95.9 percent subscription share, gross retention of 98 to 99 percent in every quarter since 2023, net retention of 105 to 108 percent, no customer above 10 percent of revenue.
- The cash is real. Free cash flow of $195.0 million, then $230.9 million, then $254.5 million over three years; adjusted EBITDA of $436.0 million at a 41.2 percent margin.
- The compensation burden is visibly shrinking. $31.9 million in the first quarter of 2026 against $61.0 million a year earlier — if that holds, the rounding error at the bottom line quickly turns into a real number.
- Buybacks are working. The share count fell from 629.2 million to 586.9 million in sixteen months, down 6.7 percent.
What speaks against it:
- Reported profit does not carry the cash flow. $1.7 million of profit against $175.4 million of stock compensation; another $207.5 million had not been expensed as of March 31, 2026.
- The balance sheet is 84.8 percent goodwill and intangibles, with tangible book value at minus $1,222.2 million. An impairment like the 2023 China write-off ($77.4 million) hits equity directly.
- Debt for buybacks. $300.0 million of fresh borrowing purely for the accelerated repurchase, cash down from $399.0 million to $36.9 million, net debt at 2.9 times adjusted EBITDA.
- The most expensive acquisition still has to prove itself. $674.3 million for EvolutionIQ, $537.8 million of it goodwill, against a 4.0 percent revenue contribution and an $89.2 million pretax loss in year one.
- The finance chief is gone. Brian Herb announced his resignation on April 27, 2026, effective May 25, 2026; the former chief accounting officer has run the role on an interim basis since, and no successor had been named as of our data date.
- Growth in a market that can shrink. CCC itself notes in its risk factors that better driver-assistance systems and autonomous vehicles may reduce the number of accidents and therefore the number of claims — the very base of its own business.
A human conclusion
Back to the discount tag. The crossed-out price of $14.70 comes from a time when the stock, in its present form, did not exist. Anyone treating the gap as a discount is buying a memory of the 2021 blank-check boom. That is not an argument against the stock — it is simply not an argument for it.
What remains afterwards is a very solid business with one unresolved problem. CCC earns money reliably: $254.5 million flowed in freely during 2025, and customers stay with a loyalty most software houses only dream about. That money simply does not reach the owners yet. It goes into three pots instead: to employees in the form of shares, to the sellers of EvolutionIQ, and into servicing debt taken on to buy back stock. That is what this stock hangs on — not whether the business works, but when profit catches up with cash flow.
The first quarter of 2026 is the first hint that it might: $15.4 million of profit, stock compensation almost halved, interest coverage doubled. Three months prove nothing. But they mark the place to look in the next quarterly report — and you now know three numbers to measure against: $31.9 million of stock compensation, 586,940,536 shares, and an accumulated deficit of $1,780.3 million.
What you make of that is your decision. And that is exactly as it should be.
Sources
- SEC annual report 10-K for 2025, CCC Intelligent Solutions Holdings Inc., filed February 24, 2026 (CIK 0001818201)
- SEC quarterly report 10-Q for March 31, 2026, filed April 30, 2026
- SEC quarterly report 10-Q for September 30, 2025, filed October 30, 2025 (still under the ticker CCCS)
- SEC annual report 10-K for 2024, filed February 25, 2025
- SEC current report 8-K of April 30, 2026, Exhibit 99.1 (Item 2.02: quarterly results and 2026 outlook)
- SEC current report 8-K of April 30, 2026 (Item 5.02: CFO resignation effective May 25, 2026)
- SEC amended current report 8-K/A of May 29, 2026 (Item 5.02: interim CFO arrangement)
- Fundamental data (ratios, price, analyst and valuation data; as of July 27, 2026, last trading day July 24, 2026)
- Our in-house stock scanner "turnaround candidates", U.S. selection, measured July 27, 2026 on both brands
This analysis is journalistic commentary and expressly not investment advice, not a recommendation to buy or sell, and not a solicitation to buy or sell securities. All figures come from the original sources listed above and carry the dates stated; numbers change with every new filing. Stocks can fluctuate substantially and a total loss of invested capital is possible. The author holds no position in the security discussed at the time of publication.
Our Bottom Line at a Glance
- Market position & retention positive
- More than 35,000 connected businesses and 27 of the 30 largest U.S. auto insurers use the platform (as of December 31, 2025). Gross dollar retention ran at 98 to 99 percent in every single quarter from 2023 through 2025, net dollar retention at 105 to 108 percent. 95.9 percent of 2025 revenue was subscription based, and no customer accounted for more than 10 percent.
- Cash generation positive
- Free cash flow rose from $195.0 million (2023) to $230.9 million (2024) to $254.5 million (2025), with operating cash flow reaching $315.5 million. Adjusted EBITDA came to $436.0 million in 2025, a margin of 41.2 percent. On April 30, 2026 the company guided to $484 million to $490 million for 2026.
- Earnings quality negative
- Net income for 2025 was $1.7 million on $1,057.0 million of revenue — a net margin of 0.16 percent. The largest item between profit and cash flow is stock-based compensation of $175.4 million, equal to 68.9 percent of free cash flow. As of March 31, 2026 another $207.5 million of such awards had not been expensed.
- Balance sheet substance negative
- As of March 31, 2026, 84.8 percent of total assets of $3,470.8 million consisted of goodwill ($1,955.6 million) and other intangibles ($987.8 million). Deduct both from equity of $1,721.2 million and tangible book value is minus $1,222.2 million. The 49.6 percent equity ratio therefore measures almost nothing but historical purchase prices.
- Capital allocation neutral
- The buybacks work: the share count fell from 629,207,115 (December 31, 2024) to 586,940,536 (April 28, 2026). They cost $600.0 million in 2025, $300.0 million of it funded by a loan increase dated December 12, 2025. Cash fell over the same period from $399.0 million to $36.9 million and net debt stands at 2.9 times adjusted EBITDA.
- EvolutionIQ acquisition neutral
- Acquired January 6, 2025 for $674.3 million, of which $537.8 million was booked as goodwill. In the stub year 2025 the unit contributed 4.0 percent of consolidated revenue and produced a pretax loss of $89.2 million, including $56.7 million of stock-based compensation. The impairment test as of November 30, 2025 required no write-down.
CCC Intelligent Solutions runs the software U.S. auto insurers use to settle collision claims — with gross retention of 98 to 99 percent per quarter since 2023 and 95.9 percent recurring revenue. The business grows reliably: $1,057.0 million of revenue in 2025 after $866.4 million in 2023, free cash flow of $254.5 million after $195.0 million. Reported profit does not keep pace: $1.7 million in 2025, because $175.4 million of stock compensation, $150.3 million of depreciation and amortization and $71.0 million of interest sit in between. Add a balance sheet that is 84.8 percent goodwill and intangibles, and $600.0 million of buybacks half funded by a new loan and charged straight against the accumulated deficit. The first quarter of 2026, with $15.4 million of profit and stock compensation almost halved, shows this can turn — one quarter does not prove it. Not investment advice.
What Our Rating Means
Open questions
The business works in principle, but one material question is open. As long as it stays open, our findings do not carry a quality verdict.
This light rates the company, not the share price. No documented substance finding is present: equity is positive at $1,721.2 million, the equity ratio stands at 49.6 percent, 2025 operating cash flow of $315.5 million covered $71.0 million of interest expense, the contractual leverage ratio stays below its 3.5 threshold, and there is no going-concern doubt and no listing risk. What is open is the decisive operating question, and it is open twice over. First, reported profit does not carry the cash flow: $1.7 million of net income against $175.4 million of stock-based compensation, with a further $207.5 million unrecognized as of March 31, 2026 — the burden is real, it simply reaches owners through ownership rather than through cash. Second, the EvolutionIQ acquisition is unproven: $674.3 million of purchase price, $537.8 million of it goodwill, against a 4.0 percent revenue contribution and an $89.2 million pretax loss in year one. Add a balance sheet that is 84.8 percent goodwill and intangibles, and a chief financial officer position filled only on an interim basis since May 25, 2026. Expressly excluded from this color are price, valuation, float and volatility. The stored scanner ratios are excluded as well: the Altman Z of 2.92 cannot be reproduced from the 2025 statements using the original formula (our own calculation gives 0.90), and that formula is not a quality verdict for an acquisition-financed software company in any case. The decision is yours.
A journalistic assessment by our editorial team at the time of the deep dive, based on public sources — not investment advice and not a solicitation to buy or sell. Your personal circumstances (investment goals, risk capacity, taxes) cannot be taken into account. What our levels mean, how verdicts are formed, and what conflicts of interest exist →
Worth Noting
- CCC reached the research list through our in-house stock scanner "turnaround candidates" (U.S. selection), measured July 27, 2026 on both brands. Both instances showed the same distribution: 60 U.S. hits, of which 1 scored 8 of 8 points, 15 scored 7 and 44 scored 6. CCC scores 6 and therefore sits in the tie group covering places 17 through 60; no exact rank is claimed. The detail page shows only the 25 strongest hits — CCC is not visible there. These lists are recomputed daily.
- Turnaround checklist in detail (quarterly series from the second quarter of 2025 through the first quarter of 2026): pillar 3 fully met — revenue in the latest quarter 11.8 percent above the prior-year quarter, net margin of 5.5 percent against 5.0 percent three quarters earlier and 2.9 percent in the previous quarter, positive operating cash flow, interest coverage improving from 1.33 to 2.65. Pillar 4 half met: price above the 50-day line and net institutional accumulation of $135 million yes; turning relative strength and net insider buying no (zero purchases against two sales over twelve months).
- Three scanner ratios were checked against the audited statements; where they diverge, this analysis uses the recomputed value. Distance from the all-time high: stored at minus 69.46 percent, recomputed from 1,457 trading days since October 5, 2020 at minus 60.4 percent (highest close $14.70 on January 25, 2021) or minus 63.9 percent (highest intraday print $16.11 on February 3, 2021) — the mandatory minus 50 percent threshold holds on any reading. Piotroski: stored at 7, recomputed from the audited 2025 figures against 2024 at 4 of 9. Altman-Z: stored at 2.92, recomputed with the original formula, the 2025 statements and a market value of $3,416 million at 0.90 — below the scanner threshold of 1.1.
- Not to be confused: both of the stock's record highs date from January and February 2021 and therefore predate the closing of the business combination on July 30, 2021. The "distance from the all-time high" measures the deflation of a shell-company price here, not the collapse of the operating business. The highest close after closing is $13.35 (September 29, 2023). Also easy to mix up: the ticker was CCCS through the quarterly report filed October 30, 2025 and has been CCC since.
- Price and valuation figures are dated anchors, not buy arguments: closing price $5.82 on July 24, 2026, ratio data as of July 27, 2026. The market value of roughly $3.42 billion is computed from 586,940,536 shares (quarterly report cover page, April 28, 2026). The scanner row carries $2.604 billion from an older pull — the gap is a data-vintage difference, and this analysis uses the recomputed figure.
- The most recent periodic report is the quarterly report 10-Q for March 31, 2026 (filed April 30, 2026). Filed after that, through the data date of July 27, 2026: current report 8-K of April 30, 2026 (Item 2.02, quarterly results and 2026 outlook), current report 8-K of April 30, 2026 (Item 5.02, CFO resignation effective May 25, 2026), current report 8-K of May 22, 2026 (Item 5.07, annual meeting results), amendment 8-K/A of May 29, 2026 (Item 5.02, interim arrangement), plus ownership filings (Schedule 13G) and insider reports (Form 4). The next quarterly report is expected on July 30, 2026 according to the data available.
Frequently Asked Questions
CCC runs cloud subscription software used to settle vehicle damage claims in the United States: insurers, repair shops, carmakers, parts suppliers and appraisers exchange claim data, estimates and repair procedures through it. As of December 31, 2025 more than 35,000 businesses were connected, including 27 of the 30 largest U.S. auto insurers. The network processes more than 600 million interface transactions a year, according to the company.
Because three large items sit between revenue and profit that either cost no cash or reach into the future: $175.4 million of stock-based compensation, $150.3 million of depreciation and amortization (including $91.5 million of amortization on intangibles from older deals) and $71.0 million of interest expense. What remained was $1.7 million of net income on $1,057.0 million of revenue. Free cash flow in the same year was $254.5 million.
The company pays part of its salaries in its own shares rather than cash. That reduces profit but not cash, which is why free cash flow is far higher than net income. It is still paid — out of existing owners' stakes. At CCC that came to $175.4 million in 2025, or 68.9 percent of free cash flow. As of March 31, 2026 another $207.5 million of such awards had not yet been expensed.
The listed entity was. Until July 2021 it was called Dragoneer Growth Opportunities Corp., incorporated in the Cayman Islands on July 3, 2020 as a special purpose acquisition company. The business combination with the CCC parent, Cypress Holdings Inc., closed on July 30, 2021. From that era the filings still carry 8,625,000 sponsor shares with a $13.00 price threshold and 15.0 million earnout shares with a $15.00 threshold.
Because buybacks do not run through the income statement. According to the notes, the purchase price above par value is charged directly to the accumulated deficit. CCC repurchased $600.0 million of its own stock in 2025, so the deficit widened from $1,095.2 million to $1,695.1 million, and after a further $100.0 million of buybacks in March 2026 it reached $1,780.3 million as of March 31, 2026.
The purchase price was $674.3 million (January 6, 2025), of which $420.6 million in cash and $250.4 million in CCC shares. $537.8 million of it was booked as goodwill. In the stub year 2025 EvolutionIQ contributed 4.0 percent of consolidated revenue and produced a pretax loss of $89.2 million, including $56.7 million of stock-based compensation and $19.1 million of amortization.
Because the detail page shows only the 25 strongest hits. On July 27, 2026 the U.S. selection held 60 hits: one with 8 of 8 points, 15 with 7 and 44 with 6. CCC scores 6 and belongs to the large tie group covering places 17 through 60, which puts it below the display cut-off. Both mandatory criteria were met: at least 50 percent below the all-time high, and a stored Altman Z above 1.1 with positive equity.
No. As of July 27, 2026 there is no SC 14D9, no SC 13E3, no pending Form S-4 and no Form 15. The only Form 25 in the company history dates from December 16, 2022 and covered the SPAC-era warrants, which were redeemed in May 2024 for 3,809,200 shares. The stock trades on Nasdaq; the ticker was CCCS until October 2025 and has been CCC since.
Found an error?
Did you spot a factual error, an outdated number, or a typo in this deep dive? Let us know briefly — your report goes straight to the editorial team.