Bread Financial Stock: Two Times Cash Flow — and $1.4 Billion of Charge-Offs That Never Show Up in It
Bread Financial finances the store cards of U.S. retail chains and sits in our price-to-free-cash-flow ranking at 1.95 (data as of July 27, 2026) — on paper one of the cheapest stocks in America. We read the 2025 annual report (10-K), the quarterly report (10-Q) for the period ended March 31, 2026 and the July 23, 2026 earnings release, and worked through the cash flow statement line by line. The result: operating cash flow of $2.1 billion contains $1.2 billion of provision for credit losses added back, while the growth of the loan book sits in an entirely different section. Here is why, at a lender, the very metric that makes it look cheap is the one that misleads.
 Thomas Mücke
Founder & Publisher
Thomas Mücke
Founder & Publisher
Chart
Interactive price chart (TradingView).
Note: pure fact-based analysis, not investment advice and not a solicitation to buy or sell. All figures without guarantee.
There is a shortcut that regularly costs investors money: taking a single number as a verdict. It is seductive because it saves work — and because it is sometimes even right. Bread Financial Holdings, Inc. (NYSE: BFH) sits in our price-to-free-cash-flow ranking at 1.95 as of July 27, 2026. Translated: the entire company costs less on the stock market than twice what it generates in free cash in a single year. If that were true, you would earn back the purchase price in two years.
Before the shortcut takes over, let us make a deal: we read the cash flow statement from the 2025 annual report (10-K) together — line by line. Because Bread Financial is not a software house or a factory. It is a lender. And at a lender, the cash flow statement contains something different from what most metrics assume. Remember the sentence everything below turns on: at a lender, cash flow measures the interest margin — the charge-offs are somewhere else.
What is in this analysis
- What Bread Financial actually does
- How the stock reached our desk
- The numbers over the years — credit where it is due
- Uncomfortable truth no. 1: cash flow does not know about charge-offs
- Uncomfortable truth no. 2: three chains, one revenue line — and a bankruptcy
- Uncomfortable truth no. 3: profit grows because reserves shrink
- Uncomfortable truth no. 4: the Altman Z says “bankrupt” — and is the wrong tool here
- What the stock costs
- Opportunities and risks at a glance
- A human conclusion
- Sources
What Bread Financial actually does — the bank behind the store card
When a U.S. jewelry chain asks you at the register whether you would like the store card, the chain itself is almost never behind it. Behind it stands a lender that takes the credit risk, issues the card, lends the money and collects the interest. That is exactly what Bread Financial is: a company from Columbus, Ohio, with roughly 6,000 employees (December 31, 2025) that runs retailers’ card programs through two of its own FDIC-supervised institutions, Comenity Bank and Comenity Capital Bank.
The business has three building blocks. First, retail cards: private label cards that work at one chain only, and co-brand cards accepted everywhere. Second, Bread Pay, pay-over-time at the point of sale. Third, since 2019, a growing direct bank — savings products that fund the company more cheaply than the capital markets. These direct-to-consumer deposits grew from $8.5 billion at the end of 2025 to $9.4 billion as of June 30, 2026 and now make up half of total funding.
The company is older than its name: until March 23, 2022 it was Alliance Data Systems Corporation — a group that ran loyalty programs and marketing services alongside the card business and has since spun off or sold those parts. Anyone looking at old price charts should know this: the highest closing price ever, $309.91, dates from April 23, 2015 — from a company that no longer exists in that form.
Which names the central tension of this analysis, and it runs through every chapter: Bread Financial earns handsomely on its interest margin — but every metric that measures that margin measures it before the charge-offs that the business actually pays.
How the stock reached our desk — and why it is not visible in the list
We run roughly 3,500 stocks through our scanners every day. As of July 27, 2026 Bread Financial meets the condition of the price-to-free-cash-flow ranking: positive free cash flow and a price-to-free-cash-flow ratio of no more than 10. The stored value is 1.95.
And now the honesty, before anyone opens the list and cannot find us: the scanner has 545 hits in the U.S. selection. Sorted by price-to-free-cash-flow — cheapest first — Bread Financial ranks 36th. Only the 25 strongest hits are visible on the scanner page. The stock meets the criteria but does not appear in the displayed list; on the German brand the same scanner additionally covers European names and reaches 836 hits in total, which changes nothing about Bread Financial’s U.S. position.
To reproduce it, the route runs through the screener: there you can filter by price-to-free-cash-flow and narrow by country without the display stopping at 25 rows. The metric is the same; only the visibility cutoff disappears. And as with every one of our lists: they are recomputed daily — a rank today is no promise for tomorrow.
As of the same date Bread Financial also appears in the price-to-earnings ranking, the price-to-cash-flow ranking and the scanner built on James O’Shaughnessy’s trending value approach. All four have one thing in common: they measure price against an earnings or cash figure. None of them checks what sits behind that figure at a lender. That is what we do now.
The numbers over the years — credit where it is due
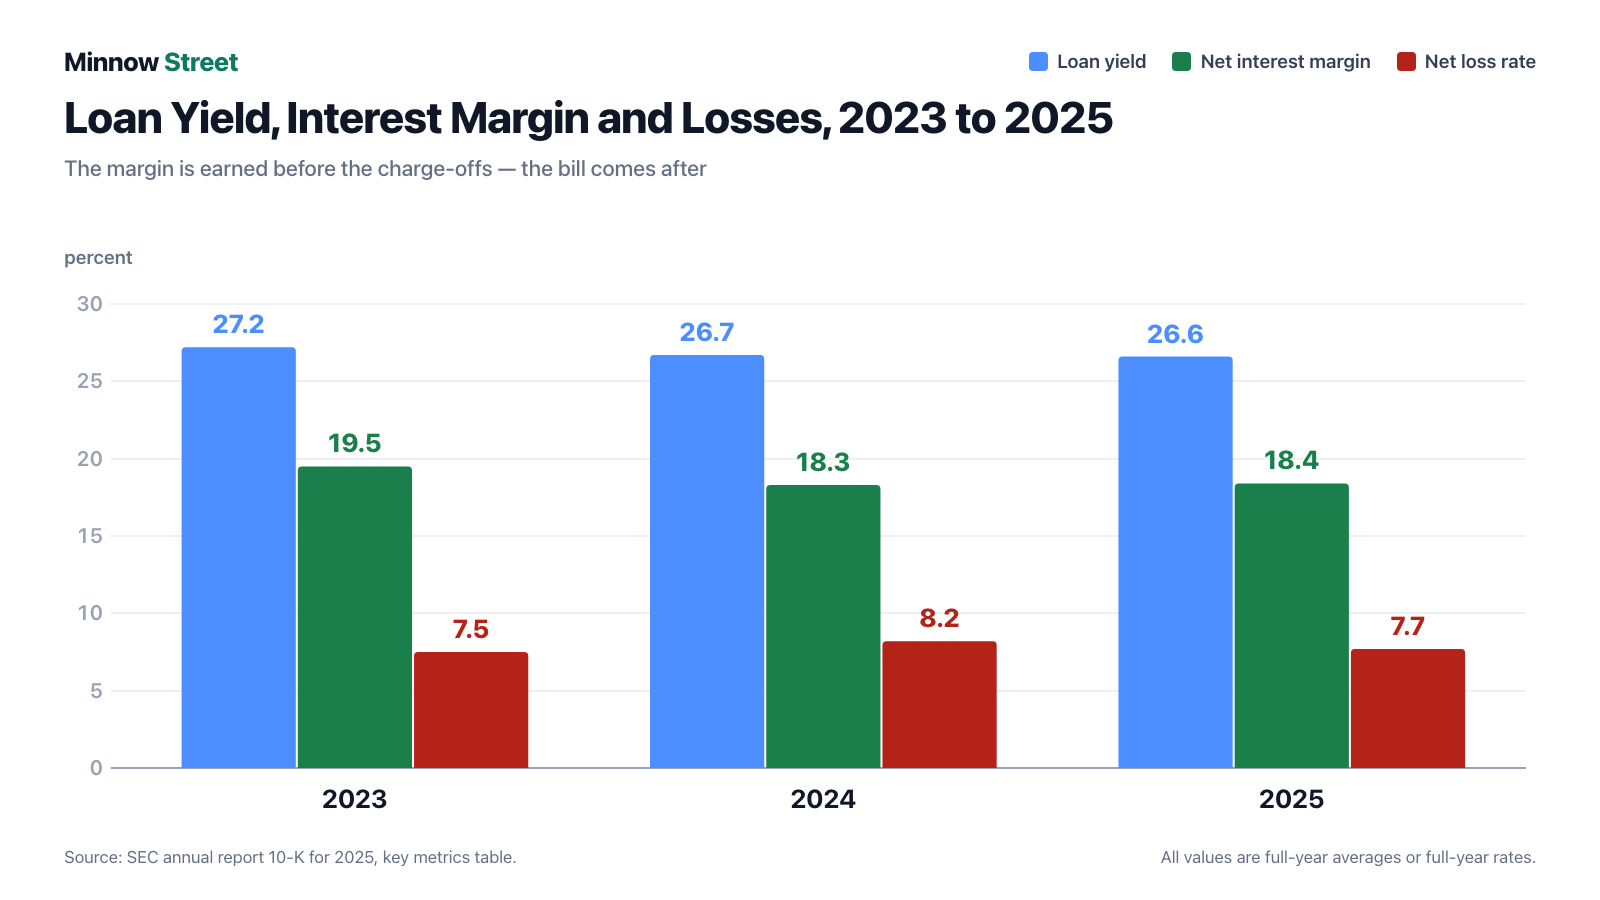
Start with what deserves respect, and there is plenty. Bread Financial earns a return on its loan book that classic banks can only dream of: loan yield was 26.6 percent in 2025 and the net interest margin 18.4 percent. For comparison, an ordinary commercial bank works with net interest margins in the low single digits. Store cards are expensive for the customer — and precisely for that reason lucrative for the lender.
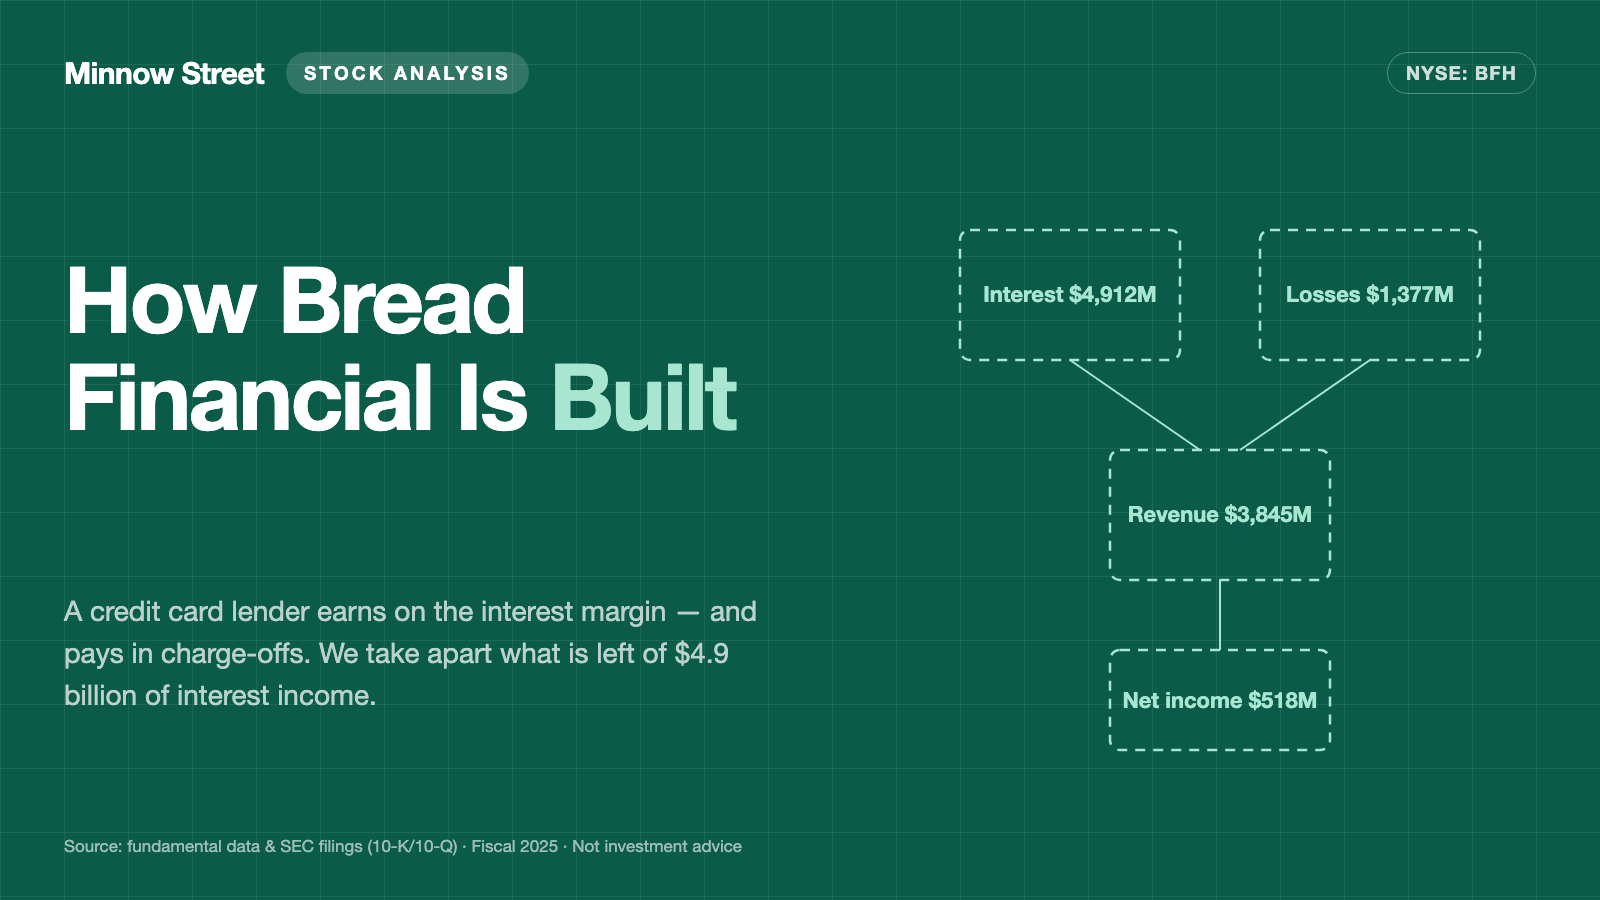
The 2025 income statement as a chain: $4,912 million of interest income less $854 million of interest expense leaves $4,058 million of net interest income. From that, non-interest income is deducted — and at Bread Financial it is negative (minus $213 million), because payments to retail partners under the card programs exceed interchange revenue. What remains is the figure the company itself calls revenue: $3,845 million (2024: $3,838 million; 2023: $4,289 million). After $1,242 million of provision for credit losses and $1,988 million of operating expenses, $614 million is left before taxes and $518 million of net income — after $277 million in 2024.
The capital side has visibly improved too. The CET1 capital ratio rose from 12.2 percent (2023) through 12.4 (2024) to 13.0 percent (2025). That ratio measures hard equity against risk-weighted assets — in plain terms, how much of the company’s own money stands behind every dollar of risk. The regulatory minimum for the banks is 7 percent including the capital conservation buffer. Bread Financial therefore holds almost double. Tangible book value per common share climbed from $43.70 (2023) through $46.97 (2024) to $57.57 (2025) — and on to $63.66 as of June 30, 2026.
Credit quality is genuinely turning for the better. The delinquency rate — the share of loans more than 30 days past due — fell from 6.5 percent (end of 2023) through 5.9 and 5.8 to 5.25 percent as of June 30, 2026. The net loss rate came down from 8.2 percent (2024) to 7.7 (2025) and most recently 6.98 percent. In July 2026 the company cut its full-year guidance for the loss rate from 7.2 to 7.4 percent down to 7.0 to 7.1 percent. For scale, the annual report names the extreme case itself: in the financial crisis, delinquency and net loss rates peaked in 2009 at 6.2 and 10.0 percent.
Now the other side of the same series: the loan book is barely growing. Average loans were $17.85 billion in 2025 — 1 percent below 2024 and 2 percent below 2023. Only in 2026 does it tip slightly positive (second quarter: up 3 percent on average, up 5 percent at period end). And revenue has been stuck between $3.8 and $4.3 billion for three years. What doubled profit in 2025 was not growth — it was lower charge-offs, lower funding costs and a larger reserve release.
Uncomfortable truth no. 1: cash flow does not know about charge-offs
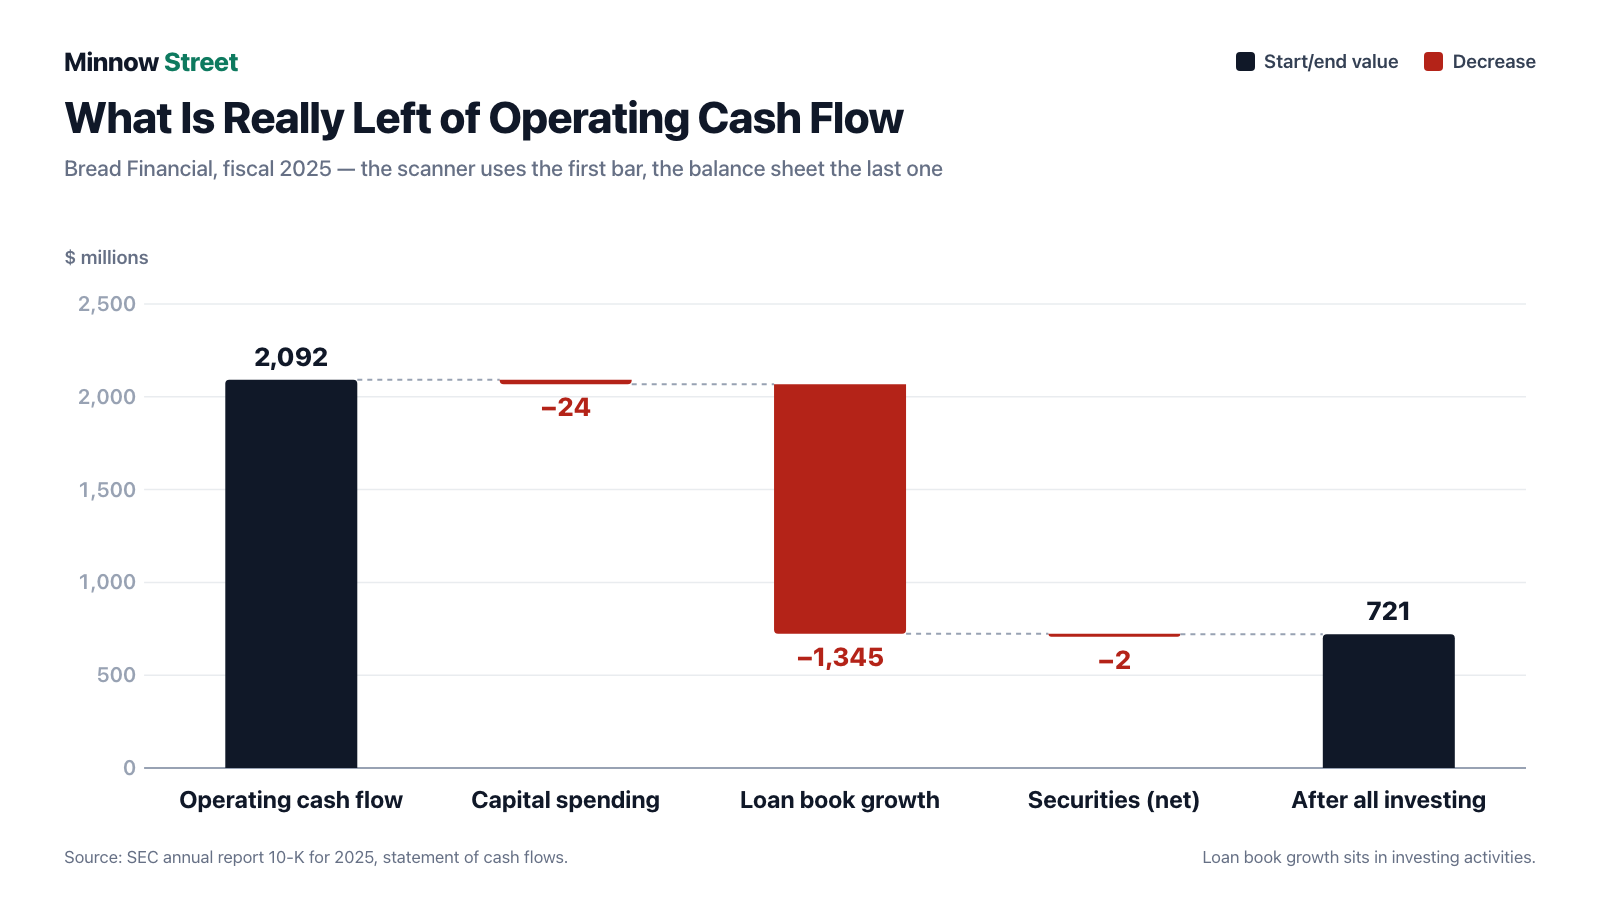
Now to the metric that put this stock on our desk. The 2025 cash flow statement starts with net income of $518 million. Then comes by far the largest adjustment in the whole calculation: plus $1,242 million of provision for credit losses. It is added back because at the moment it is booked it costs no cash — it is an entry against future losses. After a few smaller items, operating cash flow stands at $2,092 million.
That is exactly the number the scanner takes. Less $24 million of capital spending it produces “free cash flow” of $2,068 million — and a price-to-free-cash-flow ratio of around 2. Except: the provision was added back, but the actual charge-offs are real, lost money. The annual report quantifies them:
“Provision for credit losses decreased relative to 2024 driven by a $135 million reserve release and net principal losses of $1.4 billion, compared with a $92 million reserve release and net principal losses of $1.5 billion in the prior year.”
— Bread Financial Holdings, Inc., SEC annual report 10-K for 2025, management’s discussion and analysis (MD&A)
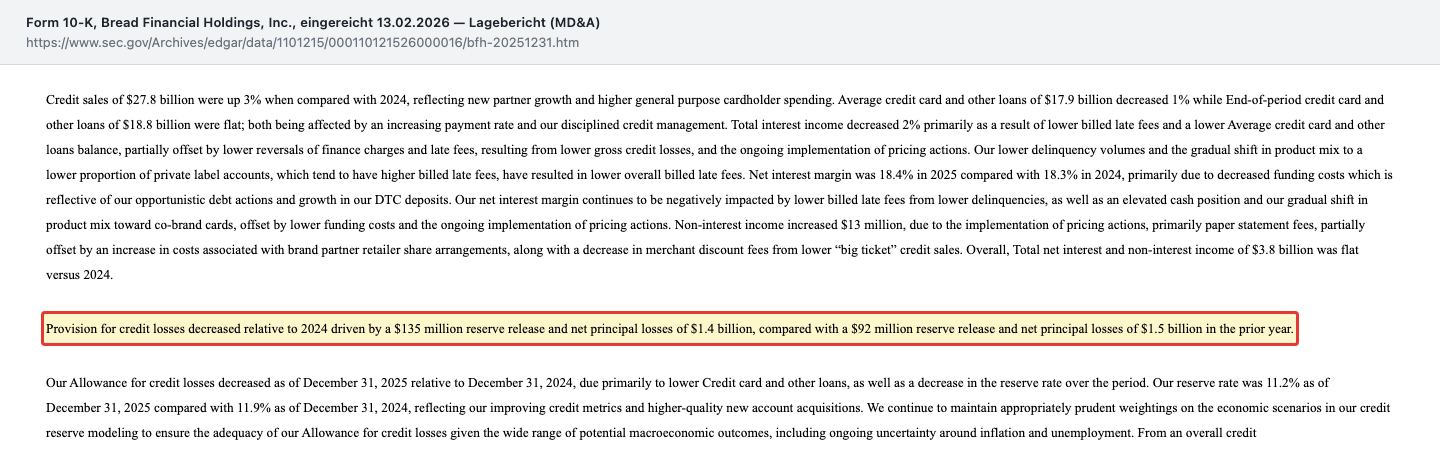
Precisely, net principal losses were $1,377 million (2024: $1,489 million; 2023: $1,365 million). And the second hole in the calculation is larger still: a lender has to fund its loan book. When it writes new loans, cash goes out — but that outflow does not sit in the operating section, it sits in investing activities. For 2025 that line shows minus $1,345 million for the change in the loan book alone, and minus $1,371 million in total.
So let us calculate it honestly, along two independent routes:
- Route 1 — operating and investing together: $2,092 million less $1,371 million equals $721 million. That is the cash left after funding the company’s own business.
- Route 2 — cash flow less the real charge-offs: $2,092 million less $1,377 million equals $715 million.
Two different calculations, six million apart. That is no coincidence but a confirmation: both routes deduct the same reality that the scanner value skips. So instead of $2,068 million it is roughly $720 million — about one third. And what actually reached the owners is in the financing section: $313 million of share repurchases plus $42 million of dividends, together $355 million.
Remember the principle: at banks and lenders, free cash flow is not a metric but an accounting artifact. We worked through the same problem at another lender in this series in detail — in our OneMain Holdings analysis, where the identical mechanism produces a similarly tempting and similarly misleading number.
Uncomfortable truth no. 2: three retail chains carry revenue — and a fourth just went bankrupt
A credit card lender without a storefront of its own depends on other people’s storefronts. How much, the risk section of the annual report spells out:
“We depend on a limited number of large partner relationships for a significant portion of our revenue. As of and for the year ended December 31, 2025, our five largest credit card programs (based on Total net interest and non-interest income) accounted for approximately 49% of our Total net interest and non-interest income excluding the gain on sale and 44% of our End-of-period credit card and other loans.”
— Bread Financial Holdings, Inc., SEC annual report 10-K for 2025, Item 1A Risk Factors
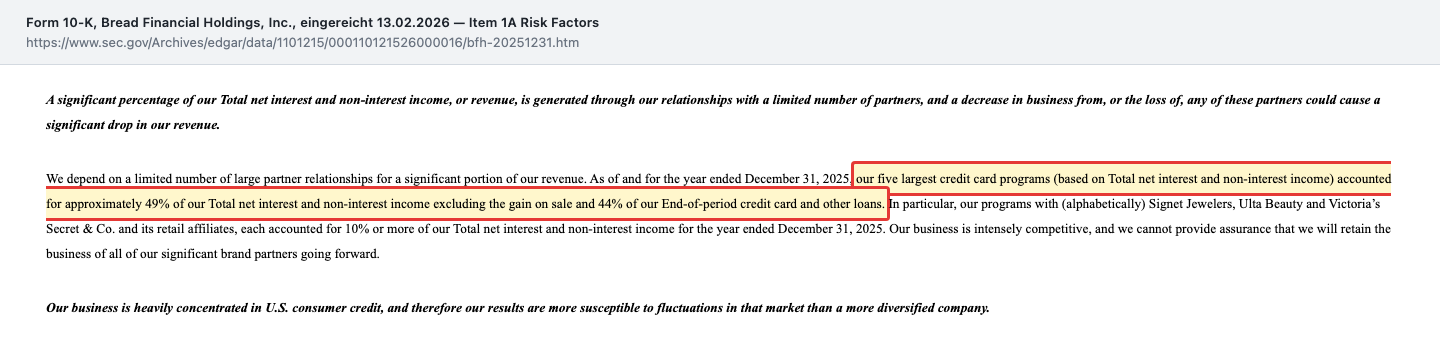
The report even names them: the programs with Signet Jewelers, Ulta Beauty and Victoria’s Secret & Co. and its retail affiliates each individually accounted for 10 percent or more of revenue in 2025. Three retail chains from jewelry, beauty and lingerie — three categories that all depend on the same consumer mood.
That this is no theoretical risk, Bread Financial writes in the same report:
“most recently, for example, our brand partner Saks Fifth Avenue filed for Chapter 11 bankruptcy protection in January 2026.”
— Bread Financial Holdings, Inc., SEC annual report 10-K for 2025, Item 1A Risk Factors
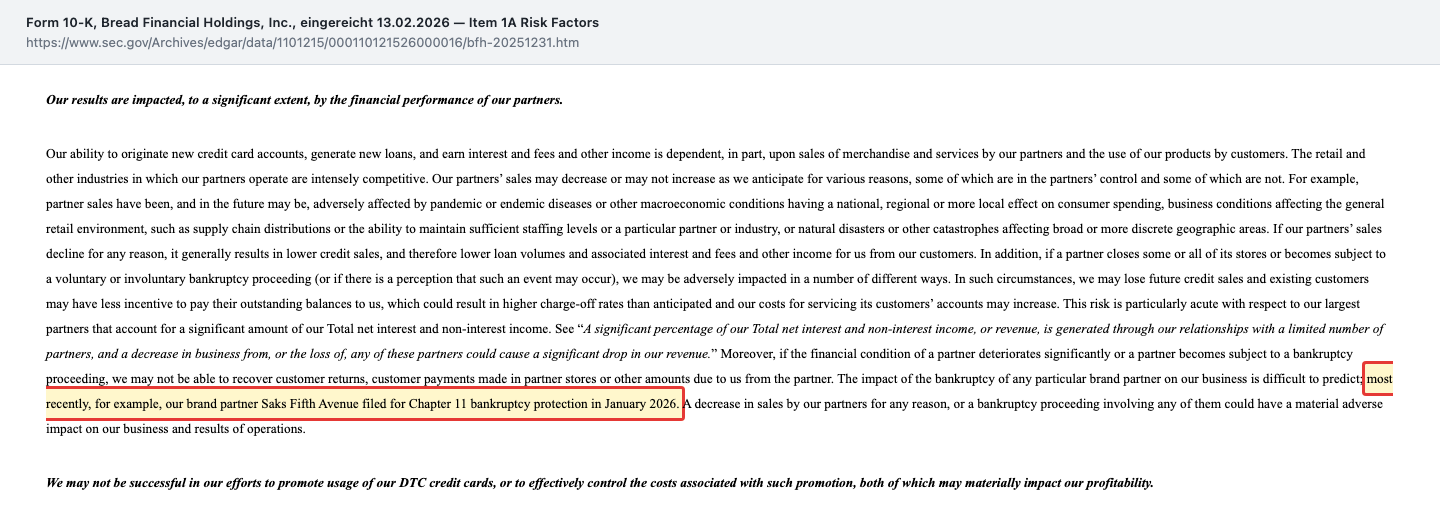
What happens in a partner bankruptcy the company also describes: future credit sales disappear, existing cardholders have less incentive to pay down their balances, charge-offs can run higher than planned, and servicing costs rise. A card program is not a security you can simply leave lying around — it lives off a store where somebody shops.
Uncomfortable truth no. 3: profit grows because reserves shrink — and that engine is running dry
The pattern of recent years fits in one sentence: falling loss rates allow part of a previously built credit reserve to be released — and every release lands straight in profit. In 2024 it was $92 million, in 2025 already $135 million. The quarterly report for the period ended March 31, 2026 shows where this is heading:
“Provision for credit losses increased during the three months ended March 31, 2026 driven by a $28 million reserve release and net principal losses of $331 million, compared with a $69 million reserve release and net principal losses of $365 million in the prior year period.”
— Bread Financial Holdings, Inc., SEC quarterly report 10-Q for the period ended March 31, 2026, MD&A
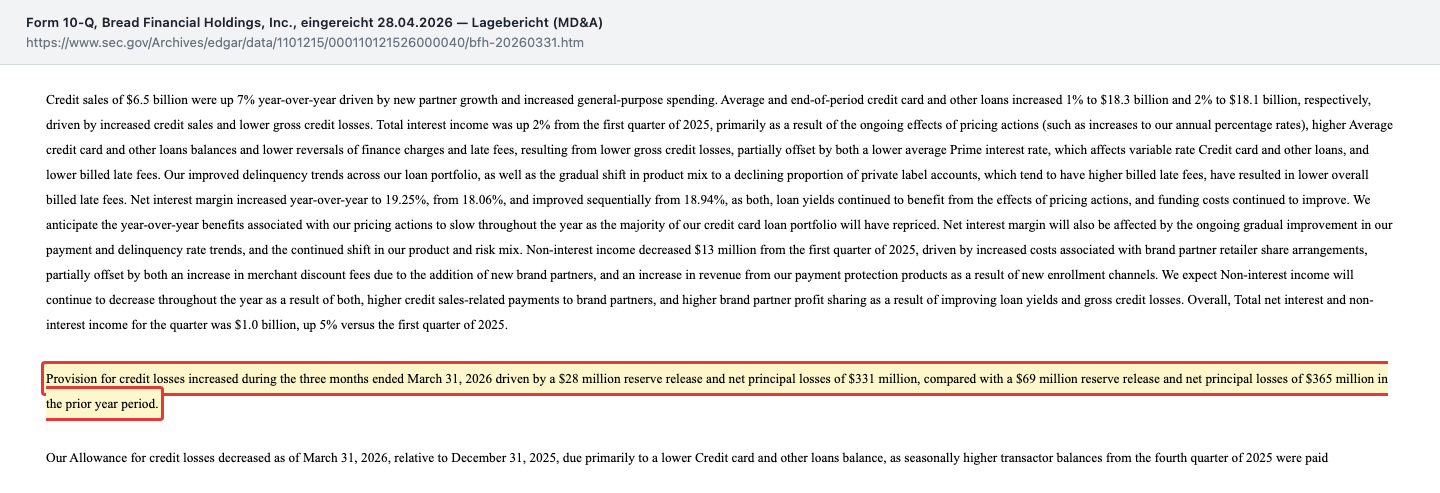
In the second quarter of 2026 the trend became sharper still. The earnings release of July 23, 2026 — furnished to the U.S. securities regulator, the SEC, with the matching quarterly report not yet available as of this analysis — reports a reserve release of only $3 million after $74 million in the prior-year quarter. Net principal losses fell 9 percent to $316 million at the same time, yet the provision still rose 14 percent to $313 million. Across the first half of 2026, $143 million of release a year earlier turned into $31 million.
To stay fair: net income still rose 5 percent in the quarter to $146 million, and pretax pre-provision earnings — the measure the company itself uses for operating strength — climbed 14 percent to $510 million. The business does carry itself. But the extra push from releases is arithmetically almost spent: the reserve rate stands at 11.23 percent, only 66 basis points below the prior year. Anyone extrapolating the profit curve of the past two years is extrapolating a line that will not be there much longer.
Uncomfortable truth no. 4: the Altman Z says “bankrupt” — and is the wrong tool here
We write this section against our own data set. It stores an Altman Z score of 0.80 for Bread Financial; recomputing it ourselves from the 2025 annual report we even arrive at -0.05. In the Z-double-prime variant we use, the distress zone lies below 1.1 and the safe zone above 2.6. Both readings would therefore mean “acute risk of insolvency”. On top of that the data set flags two balance sheet warning signals.
These numbers say nothing about Bread Financial. The Altman Z was developed for manufacturing companies and measures, among other things, working capital against total assets and sales against total assets. A bank is highly leveraged by construction — it takes in deposits in order to make loans; that is its business, not its problem. The same formula would classify almost every credit institution on earth as at risk of insolvency. Classic interest coverage is no more useful: at a lender, interest expense is the purchase price of the goods, not a debt burden — the data set holds a value of 0.72 for it, which likewise means nothing.
Anyone who wants to know how stable this company is has to use the metrics it is actually regulated by:
- CET1 capital ratio: 12.9 percent as of June 30, 2026 (December 31, 2025: 13.0 percent; March 31, 2026: 13.3 percent). The regulatory minimum for the banks is 7 percent including the capital conservation buffer. Bread Financial therefore holds roughly double the required level.
- Equity ratio: 14.7 percent ($3,327 million of $22,663 million of total assets as of December 31, 2025). For a lender that is comfortable; large classic banks operate on considerably less.
- Reserve rate: 11.23 percent of outstanding loans as of June 30, 2026 — against a running net loss rate of 6.98 percent. The reserve therefore covers roughly a year and a half of charge-offs at the current pace.
- Interest coverage, calculated sensibly: pretax pre-provision earnings of $1,857 million (2025) cover interest on borrowings of $300 million roughly 6.2 times. Including deposit interest (together $854 million), it is still more than double.
- Funding: direct bank deposits grew to $9.4 billion (June 30, 2026) and provide half of total funding. That is the more stable and cheaper source compared with the capital markets.
Remember: a metric without its business model is a number without meaning. That is as true of the Altman Z here as it is of free cash flow two chapters above.
What the stock costs — orders of magnitude, not daily quotes
Let us calculate it ourselves, with the most recent building block available. The financial supplement to the July 23, 2026 earnings release shows 38.7 million common shares as of June 30, 2026 — after 41.3 million a quarter earlier and 46.6 million a year earlier. Times the July 24, 2026 closing price of $104.31 that gives a market capitalization of roughly $4.04 billion. A note on the data: our data set still uses the 40,407,065 shares from the quarterly report cover page (as of April 22, 2026) and therefore arrives at $4.21 billion — roughly 4 percent more. We use the newer figure.
- Price-to-free-cash-flow as the scanner reads it: roughly 2 (market capitalization against operating cash flow less capital spending).
- Price-to-free-cash-flow calculated honestly: $4.04 billion against the $721 million left after all investing in 2025 gives roughly 5.6. Against what actually reached the owners ($355 million), it is roughly 11.
- Price-to-earnings: $104.31 against $12.25 of diluted earnings per share over the last four quarters gives roughly 8.5.
- Price-to-book: against book value per common share of $81.79 (June 30, 2026) roughly 1.3; against tangible book value of $63.66 roughly 1.6.
- Dividend: $0.23 per quarter (declared July 23, 2026), annualized roughly 0.9 percent of the share price. In 2025 the full-year figure was $0.86.
A price-to-earnings ratio of 8.5 and 1.3 times book value are not a high price for a lender earning a 17 percent return on equity. The point of this analysis is not that the stock is expensive — it is that it is not as cheap as a single metric claims. Between “twice cash flow” and “5.6 times” lies the difference between an exclamation mark and an ordinary value stock.
The professionals are split accordingly. Of 16 research houses (as of July 24, 2026), four rate the stock a strong buy and one a buy, eight a hold, two a sell and one a strong sell. The average price target is $112.40. You rarely see so many sell ratings on a stock with a single-digit price-to-earnings ratio — which fits neatly with what we have just taken apart. What another specialty lender with a very similar valuation question looks like we wrote up in our Consumer Portfolio Services analysis.
Opportunities and risks at a glance
What speaks for Bread Financial:
- A net interest margin of 18.4 percent (2025) and a loan yield of 26.6 percent — levels unreachable in classic banking.
- A CET1 capital ratio of 12.9 percent (June 30, 2026) against a 7 percent regulatory minimum; an equity ratio of 14.7 percent.
- Credit quality is genuinely turning: delinquency rate down from 6.5 (2023) to 5.25 percent, net loss rate from 8.2 (2024) to 6.98 percent; full-year guidance cut to 7.0 to 7.1 percent in July 2026.
- Cheaper funding: direct bank deposits of $9.4 billion (up 16 percent) now provide half of all funding.
- Substantial buybacks: 17 percent fewer common shares within twelve months, with $449 million of authorization still open (June 30, 2026).
- Book value per common share rose 21 percent to $81.79, tangible book value 22 percent to $63.66 (June 30, 2026).
What speaks against it:
- The hook does not survive scrutiny: instead of roughly twice free cash flow it is roughly 5.6 times when calculated honestly.
- Concentration: five programs for 49 percent of revenue, three partners individually above 10 percent; partner Saks Fifth Avenue in Chapter 11 since January 2026.
- The profit boost from reserve releases is running dry: $3 million instead of $74 million in the second quarter of 2026.
- The loan book is stagnating: average loans in 2025 were 1 percent below 2024, and revenue has moved between $3.8 and $4.3 billion for three years.
- Pure U.S. consumer credit with no diversification — fully exposed to the economy, the labor market and regulation of card interest rates and late fees.
- A new claim ahead of the common: $201 million of perpetual preferred stock at 8.625 and 8.875 percent, whose dividend is served before the common shares.
- Non-interest income is negative (minus $213 million in 2025) because payments to retail partners exceed interchange revenue — rising partner claims press directly on revenue.
A human conclusion
The shortcut from the opening is not stupidity but thrift: we want to turn one number into a verdict, because numbers are cheaper than reports. At Bread Financial the short version reads: “twice cash flow — you have to buy that.” The long version reads: “a soundly capitalized lender with an excellent interest margin, a stagnating loan book and three retail chains carrying half of revenue, at roughly 5.6 times what is really left after all investing.”
Both sentences are in the same filings. The second one takes an hour longer. What really matters here is not the verdict but the question you will ask next time a metric looks too good: does this metric even fit this business model? For a lender and free cash flow the answer is no. That does not make the stock bad — it makes it something other than the ranking promises.
What you make of that is up to you. And that is exactly as it should be.
Sources
- Bread Financial Holdings, Inc. — annual report 10-K for 2025 (filed February 13, 2026, CIK 0001101215)
- Bread Financial Holdings, Inc. — quarterly report 10-Q for the period ended March 31, 2026 (filed April 28, 2026)
- Bread Financial Holdings, Inc. — annual report 10-K for 2024 (filed February 14, 2025)
- Bread Financial Holdings, Inc. — second-quarter 2026 earnings release (Exhibit 99.1 to the 8-K dated July 23, 2026, together with financial supplement 99.2 and the dividend declaration 99.3)
- Bread Financial Holdings, Inc. — current report 8-K dated May 12, 2026 (Series B preferred stock, 8.875 percent, perpetual)
- Fundamental data & SEC filings (annual and quarterly reports, 10-K/10-Q) and our in-house stock scanner, data as of July 27, 2026; price history since 2001 (6,318 trading days) for the all-time-high recalculation
Journalistic analysis, not investment advice and not a solicitation to buy or sell securities. Stocks can lose value at any time, and a total loss is possible. All figures are taken from the original documents linked above and carry the as-of date stated there; the second-quarter 2026 figures come from the earnings release of July 23, 2026, as the matching quarterly report (10-Q) had not been filed as of the date of this analysis. Metrics from our data set are labeled with their data date and are recomputed daily. The author holds no position in Bread Financial Holdings, Inc. at the time of publication.
Our Bottom Line at a Glance
- Strength of the scanner hook negative
- The price-to-free-cash-flow ranking works off operating cash flow of $2,092 million (2025). That figure adds back $1,242 million of provision for credit losses, while real net principal losses were $1,377 million and loan book growth ($1,345 million) sits in investing activities. Two independent routes arrive at $721 million and $715 million — so roughly 5.6 times cash flow rather than 2.
- Capital base and funding positive
- The CET1 capital ratio stood at 12.9 percent as of June 30, 2026 against a 7 percent regulatory minimum including the capital conservation buffer; the equity ratio was 14.7 percent (December 31, 2025). A reserve rate of 11.23 percent covers roughly a year and a half of charge-offs at the current pace. Direct bank deposits grew to $9.4 billion and provide half of all funding.
- Earning power and margins positive
- A loan yield of 26.6 percent and a net interest margin of 18.4 percent (2025) are levels that do not exist in classic banking. Pretax pre-provision earnings rose 14 percent to $510 million in the second quarter of 2026, return on average equity was 17.1 percent and return on average tangible common equity 22.6 percent.
- Quality of profit growth negative
- A substantial part of the profit increase comes from releasing credit reserves: $92 million (2024), $135 million (2025). That line is running dry — only $3 million was released in the second quarter of 2026 after $74 million a year earlier, and $31 million in the first half after $143 million. Meanwhile the loan book is stagnating: average loans in 2025 were 1 percent below 2024.
- Customer structure negative
- The five largest card programs accounted for roughly 49 percent of revenue and 44 percent of loans in 2025; Signet Jewelers, Ulta Beauty and Victoria's Secret each individually reached 10 percent or more. Brand partner Saks Fifth Avenue filed for Chapter 11 bankruptcy protection in January 2026. The business is also entirely concentrated in U.S. consumer credit.
- Capital returns neutral
- The common share count fell from 46.6 million to 38.7 million within twelve months (down 17 percent), with $449 million of authorization still open as of June 30, 2026. Part of that was funded through $201 million of perpetual preferred stock at 8.625 and 8.875 percent — a new, permanent claim ahead of common shareholders costing roughly $17.6 million of dividends a year.
Bread Financial is a soundly capitalized lender with an interest margin that has few peers in banking — but the reason the stock reached our desk does not survive scrutiny. The price-to-free-cash-flow ratio of 1.95 exists because operating cash flow adds back the credit provisions while loan book growth sits in another section; calculated honestly it is roughly 5.6. Add a stagnating loan book, three retail partners each above 10 percent of revenue, and a profit boost from reserve releases that is all but spent. Not investment advice.
What Our Rating Means
Open questions
The business works in principle, but one material question is open. As long as it stays open, our findings do not carry a quality verdict.
Yellow here is not about an existential question — the capital base holds up: a CET1 capital ratio of 12.9 percent as of June 30, 2026 against a 7 percent regulatory minimum, an equity ratio of 14.7 percent, a reserve rate of 11.23 percent against a running net loss rate of 6.98 percent, and funding that is half self-generated direct bank deposits. The Altman Z of 0.80 stored in our data set is explicitly not a verdict for a credit institution, because the formula was developed for manufacturers. Yellow stands because three operating questions are open. First, the loan book is stagnating — average loans in 2025 were 1 percent below 2024, and revenue has moved between $3.8 and $4.3 billion for three years. Second, a substantial part of the profit increase comes from releasing credit reserves ($92 million in 2024, $135 million in 2025), and that line is nearly spent: only $3 million in the second quarter of 2026 after $74 million. Third, roughly 49 percent of revenue hangs on five card programs, three partners individually clear 10 percent, and with Saks Fifth Avenue a brand partner already entered Chapter 11 proceedings in January 2026. The business model itself clearly carries (net interest margin 18.4 percent, return on equity 17.1 percent, pretax pre-provision earnings up 14 percent in the second quarter of 2026). Whether improved credit quality turns back into growth will show at the earliest in the next quarterly report.
A journalistic assessment by our editorial team at the time of the deep dive, based on public sources — not investment advice and not a solicitation to buy or sell. Your personal circumstances (investment goals, risk capacity, taxes) cannot be taken into account. What our levels mean, how verdicts are formed, and what conflicts of interest exist →
Worth Noting
- Hook: price-to-free-cash-flow ranking, P/FCF 1.95 → rank 36 of 545 U.S. hits, data as of July 27, 2026. Only the 25 strongest hits are visible on the scanner page; Bread Financial sits below that and is found through the screener. On the German brand the same scanner additionally covers European names (836 hits in total), which does not change its U.S. position. All lists are recomputed daily.
- As-of dates: annual figures from the 2025 annual report on Form 10-K (filed February 13, 2026), quarterly figures from the 10-Q for the period ended March 31, 2026 (filed April 28, 2026). The second-quarter 2026 figures come from the earnings release of July 23, 2026 (Exhibits 99.1 and 99.2 to the current report on Form 8-K) — the matching quarterly report had not been filed as of that date. All 32 filings after April 28, 2026 were reviewed; no Form 25, no Form 15, no tender offer or merger document.
- Deliberately not used as evidence: the Altman Z score (stored 0.80, recomputed -0.05; Z-double-prime thresholds 1.1 and 2.6) and classic interest coverage (0.72) say nothing about banks and lenders, because the formulas were built for manufacturers and interest expense is the purchase price of the goods here. The assessment instead runs through the CET1 capital ratio, the equity ratio, the reserve rate and the coverage of borrowing interest by pretax pre-provision earnings.
- Deviations from the data set: share count of 38.7 million per the financial supplement of July 23, 2026 instead of 40,407,065 from the 10-Q cover page (April 22, 2026) — giving $4.04 billion instead of $4.21 billion of market capitalization. Distance from the all-time high recomputed at 66.3 percent against the closing price of $309.91 on April 23, 2015 instead of the stored 50.63 percent; the stored value rests on a shorter price history.
- Possible confusion: Bread Financial was named Alliance Data Systems Corporation until March 23, 2022 and then also ran loyalty programs and marketing services. Price series before 2022 economically belong to a different company. Alongside the common stock BFH, two preferred issues trade (BFH-PA, BFH-PB) that do not count toward the market capitalization of the common shares.
Frequently Asked Questions
Bread Financial is the lender behind the store cards of U.S. retail chains. Through its own banks, Comenity Bank and Comenity Capital Bank, it issues private label and co-brand credit cards, offers pay-over-time financing at checkout under the Bread Pay brand and has run a direct bank for savings deposits since 2019. At the end of 2025 it held $18.8 billion of loans.
Because at a lender, operating cash flow does not contain the charge-offs. In 2025, $1,242 million of provision for credit losses was added back as non-cash while actual net principal losses were $1,377 million. On top of that, the growth of the loan book sits in investing activities at $1,345 million. After all investing, $721 million was left instead of $2,068 million.
Two independent routes reach the same answer: operating and investing activities together left $721 million in 2025, and cash flow less the real net charge-offs left $715 million. What actually reached the owners was $355 million — $313 million of share repurchases and $42 million of dividends. That works out at a price-to-cash-flow ratio of roughly 5.6 instead of 2.
Heavily. The five largest card programs accounted for roughly 49 percent of revenue and 44 percent of outstanding loans in 2025. Signet Jewelers, Ulta Beauty and Victoria's Secret each individually reached 10 percent or more of revenue. Brand partner Saks Fifth Avenue filed for Chapter 11 bankruptcy protection in January 2026.
No — it is simply the wrong tool here. The formula was developed for manufacturers and classifies almost every credit institution as at risk, because banks are highly leveraged by business model. The meaningful figures are instead the CET1 capital ratio of 12.9 percent (June 30, 2026) against a 7 percent minimum, the equity ratio of 14.7 percent and the reserve rate of 11.23 percent.
Because credit quality is improving, which allows reserves to be released — and every release lifts profit immediately. In 2024 it was $92 million, in 2025 already $135 million. That engine is running dry, however: only $3 million was released in the second quarter of 2026 after $74 million a year earlier, and $31 million in the first half after $143 million.
Because only the 25 strongest hits are displayed. Among the 545 U.S. hits of the price-to-free-cash-flow ranking, Bread Financial ranks 36th (data as of July 27, 2026) and therefore sits just outside the visible list. The screener lets you filter the same metric without that cutoff. All lists are recomputed daily, so ranks change continuously.
Yes. Until March 23, 2022 the company was Alliance Data Systems Corporation and ran loyalty programs and marketing services alongside the card business, both of which were spun off or sold. Old price charts therefore show a different company: the highest closing price ever, $309.91, dates from April 23, 2015.
Found an error?
Did you spot a factual error, an outdated number, or a typo in this deep dive? Let us know briefly — your report goes straight to the editorial team.