Carpenter Technology Stock: Earnings Up Sixfold, Shipments Shrinking — and the Market Pays 62 Times Profit
Carpenter Technology has been melting alloys since 1889 that keep working where ordinary steel gives up: in jet engines, landing gear, implants. In our in-house Buffett criteria scanner, the stock ranks no. 9 in the U.S. selection (as of July 18, 2026) — return on equity, leverage, margin, earnings streak: every box in order. We read the annual reports (10-K) and the quarterly report (10-Q) as of March 31, 2026: earnings per share that jumped sixfold within two fiscal years, from $1.14 to $7.42 — but also a shipment volume that shrank 10 percent, an aerospace concentration lately at 66 percent of revenue, and a price-earnings ratio near 62 for a materials company. Not investment advice — just a reminder that in a steep climb, every aircraft feels overpowered.
 Thomas Mücke
Founder & Publisher
Thomas Mücke
Founder & Publisher

Chart
Interactive price chart (TradingView).
Note: pure fact-based analysis, not investment advice and not a solicitation to buy or sell. All figures without guarantee.
There is an investor trap that pilots know better than stock pickers: the climb trap. In a steep climb, every aircraft feels overpowered — the thrust pushes you back, the instruments glow green, and nobody asks how much of it is engine and how much is updraft. In markets, the updraft is called a cycle, and hardly any stock sits in one as textbook-perfectly in mid-2026 as Carpenter Technology Corporation (NYSE: CRS): earnings per share have jumped sixfold within two fiscal years, the stock has multiplied roughly twentyfold in four years (data as of July 18, 2026) — and in our in-house Buffett criteria scanner, the company ranks no. 9 in the U.S. selection (as of July 18, 2026), with flawless quality instruments. So let\'s make a deal: before you trust the thrust, we read together what the company itself filed, under penalty of law, with the U.S. securities regulator, the SEC — the annual reports (10-K) for fiscal years 2025 and 2024 and the quarterly report (10-Q) as of March 31, 2026. Both things are in there: the most profitable year of a 137-year company history. And the note that the company ships less metal than two years ago — at much higher prices, to an end market that keeps growing more dominant. In the end, you decide how much of this is engine and how much is wind.
What Carpenter Technology actually does — and why aerospace is lining up
Carpenter Technology, founded in 1889 and headquartered in Philadelphia, Pennsylvania, is not an ordinary steel company but an alloy specialist: from nickel, cobalt, titanium, chromium and other ingredients it melts materials that keep working where ordinary steel fails — inside jet engines at more than 1,800 degrees Fahrenheit, in landing gear that absorbs landing after landing, in hip implants that stay in the body for decades. Put into an everyday image: a steel mill sells flour; Carpenter sells the sourdough culture that bakers line up for and whose recipe only a few master. The company reports in two segments: SAO (Specialty Alloys Operations, the big melting and rolling mills, $2,563.6 million in fiscal 2025 revenue) and PEP (Performance Engineered Products, including the Dynamet titanium business and the Carpenter Additive powder unit for 3D printing). The company counted about 4,500 employees as of June 30, 2025 — a remarkably small crew for a market value near $30 billion (data as of July 18, 2026).
One quirk you need to know before reading the numbers: the fiscal year ends June 30. "Fiscal 2025" at Carpenter means July 2024 through June 2025; the quarter ended March 31, 2026, is the third quarter of fiscal 2026, and fourth-quarter results are expected in late July 2026. Customer number one is the aerospace and defense industry: 62 percent of revenue came from the Aerospace and Defense end-use market in fiscal 2025, up from 51 percent in fiscal 2023 — aircraft makers are working through record order books, and every airframe and every engine needs Carpenter\'s alloys. Which brings us to the central tension of this analysis, running through every chapter: the Buffett quality criteria are genuinely met — but the earnings surge comes from prices rather than volume, hangs ever more on a single end market, and the market already prices the materials company like a growth stock.
Where the stock shows up in our scanner
Every day we run roughly 3,500 stocks through our scanners. As of July 18, 2026, Carpenter Technology appears broadly with 23 hits — the most interesting one is rank 9 in the Buffett criteria scanner (U.S. selection; 25 U.S. hits out of 104 total). To replicate it yourself: open the scanner, set the country filter to "US" — Carpenter sits in the top third. The scanner tests the screenable criteria from Mary Buffett\'s "Buffettology," and Carpenter passes all of them: a return on equity of about 25 percent (required: at least 15 — Carpenter earns a quarter on every dollar of equity), a debt-to-equity ratio of 0.38 (allowed: at most 0.5 — just 38 cents of debt per dollar of equity), an EBIT margin near 23 percent (required: at least 10), earnings per share positive in every recent quarter and rising across the series ($1.66 to $2.78), plus positive free cash flow over four quarters. The fundamental lens agrees: a Piotroski F-Score of 8 of 9 (a nine-point health check of the books — robust health starts at 8) and an Altman Z-Score near 10 (an early-warning test for financial distress — the danger zone historically starts below 1.8; Carpenter plays in another league). The momentum scanners glow, too: relative strength 96 of 99, near the all-time high, a stage-2 uptrend. And the price side? A price-earnings ratio near 62, price-to-sales near 10, price-to-book near 14 (all data as of July 18, 2026). Remember the principle: the Buffett scanner tests whether a company is good — whether it is worth its price, you have to test yourself. Which is exactly why we now read the filings.
The numbers over the years — honestly appraised
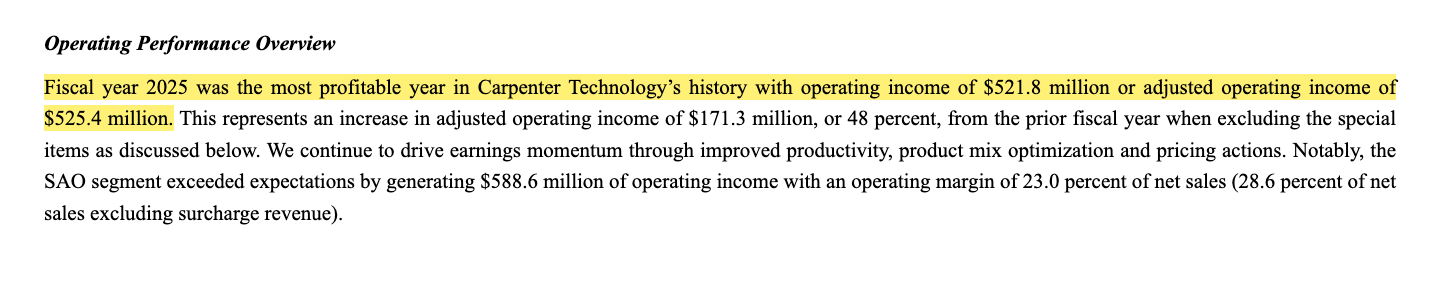
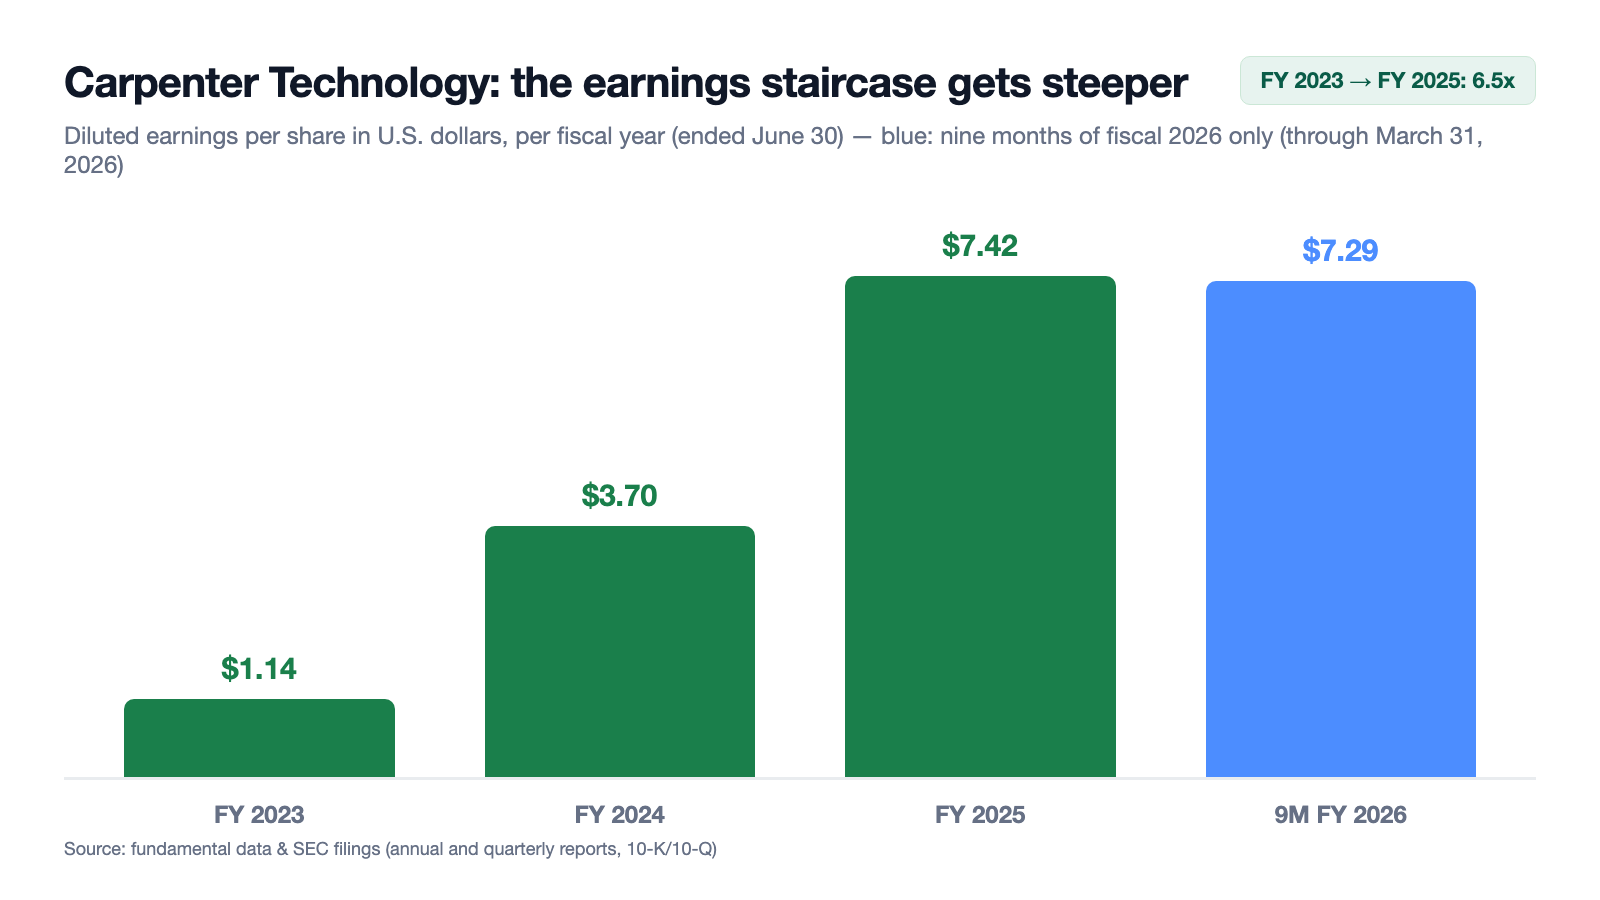
First, what genuinely impresses — and here, a lot does. Revenue rose from $2,550.3 million (FY 2023) to $2,759.7 million (FY 2024) to $2,877.1 million in fiscal 2025 (up 4 percent). The earnings curve was far steeper: net income jumped from $56.4 million to $186.5 million to $376.0 million, diluted earnings per share from $1.14 to $3.70 to $7.42 — sixfold in two fiscal years. The operating margin climbed from 5.2 to 11.7 to 18.1 percent. The annual report frames the year itself:
"Fiscal year 2025 was the most profitable year in Carpenter Technology’s history with operating income of $521.8 million or adjusted operating income of $525.4 million."
— Carpenter Technology Corporation, SEC annual report 10-K for fiscal year 2025, Item 7 "Management's Discussion and Analysis" (Operating Performance Overview)
And the record year was no endpoint: in the first nine months of fiscal 2026 (through March 31, 2026), Carpenter generated $2,273.2 million in revenue (up 7 percent) and earned $367.4 million — $7.29 per diluted share, almost the entire prior-year figure in three quarters of the time. The third quarter was the strongest in company history, per the filing: $186.5 million in operating income (up 35 percent), with the core SAO segment posting an operating margin of 28.3 percent — 35.6 percent adjusted for passed-through raw-material surcharges. Cash keeps up: $440.4 million of operating cash flow in fiscal 2025 (adjusted free cash flow: $287.5 million), $364.9 million in the first nine months of fiscal 2026 (adjusted free cash flow: $207.3 million — more than double the prior-year period).
But pause before the number rush takes over — one line from the same annual report belongs next to it: pounds sold fell from 214,122 thousand (FY 2023) to 206,302 thousand (FY 2024) to 192,980 thousand (FY 2025) — minus 10 percent in two years, while revenue and profit set records. How that fits together is the most important question of this analysis. Remember the image: the register rings louder, even though less metal crosses the scale.
What the filings say — the uncomfortable truths
Uncomfortable truth no. 1: the growth comes from price, not volume
The annual report makes no secret of the mechanics — in the core SAO segment, it fits in a single sentence:
"Net sales in fiscal year 2025 for the SAO segment increased 5 percent to $2,563.6 million, as compared with $2,443.8 million in fiscal year 2024. Excluding surcharge revenue, net sales increased 10 percent on 11 percent lower shipment volume as compared to fiscal year 2024."
— Carpenter Technology Corporation, SEC annual report 10-K for fiscal year 2025, Item 7 (SAO segment results)
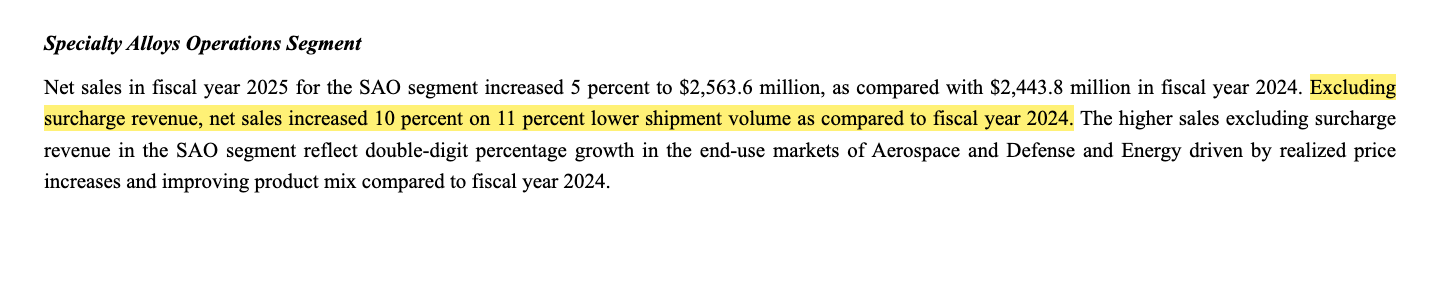
Ten percent more revenue on eleven percent less volume — on one side, that is proof of genuine pricing power: Carpenter deliberately shifts its capacity to the most complex, highest-priced alloys and can raise prices because the aerospace supply chain is competing for scarce specialty materials. That is precisely the "moat" the Buffett scanner cannot measure — here it is, visible. On the other side, it means: the record growth has no volume foundation. About 40 percent of fiscal 2025 revenue (43 percent in the first nine months of fiscal 2026) also ran through firm price sales arrangements that Carpenter hedges with commodity forwards on nickel, cobalt and titanium — a construction that is invisible in calm markets and can distort margins in wild ones. Price increases are the fastest growth in the world as long as they stick — and the first thing a downturn takes back. Growth that comes from the price lever deserves a cyclical discount — not a growth-stock premium.
Uncomfortable truth no. 2: the concentration is called aerospace — and it grows every year
Carpenter\'s market list only sounds diversified on paper — aerospace, medical, energy, transportation, industrial. The weights have been shifting in one direction for three years: Aerospace and Defense accounted for 51 percent of revenue in fiscal 2023, 56 percent in fiscal 2024, 62 percent in fiscal 2025 — and 66 percent in the quarter ended March 31, 2026 ($534.2 of $811.5 million). The second-largest end market, Medical, shrank 23 percent in that same quarter. The quarterly report explicitly describes the tailwind as accelerating:
"Looking ahead, demand in our Aerospace and Defense end-use market continues to accelerate as customers gain confidence in higher build rates. As a result, customers are placing more orders for materials used in the Aerospace structural sub-market."
— Carpenter Technology Corporation, SEC quarterly report 10-Q as of March 31, 2026, Item 2 "Management's Discussion and Analysis" (Operating Performance Overview and Outlook)
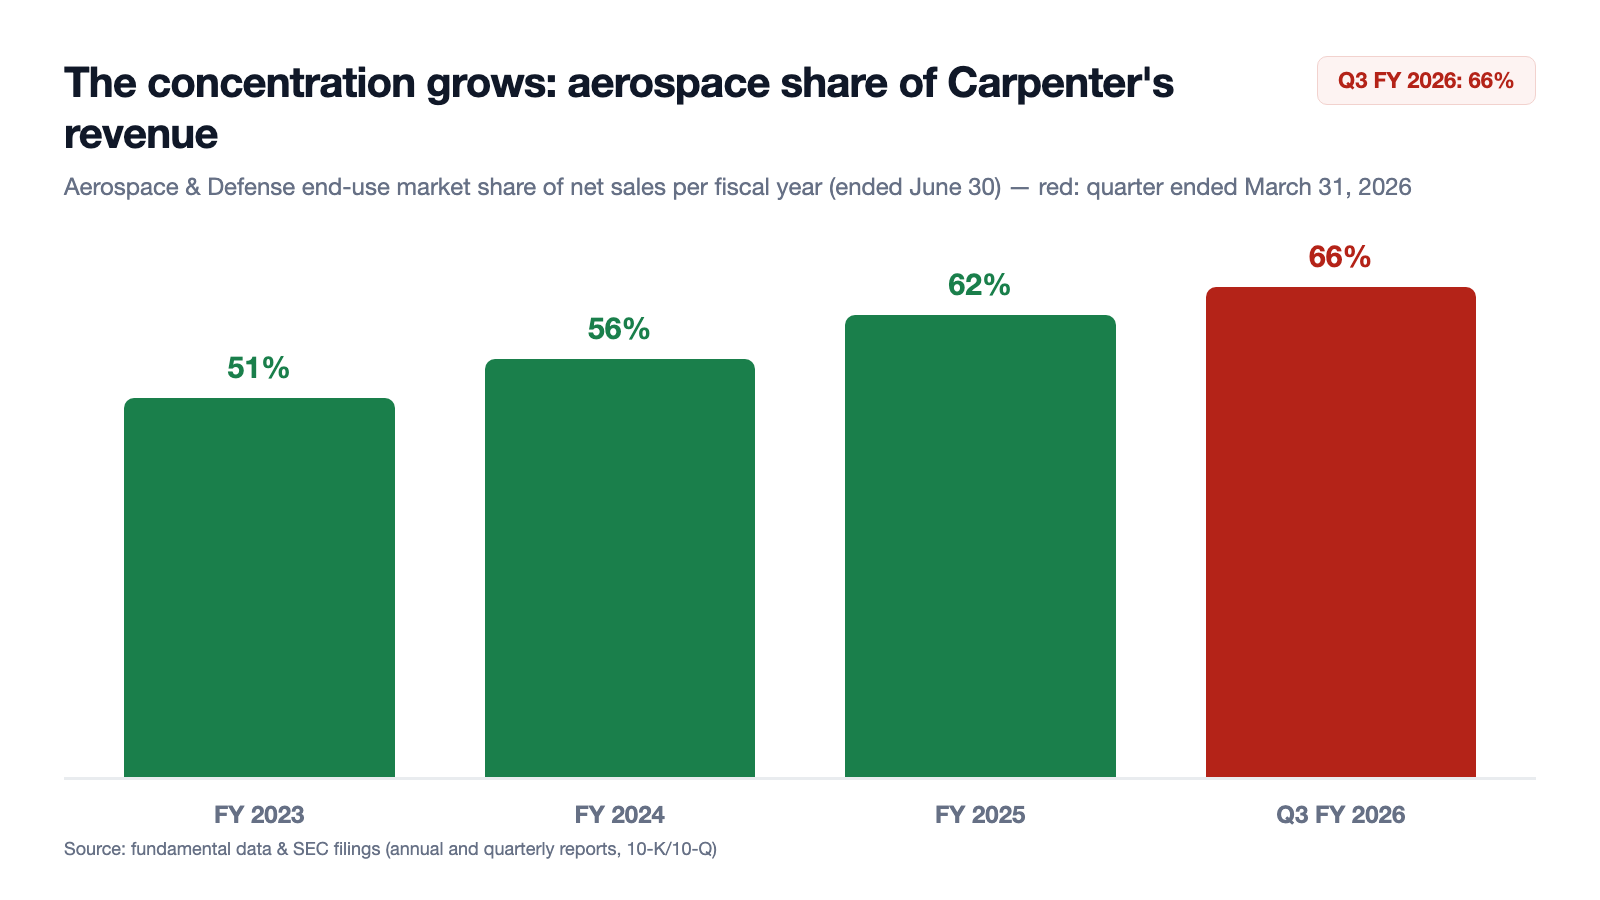
Two thirds of the business tied to one end market — that is the flip side of the tailwind. To be fair: no single customer accounted for 10 percent or more of revenue, per the quarterly report; the risk clumps at the end market, not at one buyer. But the same filing\'s risk catalog explicitly names "challenges affecting the commercial aviation industry or key participants including, but not limited to production and other challenges at The Boeing Company" — and the build rates Carpenter\'s customers are betting their confidence on are exactly the variable this industry has most reliably missed in recent years. Remember the mechanism: the bigger the concentration, the more the forecast hangs on someone else\'s assembly line.
Uncomfortable truth no. 3: three sites carry almost everything
If you picture a materials near-monopolist with production spread around the globe, the risk chapter of the annual report reads differently:
"It is possible that we could experience prolonged periods of reduced production due to unforeseen catastrophic events occurring in or around our manufacturing facilities in Reading and Latrobe, Pennsylvania and Athens, Alabama. As a result, we may be unable to shift manufacturing capabilities to alternate locations, accept materials from suppliers, meet customer shipment needs or address other severe consequences that may be encountered."
— Carpenter Technology Corporation, SEC annual report 10-K for fiscal year 2025, Item 1A "Risk Factors"
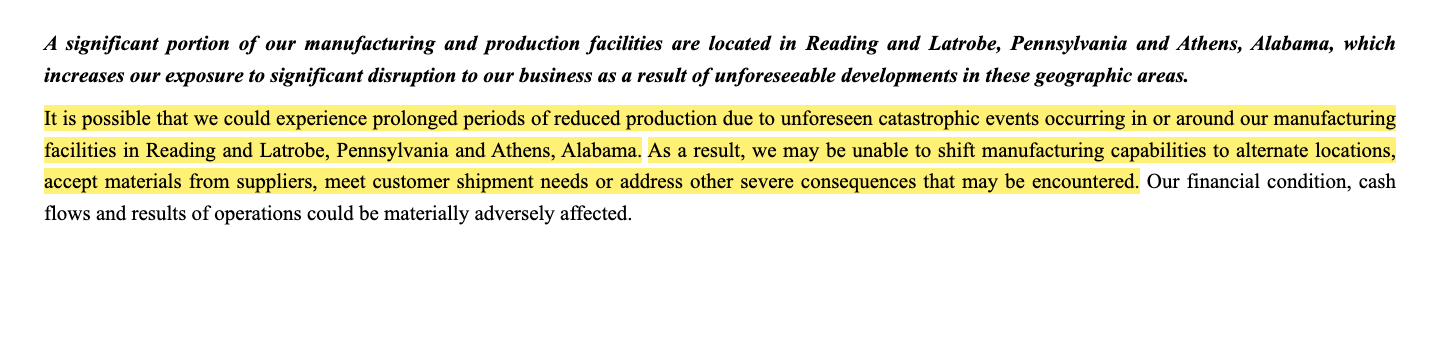
The furnaces that melt and remelt superalloys are so specialized that there are no alternate sites — the very quality that makes Carpenter irreplaceable to its customers makes these plants irreplaceable to Carpenter. Add a small, highly specialized workforce (about 4,500 people; metallurgists are hard to replace, per the risk chapter) and collective bargaining agreements at two sites. The company is investing against the bottleneck: the brownfield expansion in Athens, Alabama, is expected to add primary and secondary melt capacity, and fiscal 2026 capital expenditures are planned at about $260 million — nearly double the prior year. That is the right move — but it also means: the volume growth the share price is prepaying still has to be built.
The dividend: paid since 1906 — and frozen for years
Say "Buffett" and many think of dividend nobility — and indeed the annual report holds a sentence with a royal ring:
"We have paid quarterly cash dividends on our common stock since 1906. We paid a quarterly dividend of $0.20 per share of common stock during each quarter of fiscal years 2025 and 2024, respectively."
— Carpenter Technology Corporation, SEC annual report 10-K for fiscal year 2025, Item 5 "Market for Registrant's Common Equity"

One hundred twenty years of quarterly dividends — a longer streak than most aristocrats can show. Except: it never goes up. The filings show an unchanged $0.20 per quarter across fiscal years 2023, 2024 and 2025 — $0.80 a year, which at a share price near $600 (data as of July 18, 2026) works out to a yield of roughly 0.13 percent. The payout cost just $40.3 million in fiscal 2025 — about 11 percent of net income. And the $400 million buyback program? The annual report is disarmingly honest: "The primary use of this program is to offset dilution" — it primarily offsets dilution from share-based compensation (575,000 shares repurchased for $101.9 million in fiscal 2025, another 445,000 for $133.9 million in the first nine months of fiscal 2026). If you expect capital returns in the Caterpillar style — we just dissected that contrast in our Caterpillar analysis — you will be disappointed: Carpenter keeps the money and builds melting furnaces with it. That may well be the right call. An income stock it is not.
Valuation: what the market charges for the climb
Now for the price tag. In mid-July 2026 the Carpenter share cost about $600, for a market value near $29.8 billion (all valuation figures: data as of July 18, 2026). That works out to: a price-earnings ratio near 62 (on trailing twelve-month earnings of roughly $9.50 per share), price-to-sales near 10, price-to-book near 14 and price to free cash flow near 73. For perspective: that is more than double the P/E of about 29 we noted in early July 2026 in our Nvidia analysis — a materials company with shrinking shipment volume is valued richer than the most profitable growth company in stock market history. It is possible because the market extrapolates the earnings curve of the past two years: the analyst consensus (9 estimates, data as of July 18, 2026) averages 1.1 on the scale from 1 (strong buy) to 5 (sell) — it hardly gets more unanimous, and for a stock that has multiplied twentyfold in four years, such a chorus is more backing vocals than second opinion. The balance sheet bears no blame: after the November 2025 refinancing, a single $700 million bond (5.625 percent coupon, due 2034) sits against $294.8 million of cash and $793.8 million of total liquidity; interest coverage runs above 13. The math you have to check is a different one: a P/E of 62 on earnings that may be cyclically inflated is the most expensive combination in markets — peak multiple times peak margin. When the cycle turns, both factors fall at once.
Opportunities and risks at a glance
What speaks for Carpenter Technology:
- Genuine, rare pricing power: SAO revenue up 10 percent (ex surcharges) on 11 percent lower volume in fiscal 2025; adjusted SAO margin lately at 35.6 percent (Q3 FY 2026) — specialty materials with hardly any alternative suppliers.
- Buffett-grade quality in the numbers: return on equity near 25 percent, debt-to-equity 0.38, EBIT margin near 23 percent, Piotroski 8 of 9, Altman Z near 10 (data as of July 18, 2026).
- Structural tailwind: aerospace build rates climbing, record order books at aircraft makers, demand "continues to accelerate" per the 10-Q; the Athens, Alabama expansion addresses the bottleneck.
- A strong cash machine on a clean balance sheet: $287.5 million of adjusted free cash flow in fiscal 2025, $207.3 million in just nine months of fiscal 2026; a single bond ($700 million, due 2034), $793.8 million in liquidity (March 31, 2026).
What speaks against it:
- The valuation prices in a perpetual climb: P/E near 62, price-to-sales near 10, price-to-book near 14, price to free cash flow near 73 (data as of July 18, 2026) — unprecedented territory for a cyclical materials maker.
- Growth without a volume foundation: pounds sold down 10 percent in two fiscal years (214,122 → 192,980 thousand); if price realization turns, there is no second engine.
- A growing concentration: Aerospace and Defense at 51 → 62 → 66 percent of revenue (FY 2023 → FY 2025 → Q3 FY 2026); Boeing production challenges explicitly named as a risk; Medical down 23 percent most recently.
- Concentrated production: highly specialized plants in Reading, Latrobe and Athens with no alternate sites (10-K risk factor); a small specialist workforce, union contracts at two sites.
- Nothing here for income investors: the dividend has been frozen at $0.20 per quarter for years (yield ~0.13 percent), and buybacks primarily offset dilution, per the 10-K.
A human conclusion
Back to the climb trap from the opening. It does not snap shut because the instruments lie — Carpenter\'s instruments are honest: the most profitable year in company history is attested in the annual report, the Buffett criteria are met without tricks, and the pricing power is documented as clearly as a moat can be — "10 percent more revenue on 11 percent less volume." It snaps shut because in a steep climb, two forces feel identical that have nothing to do with each other: your own engine and the updraft. Carpenter\'s engine is real — recipes, furnaces and metallurgists that hardly anyone can replace. So is the updraft: an aerospace supercycle that now carries two thirds of revenue and hangs on build rates that another company in Seattle has to deliver. The price tag — 62 times an earnings figure that is setting records right now — pays for both in advance: the engine and the assumption that the wind never turns. The honest math looks like this: if build rates and price realization hold for even two or three more years and the Athens expansion delivers volume on schedule, earnings grow into the valuation. If not, a peak multiple corrects on a peak margin — and that hurts twice. So read three lines in every quarterly report (10-Q): pounds sold, the aerospace share, and the SAO margin excluding surcharges. What you make of it is your decision. And that is exactly as it should be.
Sources
All original documents used in this analysis — for your own reading:
- Carpenter Technology Corporation — SEC annual report 10-K for fiscal year 2025 (ended June 30, 2025; filed August 12, 2025)
- Carpenter Technology Corporation — SEC annual report 10-K for fiscal year 2024 (filed August 13, 2024)
- Carpenter Technology Corporation — SEC quarterly report 10-Q as of March 31, 2026 (filed April 29, 2026)
- Carpenter Technology Corporation — SEC quarterly report 10-Q as of December 31, 2025 (filed January 29, 2026)
- Complete SEC filing history for Carpenter Technology: EDGAR overview (sec.gov)
- Fundamental data (metrics, quarterly series, valuation, analyst consensus; data as of July 18, 2026), reconciled against the SEC filings.
- Screener and rating data: in-house stock scanner (data as of July 18, 2026), including the Buffett criteria scanner (U.S. selection, rank 9).
Transparency & disclaimer: This analysis is a journalistic contextualization of publicly available information and is not investment advice, not a financial analysis in the regulatory sense and not a solicitation to buy or sell securities. Stock investments carry substantial risks up to and including total loss. All information without guarantee; the data cut-off is noted in the text. The author holds no position in Carpenter Technology shares at the time of publication.
Our Bottom Line at a Glance
- Buffett quality criteria positive
- Every screenable Buffettology criterion met: return on equity near 25 percent, debt-to-equity 0.38, EBIT margin near 23 percent, earnings per share positive and rising in every recent quarter, positive free cash flow — rank 9 in the U.S. selection of our in-house Buffett criteria scanner (as of July 18, 2026); Piotroski 8 of 9, Altman Z near 10.
- Pricing power & earnings dynamics positive
- Diluted EPS up sixfold from $1.14 (FY 2023) to $7.42 (FY 2025), with $7.29 already in 9M FY 2026; fiscal 2025 SAO sales ex surcharges up 10 percent on 11 percent lower volume, adjusted SAO margin lately 35.6 percent (10-K FY 2025; 10-Q as of 03/31/2026) — documented pricing power of a kind the scanner cannot measure.
- Volume base neutral
- Pounds sold down 10 percent in two fiscal years (214,122 → 192,980 thousand); growth rests entirely on the price/mix lever. The Athens, Alabama expansion (FY 2026 capex ~$260 million) is meant to deliver volume — but still has to.
- Aerospace end-market concentration negative
- Aerospace and Defense grew from 51 percent (FY 2023) to 62 percent (FY 2025) and 66 percent of revenue in the quarter ended March 31, 2026; Medical down 23 percent most recently; the 10-Q explicitly names Boeing production challenges as a risk factor. Add concentrated production in Reading, Latrobe and Athens with no alternate sites (10-K Item 1A).
- Valuation negative
- P/E near 62, price-to-sales near 10, price-to-book near 14, price to free cash flow near 73, dividend yield near 0.13 percent (data as of July 18, 2026) — a peak multiple on a cyclical's peak margins; the stock has multiplied roughly twentyfold in four years.
- Balance sheet & capital allocation neutral
- Rock-solid balance sheet: a single $700 million bond (5.625 percent, due 2034), $793.8 million of liquidity, interest coverage above 13 (10-Q as of 03/31/2026) — but barren ground for income investors: the dividend has been frozen at $0.20 per quarter for years, and buybacks primarily offset dilution, per the 10-K.
Carpenter Technology is the rare case where a quality screen and the filings agree — while the price tells its own story: the Buffett criteria are met without asterisks, fiscal 2025 was the most profitable year in the company's 137-year history per the 10-K, and the pricing power (10 percent more revenue on 11 percent less volume in the core segment) is a documented moat. Against that stand a shipment volume that has shrunk for two years, an aerospace concentration grown to 66 percent with Boeing as a named risk, a frozen token dividend — and a price-earnings ratio near 62 that values the cyclical like a growth stock. Whoever invests here is not buying yesterday's quality but the continuation of the aerospace climb at full price. Not investment advice.
What Our Rating Means
- If you don't own the stock
- As long as the question raised in the bottom line stays open, we see no basis for an entry.
- If you hold it in your portfolio
- Our findings offer no acute reason to sell — the checkpoints named remain decisive.
A journalistic assessment by our editorial team at the time of the deep dive, based on public sources — not investment advice and not a solicitation to buy or sell. Your personal circumstances (investment goals, risk capacity, taxes) cannot be taken into account. What our categories mean, how verdicts are formed, and what conflicts of interest exist →
Worth Noting
- CRS made the research list as rank 9 of our in-house Buffett criteria scanner (U.S. selection, 25 U.S. hits out of 104 total, as of July 18, 2026) — part of our series on the top 20 of that selection.
- Scanner metrics (P/E, P/S, P/B, return on equity, EBIT margin, Piotroski, Altman Z) use trailing twelve-month figures as of July 18, 2026; the fiscal year ends June 30, while the scanner's quarterly series follows calendar quarters.
- Price and market-value figures (~$600, ~$29.8 billion) from the July 18, 2026 feed, sanity-checked against trailing twelve-month earnings of roughly $9.50 per share from the SEC filings; analyses are evergreen, daily prices are not a buy argument.
Frequently Asked Questions
Carpenter Technology Corporation (NYSE: CRS, Philadelphia, about 4,500 employees as of June 30, 2025) makes premium specialty alloys from nickel, cobalt and titanium — for jet engines, landing gear, implants and energy equipment. In fiscal year 2025 (ended June 30, 2025), revenue was $2,877.1 million; 62 percent came from the Aerospace and Defense end-use market. The core segment is SAO (melting and rolling mills), alongside PEP (including the Dynamet titanium business).
Mostly through price and mix, not volume: per the annual report (10-K), fiscal 2025 SAO sales excluding surcharge revenue rose 10 percent — on 11 percent lower shipment volume. The company shifts capacity to more complex, higher-priced aerospace alloys. Diluted earnings per share rose from $1.14 (FY 2023) to $7.42 (FY 2025); the first nine months of fiscal 2026 already delivered $7.29.
The screenable criteria from Mary Buffett's "Buffettology," yes: return on equity of about 25 percent (at least 15 required), debt-to-equity of 0.38 (0.5 allowed), EBIT margin near 23 percent (at least 10), earnings per share positive and rising across recent quarters, and positive free cash flow — rank 9 in the U.S. selection of our Buffett criteria scanner (as of July 18, 2026). The moat and the purchase price are explicitly outside the scanner's scope.
Heavily, and increasingly: the Aerospace and Defense end-use market accounted for 51 percent of revenue in fiscal 2023, 62 percent in fiscal 2025 and 66 percent in the quarter ended March 31, 2026 ($534.2 of $811.5 million). No single customer reaches 10 percent of revenue, per the quarterly report, but the filing explicitly names production challenges at The Boeing Company as a risk. The second-largest end market, Medical, shrank 23 percent most recently.
Yes — every quarter since 1906, currently $0.20 per share per quarter. But it has not been raised in years: the filings show the rate unchanged across fiscal years 2023, 2024 and 2025. At a share price near $600 (data as of July 18, 2026), that is a dividend yield of roughly 0.13 percent; the $400 million buyback program primarily offsets dilution, per the 10-K.
By historical standards, yes: as of July 18, 2026, the stock traded at roughly 62 times trailing earnings, 10 times revenue, 14 times book value and 73 times free cash flow — extraordinary for a materials company whose shipment volume has been shrinking. The market is paying in advance for the aerospace supercycle and the pricing power to continue.
Carpenter Technology reports on a fiscal year ending June 30: "fiscal 2025" covers July 2024 through June 2025. The quarter ended March 31, 2026, is therefore already the third quarter of fiscal 2026 — with $7.29 in earnings per share after nine months. Fourth-quarter and full-year fiscal 2026 results are expected in late July 2026.
Found an error?
Did you spot a factual error, an outdated number, or a typo in this deep dive? Let us know briefly — your report goes straight to the editorial team.