Tenable Stock: The Market Value Halved, Cash Flow Hit a Record — and Our Turnaround Check Reads 8 of 8
Cybersecurity firm Tenable sits at rank 1 of our in-house turnaround candidates scanner (U.S. selection): 8 of 8 points on the turnaround check, as of July 18, 2026. Behind that score is a rare constellation: the market value more than halved within a year while operating cash flow climbed to a record $266.8 million and the first quarter of 2026 delivered the first GAAP profit in a long time. We read the annual reports (10-K) and the quarterly report (10-Q) as of March 31, 2026 — and found the counter-evidence there too: a net expansion rate cooling from 111 to 105 percent, shrinking new-customer revenue, almost $900 million of accumulated deficit, and a $350 million loan coming due in 2028. Not investment advice — just a sober reconciliation of what the price narrates with what the cash receipts prove.
 Thomas Mücke
Founder & Publisher
Thomas Mücke
Founder & Publisher
Chart
Interactive price chart (TradingView).
Note: pure fact-based analysis, not investment advice and not a solicitation to buy or sell. All figures without guarantee.
There is an investor trap as old as the ticker tape itself: anchoring. Your brain memorizes a price — the all-time high, your own entry, where the stock stood a year ago — and from then on, everything below it feels like a bargain. "It used to trade above $60!" Tenable Holdings, Inc. (Nasdaq: TENB) is a textbook case: the stock sits a good 55 percent below its all-time high, the market value more than halved within a year — and since the spring of 2026 the share price has roughly doubled within three months (all figures: data as of July 18, 2026). The anchor whispers "cheap," the rally whispers "the train is leaving" — two whispers, and neither is an argument. So let\'s make a deal: we cut both anchors loose and read what Tenable itself filed, under penalty of law, with the U.S. securities regulator, the SEC — the annual reports (10-K) for 2025 and 2024 and the quarterly report (10-Q) as of March 31, 2026. In there you will find a cash register that never noticed the crisis. And a growth engine running more quietly than the turnaround cheer wants to admit. In the end, you decide which of the two findings weighs more.
What Tenable actually does — the building inspector of the digital world
Tenable — founded in 2002 (as predecessor Tenable Network Security) and headquartered in Columbia, Maryland — employs 1,995 people (December 31, 2025) and grew up around a tool almost everyone in IT security knows: Nessus, one of the most widely deployed vulnerability scanners since 1998. The business model fits into one everyday image: Tenable is the building inspector of the digital world — its software walks through the house and writes up the unlocked windows, the jammed locks and the ladder leaning against the back wall before a burglar finds them. The industry now calls this "exposure management": not merely counting individual vulnerabilities, but assessing the total attack risk across IT systems, cloud environments, access rights and, increasingly, AI applications. It is sold as a subscription: 96 percent of revenue is recurring (2025), no single customer accounts for more than 2 percent, and the customer list is substantial — more than 40,000 customers in over 170 countries, including about 65 percent of the Fortune 500 (all figures from the annual report 10-K for 2025).
The roof over everything is called Tenable One — and the annual report explicitly describes it as an AI product:
"Tenable One is an AI-powered exposure management platform that gives enterprises a single, unified view of risk across all types of assets and attack pathways." — "Tenable AI Exposure: Our solution helps organizations identify, assess and reduce security risks associated with the use of artificial intelligence technologies."
— Tenable Holdings, Inc., SEC annual report 10-K for 2025, Item 1 "Business"

Sounds like an AI sticker slapped on? Partly, sure — but in 2025 Tenable demonstrably put money behind it: in June 2025 it acquired Apex Security, per the filing "an innovator in securing the rapidly expanding AI attack surface," for $47.8 million — after Vulcan Cyber in February 2025 ($148.5 million). The competition is still formidable: the annual report names Qualys and Rapid7 as direct rivals, plus CrowdStrike, Palo Alto Networks and Wiz — how richly this market gets priced is something we dissected in our analysis of industry heavyweight Fortinet. Which brings us to the central tension of this analysis, running through every chapter: the cash never confirmed the crisis the price proclaimed — but growth is measurably cooling, and a turnaround check tests direction, not speed.
Where the stock shows up in our scanner
We run roughly 3,500 stocks through our scanners every day. As of July 18, 2026, Tenable appears in six lists — the most important one first: rank 1 in the turnaround candidates scanner (U.S. selection), the only stock with a perfect 8 of 8 on the turnaround check. To replicate it yourself: open the scanner, set the country filter to "US" — the turnaround-check column sorts the list, Tenable sits on top. The model behind it rests on four pillars, and it pays to walk through them concretely. Pillar 1, the crash: the stock must sit at least 50 percent below its all-time high — Tenable is a good 55 percent below. Pillar 2, survival: an Altman Z-Score (a time-tested early-warning system for bankruptcy built from several balance-sheet ratios) outside the acute danger zone, at most one balance-sheet warning flag, positive equity — met, with a caveat we will get to. Pillar 3, the operational turn (4 of 4 points): revenue still growing in the latest quarter (up 9.6 percent), net margin at +0.5 percent above the level of three quarters earlier (−5.9 percent) and above the prior quarter, operating cash flow comfortably positive at $88.0 million for the quarter, and interest coverage clearly improved versus three quarters earlier. Pillar 4, market confirmation (4 of 4): price above the 50-day line, three-month relative strength well above the twelve-month reading, more insider buys (13) than sells (7), and the big funds adding on balance (12 funds increasing, 6 reducing). Honesty requires one footnote: the most recent reported transactions from the executive suite itself were sales — the buying mood comes rather from the boardroom and the funds (all scanner figures: fundamental data, as of July 18, 2026).
The confluence fits the picture: Tenable also appears in the lists insiders buying (net), institutions + insiders accumulating, above the 50/200-day moving averages, power trend and pros 80% — the market has clearly begun to change its mind. But let\'s translate the quality lens of the same data set honestly: the Piotroski F-Score stands at 7 of 9 (a nine-point test for the direction of the books — 7 is good; rock-solid starts at 8), while the Altman Z-Score sits only around 1.5 — historically, the acute danger zone starts below 1.8, and only above 3 does a company count as fundamentally sound. The scanner merely requires a reading outside the acute distress zone for subscription-software balance sheets of this build, and Tenable\'s score is structurally depressed by the large deferred-revenue balances typical of the subscription model — but the point stands: a turnaround check measures the direction of the improvement, not the sturdiness of the foundation. Remember that sentence — it is the key to this stock.
The numbers over the years — honestly appraised
First, what genuinely impresses. Tenable has grown steadily for years: revenue rose from $798.7 million (2023) through $900.0 million (2024) to $999.4 million (2025) — up 11 percent in the latest step, the billion in plain sight. Gross margin holds steady at 78 percent, and the customer base keeps getting more valuable: the number of customers with more than $100,000 in annual contract value grew from 1,721 (year-end 2023) through 1,988 (year-end 2024) and 2,161 (year-end 2025) to 2,204 as of March 31, 2026. Even more impressive is the cash flow statement — the chapter where software companies find it hardest to pose:
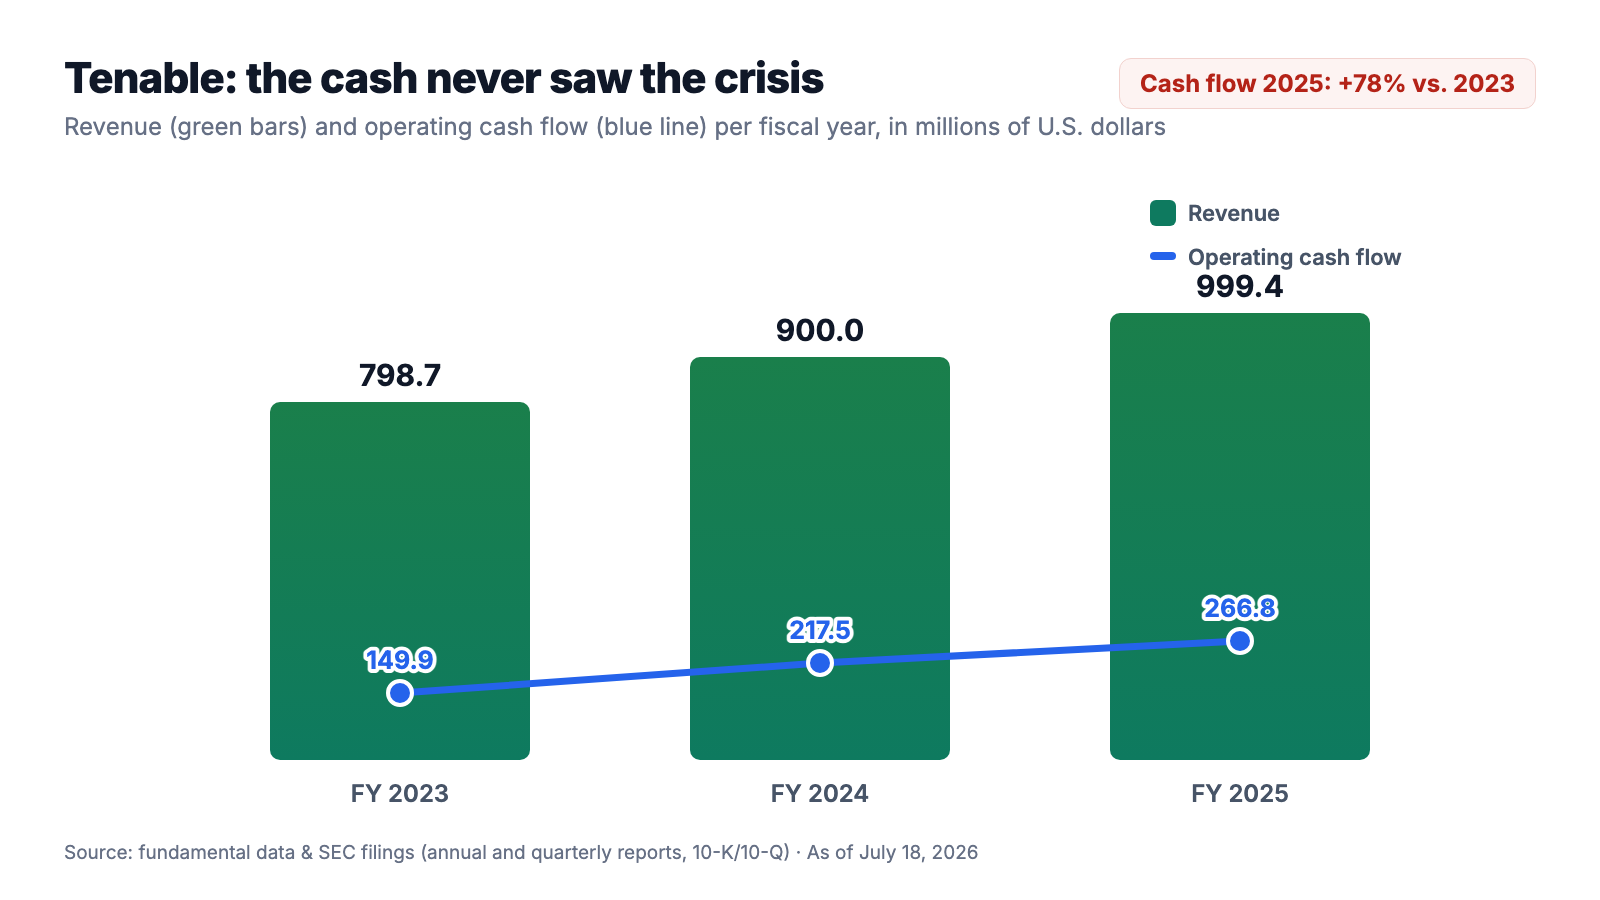
Operating cash flow climbed from $149.9 million (2023) through $217.5 million (2024) to $266.8 million (2025) — more than every fourth revenue dollar sticks as cash, and another $88.0 million flowed in during the first quarter of 2026. The trick behind it is no trick at all but the subscription model: customers pay in advance, and as of March 31, 2026, $866.2 million sat on the balance sheet as cash already collected for revenue not yet earned. And the market? Valued the same company lower and lower: the market value fell — while cash flow kept rising — from roughly $4.2 billion (March 31, 2025) through $3.5 billion (September 30, 2025) and $2.8 billion (December 31, 2025) to roughly $2.0 billion on March 31, 2026 — five losing quarters in a row, cumulatively more than a halving (quarter-end levels per fundamental data). Only then did the market turn: within three months the stock roughly doubled, and as of July 18, 2026, the market value is back around $3.0 billion. The first quarter of 2026 supplied the fundamental soundtrack to the recovery: $8.8 million in operating income and $1.4 million in net income — after a $22.9 million loss in the prior-year quarter. Two special effects belong to the truth: the 2025 comparison base was weighed down by a sad event — after the passing of its long-time chief executive, Tenable recorded $15.5 million in termination benefits, and two co-CEOs (Stephen A. Vintz and Mark C. Thurmond) have led the company since. And a quarter with $1.4 million of profit is a break-even, not a profit surge. One quarter does not make a summer. Still, remember the image: the price told the story of a crisis that never happened in the cash flow statement.
What the filings say — the uncomfortable truths
Uncomfortable truth no. 1: Almost $900 million of accumulated losses — Tenable is profitable only before stock-based compensation
The cash machine has a flip side, and it stands right in the first risk factor of the annual report:
"We have historically incurred net losses, including net losses of $36.1 million, $36.3 million and $78.3 million in 2025, 2024 and 2023, respectively. At December 31, 2025, we had an accumulated deficit of $897.5 million."
— Tenable Holdings, Inc., SEC annual report 10-K for 2025, Item 1A "Risk Factors"

How do a record cash flow and a perpetual loss fit together? Through a line item that plays no role in the cash flow statement and a big one in the income statement: stock-based compensation — a hefty $191.8 million in 2025, roughly twenty times the year\'s entire operating loss ($9.2 million). In everyday terms: the company pays a sizable part of its workforce with freshly cut slices of cake — nothing leaves the till, but your slice of the cake gets a little smaller every year. The company itself states in its outlook: "We expect to continue incurring operating losses in the near term." The buybacks (more below) now keep the share count in check — the weighted share count in the first quarter of 2026, at 115.9 million, was actually below the prior year\'s 120.1 million. But that dilution shield is paid for out of the corporate treasury. Growth paid for with freshly issued shares is never entirely free — not even when the company buys those shares back at a premium afterwards.
Uncomfortable truth no. 2: The growth engine is cooling — in the first quarter of 2026, new-customer revenue actually shrank
Now to the heart of the counter-evidence. A turnaround check measures whether things are getting better — it does not ask where the journey leads. And the direction of growth has pointed the same way for three years: down. Revenue growth fell from +12.7 percent (2024) to +11.0 percent (2025) and +9.6 percent in the first quarter of 2026. Where the growth comes from is itemized in the quarterly report — and this is the passage you should read twice:
"The increase in revenue included an increase of $24.8 million from existing customers as of April 1, 2025, partially offset by a decrease of $1.9 million in revenue from new customers."
— Tenable Holdings, Inc., SEC quarterly report 10-Q as of March 31, 2026, Item 2 "Management's Discussion and Analysis"

So all of the growth currently comes from the existing customer base — and precisely there, the subscription business\'s most important metric has been sliding for years: the dollar-based net expansion rate. It measures how much the customers of twelve months ago spend today — 100 percent would mean: exactly as much as back then; everything above it is genuine additional business from the base.
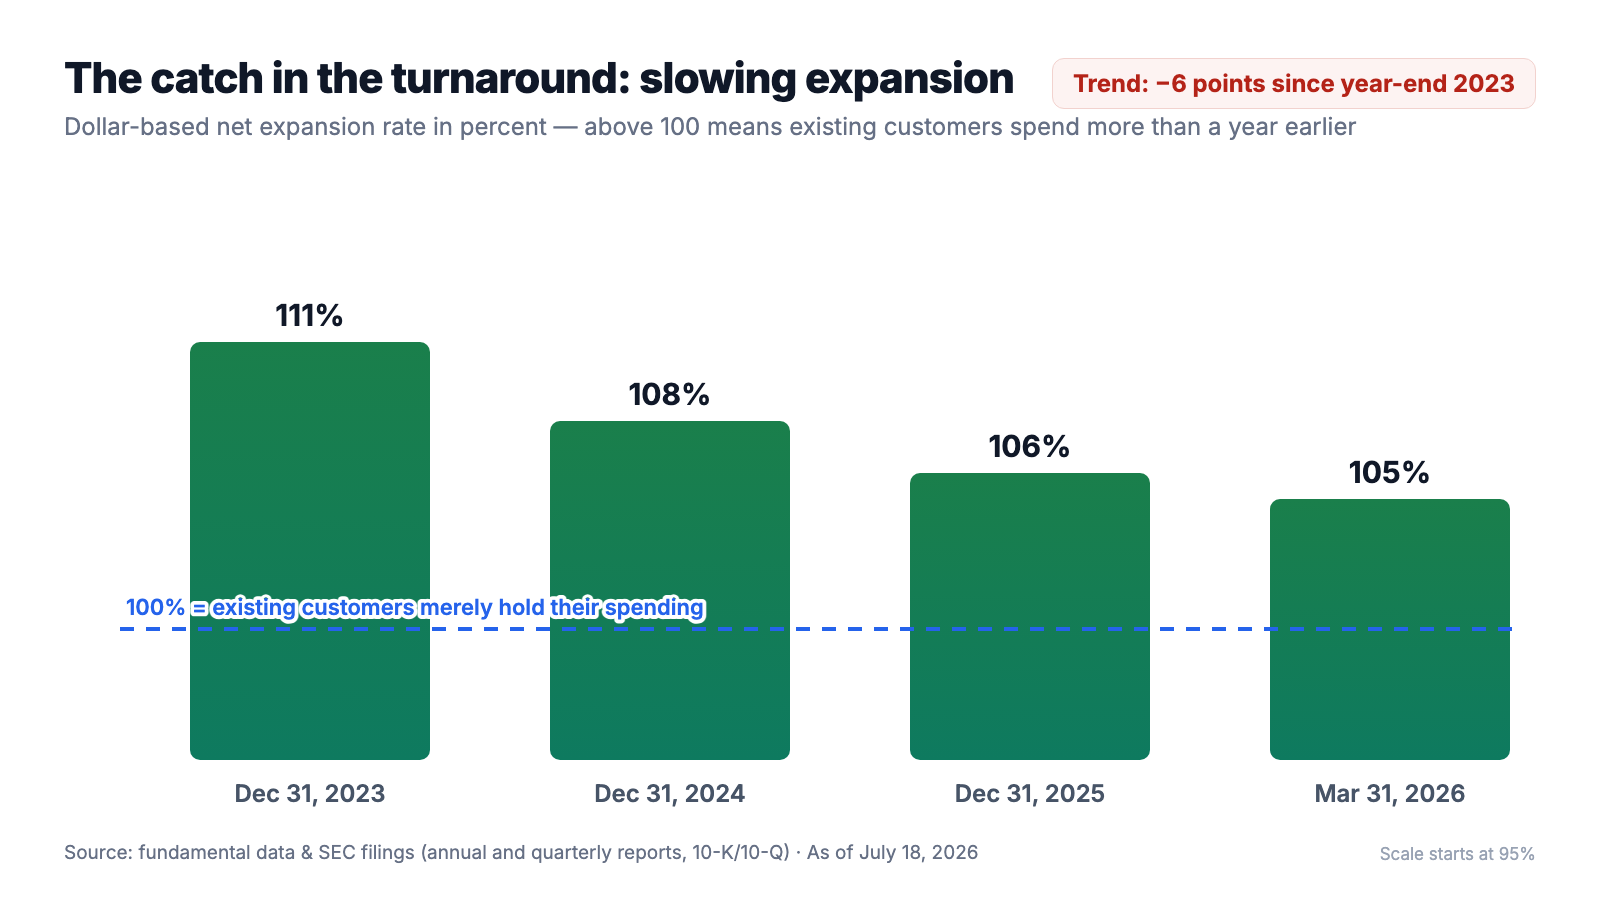
From 111 percent (year-end 2023) through 108 and 106 to 105 percent as of March 31, 2026 — a little less tailwind every year. The number of newly won platform customers also fell on an annual basis three years running: 1,788 (2023, including 104 customers inherited from the Ermetic acquisition), 1,689 (2024), 1,667 (2025). In fairness: the first quarter of 2026 offered a glimmer here — 406 new platform customers after 361 in the prior-year quarter, up 12 percent. But the new logos have evidently become smaller; otherwise their revenue contribution could not shrink. Remember the tension in one sentence: the turnaround check applauds the margin turning — it does not see the engine underneath running slower.
Uncomfortable truth no. 3: The government is a major customer — and Washington is in savings mode
Tenable\'s strongest booking quarter is traditionally the third — and the reason is in the quarterly report: U.S. government agencies prefer to sign their contracts toward the end of the federal fiscal year in September. Exactly this customer group is currently a risk, and the annual report names it with unusual specificity:
"For example, the U.S. presidential administration's priorities and actions to reduce government spending, including, but not limited to, those previously driven by the Department of Government Efficiency, may impact the availability of funding for U.S. government customers as a result of the elimination of departments and personnel."
— Tenable Holdings, Inc., SEC annual report 10-K for 2025, Item 1A "Risk Factors"

A second line from the latest quarterly report fits the same theme: the usual seasonal patterns could shift because macroeconomic conditions and U.S. policy decisions may lengthen "purchasing and approval phases of our sales cycle in 2026." Translated: in precisely the year in which the turnaround narrative needs confirmation, the most reliable large customer may be slower to sign. This is not a concentration risk in the classic sense — no single customer accounts for more than 2 percent of revenue — but a customer group with a common paymaster is, in the end, a common risk factor. A turnaround that depends on Washington\'s September budget has a calendar — and Tenable does not control it.
Uncomfortable truth no. 4: The balance sheet carries little fat — and the company buys back shares as if reserves were there to give away
Finally, the balance sheet. As of March 31, 2026, $360.3 million in cash and short-term investments stood ready — against a secured term loan with a balloon payment of $350.6 million due July 7, 2028, at interest rates most recently around 6.5 percent. On a net basis, almost nothing remains, and equity has shrunk to $248.2 million — against $697.9 million of goodwill from the acquisitions, which would be written down first in a serious downturn. The credit metrics are currently comfortable (the covenant leverage ratio stood at 0.81 as of March 31, 2026, against a limit of 3.5), and cash flow covers the debt service easily. But capital allocation has picked up speed: $492.4 million has gone into the company\'s own shares since November 2023 — $130 million in the first quarter of 2026 alone, 6.1 million shares at monthly average prices between $20.38 and $22.71, right in the trough, with the authorization topped up by another $150 million in January 2026. That may prove a smart countercyclical purchase — as of July 18, 2026, the price sits well above the quarter\'s purchase prices. Still: a company whose cash pile is roughly the size of its loan balloon gives away a dollar of safety with every buyback dollar. Buybacks are returns for good times — reserves are returns for bad ones. Tenable has chosen the former.
Valuation: what the market pays for the turn
Now to the price tag. As of July 18, 2026, Tenable costs about $3.0 billion at the exchange — roughly three times annual revenue, 11 to 12 times operating and free cash flow, and (because buybacks have shrunk equity to $248 million) about 13 times book value. A price-to-earnings ratio still cannot be computed meaningfully for lack of sustained GAAP profits — over the last four quarters the bottom line remains a small loss. For context: a price-to-sales ratio around 3 for a software vendor with a 78 percent gross margin and 96 percent recurring revenue sits historically at the discount end rather than the premium end — the industry\'s growth names cost multiples of that, and at peak pessimism (March 31, 2026, market value around $2.0 billion) the same company traded at twice revenue and roughly seven and a half times cash flow. The professionals\' view has long since brightened: the mean analyst recommendation stood around 1.5 on the five-point scale (1 = buy) across 24 covering firms as of the data cut-off — remarkably much confidence for a stock that was just 55 percent below its all-time high. Remember the mechanism: after the double, you are again paying the price at which the doubters got out in the fall of 2025 — the narrative has turned, the company has not.
Opportunities and risks at a glance
What speaks for Tenable:
- A subscription cash machine: $266.8 million in operating cash flow in 2025 (up 78 percent versus 2023), 96 percent recurring revenue, a 78 percent gross margin, and $88.0 million of cash flow in the first quarter of 2026 alone.
- The operational turn is measurable: Q1 2026 with $8.8 million in operating income and $1.4 million in net income after minus $22.9 million in the prior-year quarter; restructuring small ($2.4 million in the quarter), G&A expenses down sharply.
- Market confirmation across the board: rank 1 in the turnaround scanner (8 of 8), price above the 50- and 200-day moving averages, more insider buys than sells, funds adding on balance (as of July 18, 2026).
- Substance customers rather than walk-in trade: 2,204 customers above $100,000 in annual contract value (March 31, 2026, up 8 percent), about 65 percent of the Fortune 500, no customer above 2 percent of revenue.
- AI as a genuine product line, not just a label: Tenable One as an AI platform, Tenable AI Exposure as a stand-alone product, and targeted acquisitions (Apex Security, Vulcan Cyber) for a combined roughly $196 million in 2025.
What speaks against it:
- Growth has been cooling for years: revenue growth down from 12.7 percent (2024) through 11.0 percent (2025) to 9.6 percent (Q1 2026); the net expansion rate down from 111 to 105 percent; new-customer revenue declining in Q1 2026 (minus $1.9 million).
- GAAP losses as a permanent condition: minus $78.3 / $36.3 / $36.1 million (2023–2025), an accumulated deficit of $897.5 million, $191.8 million of stock-based compensation in 2025 alone — the company itself expects "to continue incurring operating losses in the near term."
- A balance sheet without a cushion: $360.3 million of cash and investments against a $350.6 million loan balloon (July 2028), only $248.2 million of equity against $697.9 million of goodwill, an Altman Z-Score around 1.5 (as of July 18, 2026).
- Aggressive buybacks are consuming the reserve: $492.4 million since late 2023, $130 million in Q1 2026 alone — countercyclically successful so far, but financed from a cash pile barely larger than the debt.
- Dependence on the U.S. government business: the strongest booking quarter is traditionally Q3 thanks to federal agencies — and precisely there, the 10-K flags budget cuts (keyword: Department of Government Efficiency) and longer approval cycles for 2026.
A human conclusion
Back to the anchoring trap from the opening. Its core is not that old prices lie — they are merely meaningless: the $60 mark of yesteryear knows nothing about sliding expansion rates, and the springtime trough knew nothing about $266.8 million of cash flow. What the SEC filings show instead is a company with two faces, both real. Face one: a subscription till that collected record amounts straight through the entire price crisis, a first profitable quarter, buying insiders, funds adding — this stock earned its perfect turnaround-check score honestly. Face two: a growth engine cooled from 111 to 105 percent expansion, new customers contributing less than a year ago, a balance sheet whose cash just covers the loan balloon, and a large customer named Washington that wants to save money. The turnaround scanner measures direction — and the direction is right. Whether the end state is a double-digit-growth platform vendor or a solidly milkable manager of existing accounts with single-digit growth: the coming quarterly reports (10-Q) will decide that, not the tape. Three lines are all you need: the net expansion rate (does it hold 105?), revenue from new customers (does it turn positive again?), and operating cash flow (does it stay above roughly $60 million per quarter?). Cut the anchor loose and read those three lines — what you make of it is your decision. And that is exactly as it should be.
Sources
All original documents used in this analysis — for your own reading:
- Tenable Holdings, Inc. — SEC annual report 10-K for 2025 (filed February 27, 2026)
- Tenable Holdings, Inc. — SEC annual report 10-K for 2024 (filed February 24, 2025)
- Tenable Holdings, Inc. — SEC quarterly report 10-Q as of March 31, 2026 (filed May 5, 2026)
- Tenable\'s complete SEC filing history: EDGAR overview (sec.gov)
- Fundamental data (metrics, quarterly series, market-value history, valuation; data as of July 18, 2026), cross-checked against the SEC filings.
- Screener and rating data: in-house stock scanner (data as of July 18, 2026), including the turnaround candidates scanner (U.S. selection, rank 1, turnaround check 8 of 8).
Transparency & disclaimer: This analysis is a journalistic contextualization of publicly available information and is not investment advice, not a financial analysis in the regulatory sense, and not a solicitation to buy or sell securities. Stock investments carry substantial risks up to and including total loss. All information without guarantee; the data cut-off is noted in the text. The author holds no position in Tenable shares at the time of publication.
Our Bottom Line at a Glance
- Cash machine & customer base positive
- Operating cash flow up from $149.9 million (2023) through $217.5 million to $266.8 million (2025), plus $88.0 million in Q1 2026 alone; 96 percent recurring revenue, a 78 percent gross margin, 2,204 customers above $100,000 in annual contract value (03/31/2026) and no customer above 2 percent of revenue (10-K 2025; 10-Q as of 03/31/2026).
- Operational turn positive
- Q1 2026 with $8.8 million in operating income and $1.4 million in net income after minus $22.9 million in the prior-year quarter; net margin above the level of three quarters earlier, market confirmation via insider buying, funds adding and a price above the moving averages — rank 1 in the turnaround scanner with 8 of 8 points (data as of 07/18/2026).
- Growth momentum negative
- Revenue growth cooled from 12.7 percent (2024) through 11.0 percent (2025) to 9.6 percent (Q1 2026); the dollar-based net expansion rate slid from 111 percent (year-end 2023) to 105 percent (03/31/2026); new-customer revenue declined in Q1 2026 (minus $1.9 million), and annual new platform customer additions fell three years in a row (10-K 2025; 10-Q as of 03/31/2026).
- GAAP profitability & dilution negative
- Net losses of $78.3 / $36.3 / $36.1 million (2023–2025) against an accumulated deficit of $897.5 million; stock-based compensation of $191.8 million in 2025 alone; per the 10-K, the company expects "to continue incurring operating losses in the near term" — buybacks keep the share count in check, but they cost reserves.
- Balance sheet & capital allocation neutral
- Cash and short-term investments of $360.3 million just cover the term loan balloon of $350.6 million (due 07/07/2028); the covenant ratio of 0.81 (limit 3.5) is comfortable, but equity is only $248.2 million against $697.9 million of goodwill; $492.4 million of buybacks since late 2023, $130 million of it in Q1 2026 at prices around $21 — countercyclically successful so far (10-Q as of 03/31/2026).
- Government business & seasonality neutral
- The strongest booking quarter is traditionally Q3 thanks to U.S. government agencies; the 10-K 2025 names federal budget cuts (including those previously driven by the Department of Government Efficiency) and potentially longer purchasing and approval phases in 2026 as a concrete risk — no single-customer concentration (none above 2 percent), but a customer group with a common paymaster.
Tenable is the rare turnaround candidate whose cash never broke: the market value halved within a year to roughly $2.0 billion (March 31, 2026) while operating cash flow rose to $266.8 million and the first quarter of 2026 printed the first black ink in a long time — the perfect turnaround-check score is deserved. Against that stand a growth engine cooling for three years (expansion rate 111 → 105 percent, new-customer revenue declining), structural GAAP losses with $191.8 million of stock-based compensation, a balance sheet without a cushion, and a savings-minded major customer in Washington. Whoever invests here buys the direction of the improvement — not the certainty that the break-even becomes a growth story. Not investment advice.
What Our Rating Means
- If you don't own the stock
- As long as the question raised in the bottom line stays open, we see no basis for an entry.
- If you hold it in your portfolio
- Our findings offer no acute reason to sell — the checkpoints named remain decisive.
A journalistic assessment by our editorial team at the time of the deep dive, based on public sources — not investment advice and not a solicitation to buy or sell. Your personal circumstances (investment goals, risk capacity, taxes) cannot be taken into account. What our categories mean, how verdicts are formed, and what conflicts of interest exist →
Worth Noting
- TENB made the research list as rank 1 of our in-house turnaround candidates scanner (U.S. selection, turnaround check 8 of 8, as of July 18, 2026) — the opener of our series on the top 20 of that selection.
- The turnaround check tests four operational trend criteria (revenue, net margin, cash flow, balance-sheet healing) and four market criteria (50-day line, relative strength, insiders, institutions); mandatory gates are at least a 50 percent distance to the all-time high and an Altman Z-Score outside the acute danger zone — a test of direction, not of quality.
- Market-value history ($4.2 → $2.0 → ~$3.0 billion) from quarter-end levels of the fundamental data and the July 18, 2026 feed, sanity-checked against 115.9 million weighted shares per the 10-Q as of March 31, 2026; analyses are evergreen, daily prices are not a buy argument.
Frequently Asked Questions
Tenable Holdings, Inc. (Nasdaq: TENB, Columbia, Maryland, 1,995 employees as of December 31, 2025) sells software that finds and assesses security vulnerabilities — from the well-known Nessus scanner (since 1998) to the AI-powered Tenable One platform. In 2025 the company generated $999.4 million in revenue, $919.6 million of it from subscriptions; 96 percent of revenue is recurring. Its more than 40,000 customers include about 65 percent of the Fortune 500.
Because crash and improvement coincide: the stock sits a good 55 percent below its all-time high and the market value halved within a year to roughly $2.0 billion (March 31, 2026) — while the first quarter of 2026 swung to an $8.8 million operating profit and insiders and funds bought on balance. In our in-house turnaround scanner (U.S. selection), TENB is the only stock scoring 8 of 8 on the turnaround check (as of July 18, 2026).
Not sustainably under GAAP: 2023 through 2025 brought net losses of $78.3, $36.3 and $36.1 million, and the accumulated deficit reached $897.5 million. The first quarter of 2026 delivered the first small net profit in a while, at $1.4 million. Cash is a different story: $266.8 million of operating cash flow in 2025 — the gap is mostly explained by $191.8 million of stock-based compensation, which depresses profit but costs no cash.
Slower than before: revenue grew 12.7 percent in 2024, 11.0 percent in 2025 and 9.6 percent in the first quarter of 2026, to $262.1 million. The dollar-based net expansion rate slid from 111 percent (year-end 2023) to 105 percent (March 31, 2026), and revenue from new customers actually declined by $1.9 million in the first quarter of 2026 — right now, all of the growth comes from the existing customer base.
Tenable sells AI security as a product: the annual report (10-K) for 2025 describes the Tenable One platform as an "AI-powered exposure management platform," the Tenable AI Exposure product detects risks from customers' AI usage (such as data leakage and insecure configurations), and features like ExposureAI run inside the other products. In 2025 Tenable acquired accordingly: Apex Security (AI security, $47.8 million) and Vulcan Cyber ($148.5 million).
Functional, but without a cushion: as of March 31, 2026, $360.3 million in cash and short-term investments stood against a term loan balloon payment of $350.6 million (due July 7, 2028); equity has shrunk to $248.2 million through buybacks, against $697.9 million of goodwill. The loan covenants are comfortably met at a leverage ratio of 0.81 (limit 3.5), and quarterly operating cash flow of $88.0 million carries the debt service easily.
Moderately, by software standards: as of July 18, 2026, the stock costs about three times annual revenue and 11 to 12 times operating and free cash flow — on a 78 percent gross margin and 96 percent recurring revenue. A price-to-earnings ratio cannot be computed meaningfully for lack of sustained GAAP profits. At the trough (March 31, 2026) the same company traded at twice revenue — the double since then has consumed about half of that discount.
Found an error?
Did you spot a factual error, an outdated number, or a typo in this deep dive? Let us know briefly — your report goes straight to the editorial team.