DXC: The Cheapest Cash Flow on the List — and What Actually Carries It
DXC Technology sits 23rd in our in-house P/FCF ranking. One number explains it: $1,248 million of operating cash flow against a market value of roughly $1.6 billion. But the company itself subtracts $535 million, lease payments take another $188 million, and $294 million arrived only because receivables shrink along with revenue. We read the annual report line by line and count along. By the end you will know which of the four numbers you want to believe.
 Thomas Mücke
Founder & Publisher
Thomas Mücke
Founder & Publisher
Chart
Interactive price chart (TradingView).
Note: pure fact-based analysis, not investment advice and not a solicitation to buy or sell. All figures without guarantee.
The price tag trap
There is a reflex no investor is immune to. You see a small number on a price tag and your mind automatically supplies the word bargain. Not "cheap compared with what?", not "cheap measured how?" — just cheap. That reflex is what makes metric rankings dangerous. They hand you the small number and skip the follow-up question.
At DXC Technology the small number is 1.3. That is the price-to-free-cash-flow ratio shown in our own ranking, data as of July 24, 2026. Translated: the entire company costs roughly what it generates in free cash over about fifteen months. At a healthy business that would be an exclamation mark.
So the deal for this article is simple. We do not accept the small number. We open the annual report, find every line the cash flow comes from, and subtract in order everything that truly cost money. At the end there are four different numbers for the same stock. All four are calculated correctly. Only one of them describes the business.
What DXC actually does
Picture a corporation that does not want to run its own data center. The mainframes that have processed insurance policies since 1994. The servers that run payroll at night. The applications nobody understands anymore but everybody needs. That work is what DXC exists for.
The company was created on April 1, 2017 by merging Computer Sciences Corporation with the services arm of Hewlett Packard Enterprise. Two companies that had grown large by running other people's IT became one. Roughly 115,000 people in 60 countries work there (as of March 31, 2026), across three segments:
- Global Infrastructure Services — the core and the largest piece: data centers, mainframes, networks, cloud migrations, workplace support. Fiscal 2026 revenue: $6,342 million, segment profit $432 million (6.8 percent margin).
- Consulting & Engineering Services — consulting, software engineering, application modernization. Revenue $5,023 million, segment profit $518 million (10.3 percent margin).
- Insurance Software & Services — software and operations for life, property and casualty and reinsurance carriers. The smallest segment but the one with the best margin: revenue $1,279 million, segment profit $129 million (10.1 percent margin).
DXC closes its books on March 31. So "fiscal 2026" largely covers calendar 2025 — a trap every comparison table walks into when it lines up calendar years. We therefore name the fiscal year and the reporting date everywhere.
The equity story has been "turnaround" for years. A new chief executive, Raul Fernandez, has led the company since February 1, 2024. He redrew the segments effective April 1, 2025 and put the word AI at the center. The sober counterweight is revenue — and revenue points the other way, as the next chapter shows.
How the stock landed on our desk
DXC did not reach our list through a headline but through a sort. Our in-house stock scanner P/FCF Ranking filters every stock with positive free cash flow and a price-to-free-cash-flow ratio of at most 10, then sorts them — the cheapest first.
Here is the snapshot, retrieved on July 27, 2026 (list computed July 26, 2026):
- 23rd among U.S. names, with a displayed value of 1.3
- 544 U.S. stocks pass the criteria in total; the page shows the 25 strongest hits
- The German edition of the same list covers every market and counts 835 hits on the same day, with European names carrying even lower ratios ahead of DXC
To reproduce it: open the "Stocks" section, choose "Scanner", click "P/FCF Ranking", read the P/FCF column from the top. These lists are recalculated daily. Rank 23 is a dated snapshot, not a permanent state — the next run may show a different row.
And one honest caveat before we keep counting: a metric ranking is not a quality judgment. It sorts the universe by a single figure. Whether that figure delivers what it promises is decided by the annual report, not by the list. Which is exactly why this article exists.
What does the metric measure? Market value divided by free cash flow over the last four quarters. A ratio of 4 equals a free-cash-flow yield of 25 percent; a ratio of 20 equals 5 percent. The lower the better — provided the cash flow is durable and not inflated by one-off effects. That proviso is what the next chapters are about. At a shrinking IT services provider there are two perfectly legal ways to get money into the till that have nothing to do with earned profit: you sell receivables to banks, and you release working capital because the business is getting smaller. Both are in play at DXC.
The numbers over the years — fairly credited
Start with what DXC genuinely does well. This company reliably produces cash. Operating cash flow was $1,361 million in fiscal 2024, $1,398 million in fiscal 2025 and $1,248 million in fiscal 2026. On the company's own definition, $713 million of that was free — more than the $687 million a year earlier. At a shrinking business that is not a given.
The balance sheet moved too. Total debt fell during fiscal 2026 from $3,876 million to $3,552 million. Liquidity stands at $4.7 billion, of which $1.7 billion is cash and $3.0 billion is an undrawn revolving credit facility whose maturity was extended on October 23, 2025 to November 1, 2030. All financial covenants were met at the reporting date, and the credit ratings sit at BBB− (Fitch and S&P) and Baa2 (Moody's, negative outlook) — investment grade, if barely.
Adjusted earnings, which strip out the one-off items, came in at $3.23 per diluted share, only slightly below the $3.43 of the prior year. Against a closing price of $10.05 on July 24, 2026, that is a ratio of roughly 3.
Now the other side of the same coin — and it is uncomfortable:
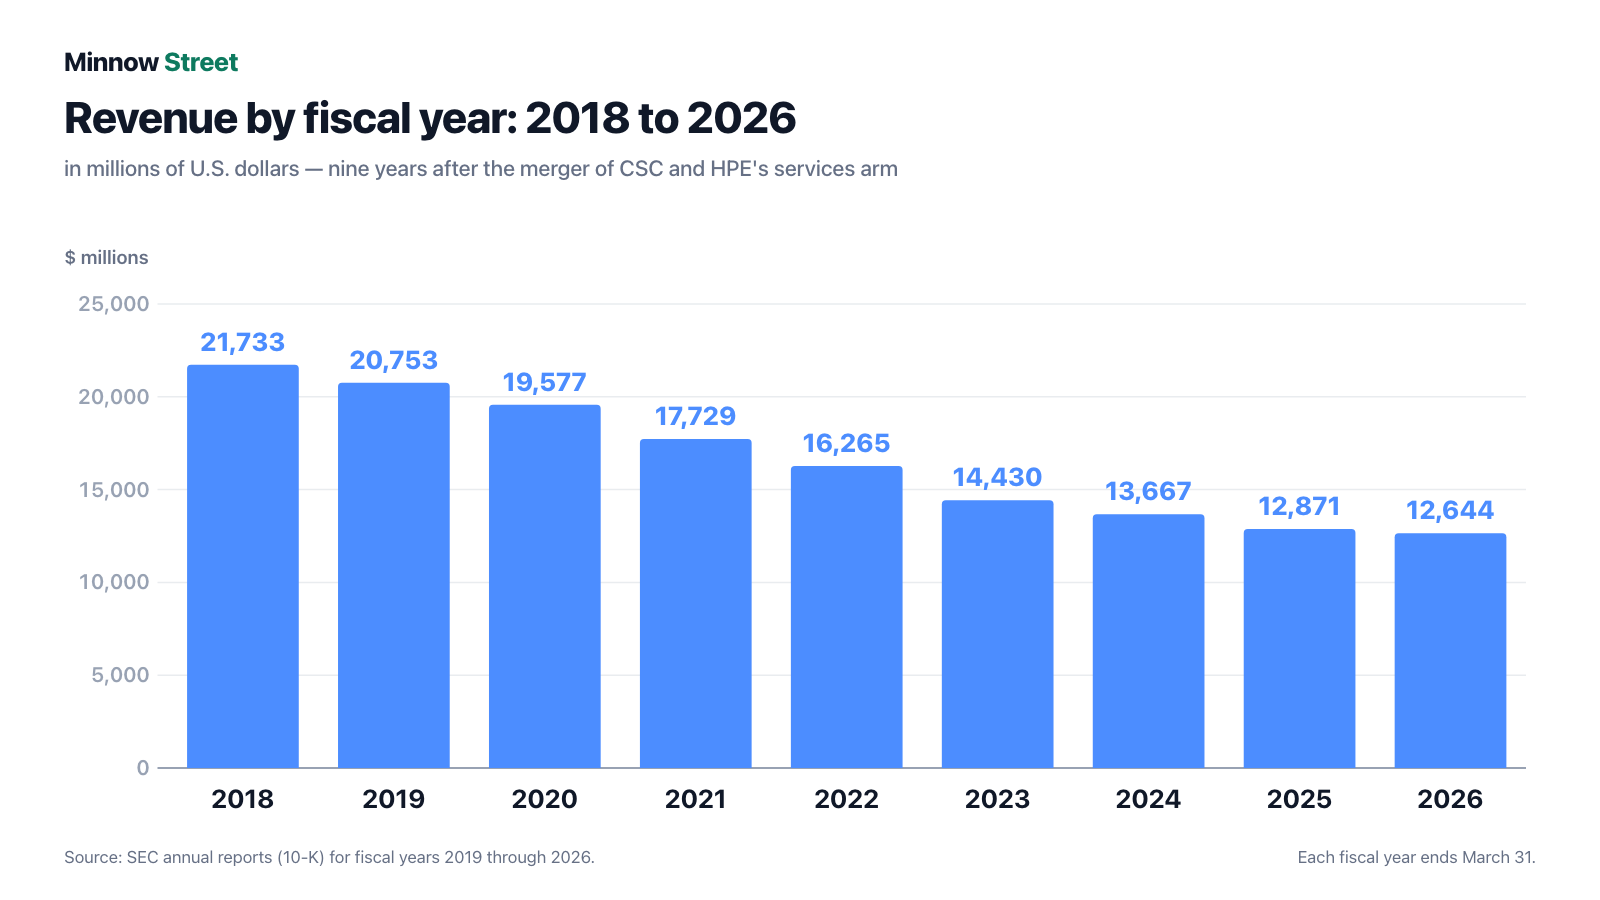
The series in numbers, in millions of dollars by fiscal year: 21,733 (2018), 20,753 (2019), 19,577 (2020), 17,729 (2021), 16,265 (2022), 14,430 (2023), 13,667 (2024), 12,871 (2025) and 12,644 (2026). All nine figures come from the structured data of the respective annual reports.
From $21,733 million in fiscal 2018 — the first full year after the merger — to $12,644 million in fiscal 2026. That is 41.8 percent less, or $9,089 million of annual revenue that has disappeared. Not one year in between showed growth. Part of it was intentional: the U.S. public sector business was spun off in 2018, and several smaller divestitures followed. The larger part was not.
Even the latest figure stands on soft ground. The 1.8 percent decline in fiscal 2026 looks harmless — but it includes a 3.1 percentage point currency tailwind. Organically, revenue fell 4.8 percent. In the United States, the single most important market, it fell 9.9 percent: from $3,560 million to $3,209 million.
The leading indicator confirms it. DXC reports contract awards divided by annual revenue. That book-to-bill ratio was 0.98 in fiscal 2026 after 1.03 the year before. Below 1.0 means less is coming in than is being worked off. Anyone wondering what fiscal 2027 revenue will look like will find more of an answer in that single figure than in any strategy slide. We saw the same pattern at TTEC Holdings — another services provider that looks dirt cheap precisely because the business is shrinking.
What the filings say
Uncomfortable truth No. 1: free cash flow is a matter of definition
This is where the small number from the opening breaks. The annual report says it itself, in a single sentence:

"Cash generated from operations was $1,248 million, less capital expenditures of $535 million, resulted in free cash flow of $713 million, compared to free cash flow of $687 million in the prior-year"
— DXC Technology, SEC annual report 10-K for fiscal 2026, Item 7, Key Metrics
$535 million of capital expenditures — not $212 million. The statement of cash flows shows how that total is built: $212 million for property and equipment, $217 million for software purchased and developed, and $106 million for transition and transformation contract costs. All three sit in the investing section, and all three consume real cash. Deduct only the first line — as many data providers do — and you get $1,036 million instead of $713 million.
There is more. A data center operator finances a meaningful share of its hardware through leases. Those payments do not appear under investing but under financing: $188 million of payments on finance leases and borrowings for asset financing in fiscal 2026, after $298 million the year before and $430 million the year before that. For the company that decline is an achievement — it is deliberately winding this financing down. For our calculation it is still cash going out the door for equipment.
And finally the line that should make anyone pause at a shrinking company: "Decrease in receivables: 294". Receivables fell, and that put $294 million into the till. The year before it was $320 million, the year before that $176 million. Over three years, $790 million from releasing working capital. That is not a trick but the logical consequence of falling revenue: bill less, and fewer invoices are outstanding. It just does not repeat forever — at some point receivables are as small as the business.
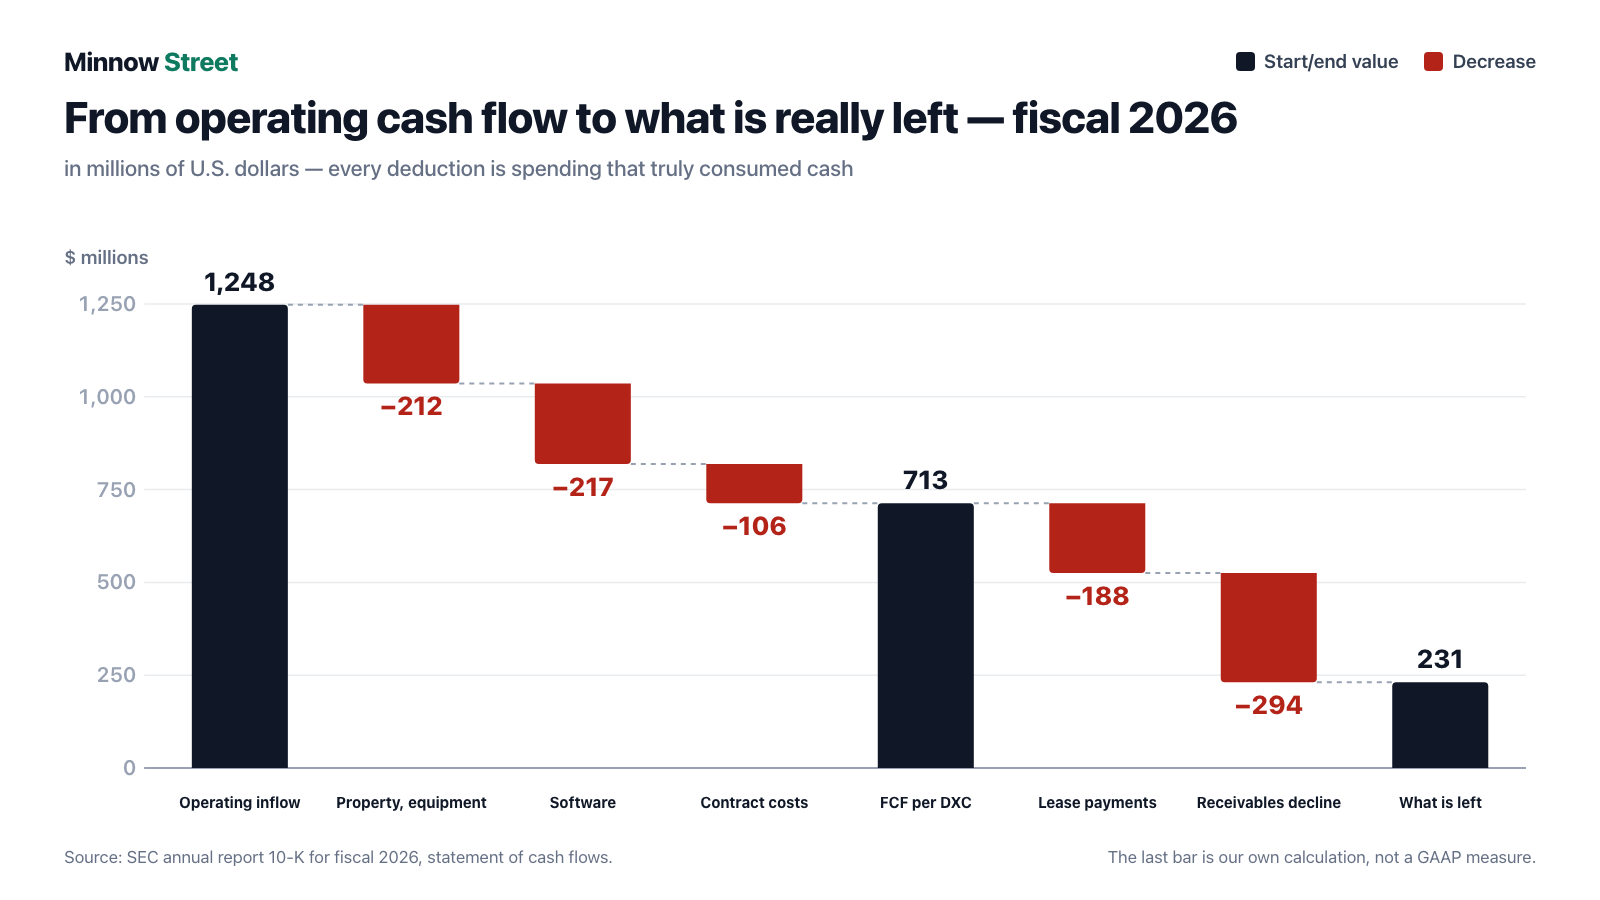
Of $1,248 million, this strict count leaves $231 million — 1.8 percent of revenue. Is the strict count the only correct one? No. DXC's $713 million is derived cleanly too, and winding down lease financing really is progress. But anyone buying a stock because a metric reads 1.3 should know that the same metric, honestly counted, can also read 7.1.
Uncomfortable truth No. 2: $367 million of receivables are not on the balance sheet
The second source of cash that does not come from the business sits in Note 4. DXC runs a receivables sales facility with a maximum of $400 million. Sold receivables disappear from the balance sheet entirely under the accounting rules.

"As of March 31, 2026, the total availability under the Receivables Facility was $367 million and the amount sold to the Purchasers was $367 million, which was derecognized from the Company's balance sheet."
— DXC Technology, SEC annual report 10-K for fiscal 2026, Note 4 "Receivables"
For scale: $367 million is roughly 22 percent of the market value and roughly 12 percent of total receivables of $2,973 million. While the facility runs, that money is free. If it lapses, the receivables come back onto the balance sheet and tie up capital.
And now the sentence immediately before it, which should not be skimmed: the facility was amended on July 25, 2025, moving the termination date to July 24, 2026. As of this analysis that date has just passed. Between the annual report of May 8, 2026 and July 27, 2026, no SEC filing mentions a renewal — which does not mean there was none: such contract extensions are rarely reportable events. It means the answer sits in the next quarterly report, scheduled for July 30, 2026. We logged the point as a side find with exactly that question attached.
Uncomfortable truth No. 3: $290 million of tax on $318 million of profit
The reported price-to-earnings ratio of roughly 100 is neither a typo nor a valuation problem — it is a tax problem. In fiscal 2026, DXC earned $318 million before taxes. Of that, $290 million went to tax authorities. What remained was $28 million, of which $18 million belongs to common stockholders — $0.10 per diluted share, after $2.10 the year before.
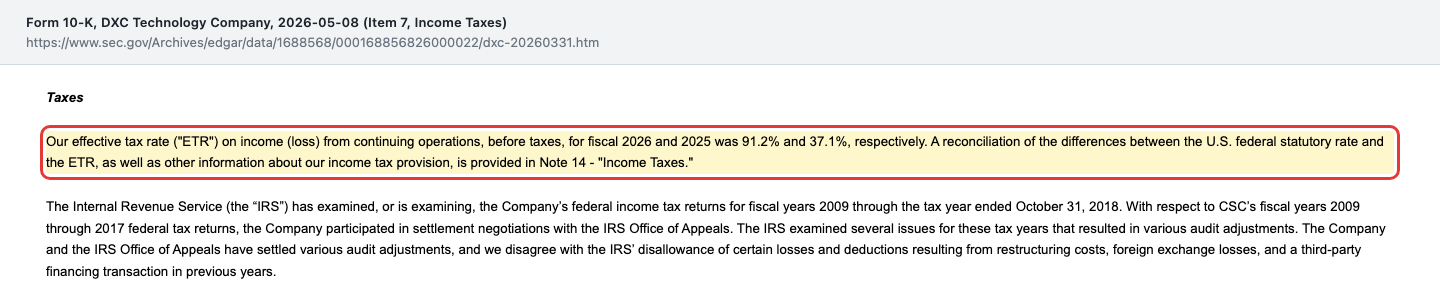
The cause appears a few pages later and is structural rather than one-off: DXC carries a valuation allowance of approximately $2.4 billion against deferred tax assets because it is uncertain whether they can ever be used. Deferred tax assets are, put simply, stored-up loss carryforwards — credit with the tax office that you can only redeem by earning future profits. Writing off $2.4 billion of them says something implicit about your own profit expectations. And because DXC earns profits in some countries while losing money in others, it pays tax where it earns without being able to net the losses elsewhere. That is the engine behind an effective rate of 91.2 percent, up from 37.1 percent.
Rule of thumb: a price-to-earnings ratio is only as good as the earnings in the denominator. Here the tax line took them apart.
Uncomfortable truth No. 4: the growing segment has the weakest order intake
The insurance segment is the hope. It is the only one of the three that grew in fiscal 2026: up 5.4 percent to $1,279 million, and up 3.6 percent organically. Insurance software is sticky, contracts run for years, and a sale of this segment would be the most obvious catalyst for anyone hoping for a re-rating.
Two numbers temper the enthusiasm. First, segment profit fell 20.4 percent to $129 million — more revenue, less profit. Second, the book-to-bill ratio in this segment is 0.76, the worst of the three. For comparison: Consulting & Engineering stands at 1.10 and the large infrastructure segment at 0.94. The growth engine is filling its order book more slowly than its shrinking siblings.
On June 11, 2026, DXC held an investor day in New York and furnished the presentation as a current report (8-K, Item 7.01). What was said there is therefore on the record — but the numbers for the current fiscal year only arrive with the quarterly report on July 30, 2026.
Uncomfortable truth No. 5: the company's own stockholders said no
The annual meeting took place on July 21, 2026. The board wanted to add 20 million shares to the employee equity plan — by its own account in the proxy statement, 12.1 percent of all outstanding shares. Stockholders declined:

67,900,669 votes against, 49,829,849 in favor. For investors that is good news at first: the 12.1 percent dilution does not happen. But there is a flip side in the same stack of documents. The proxy statement calls the 2017 plan the sole active plan for granting equity awards to employees and states explicitly that without approval it terminates on March 30, 2027, before the start of fiscal 2028. An IT services provider competing for engineers that cannot grant equity from spring 2027 must either pay in cash or win a new vote. Paying in cash hits exactly the cash flow this article is about.
A third number from the same document completes the picture: executive compensation was approved by 58,933,641 votes to 58,851,361 — an approval rate of 50.03 percent. At a contented shareholder base that figure is usually above 90 percent.
The buyback history fits. In fiscal 2026, DXC repurchased 17,714,569 of its own shares at an average price of $14.11, spending $250 million — roughly 10 percent of all shares. On July 24, 2026 the stock closed at $10.05, 29 percent below that average. $342 million of the authorization remains, roughly 21 percent of today's market value. There has been no dividend since the first quarter of fiscal 2021, and the annual report states that the company does not intend to reinstate it.
Valuation — four calculations, one company
With 163,479,858 shares outstanding (cover page of the annual report, as of May 1, 2026) and a closing price of $10.05 on July 24, 2026, market value comes to roughly $1.64 billion. Cross-check: 163.5 million times $10.05 equals $1.643 billion — consistent with the figure from the fundamental data. Add $3,552 million of debt and subtract $1,737 million of cash, and enterprise value lands near $3.46 billion.
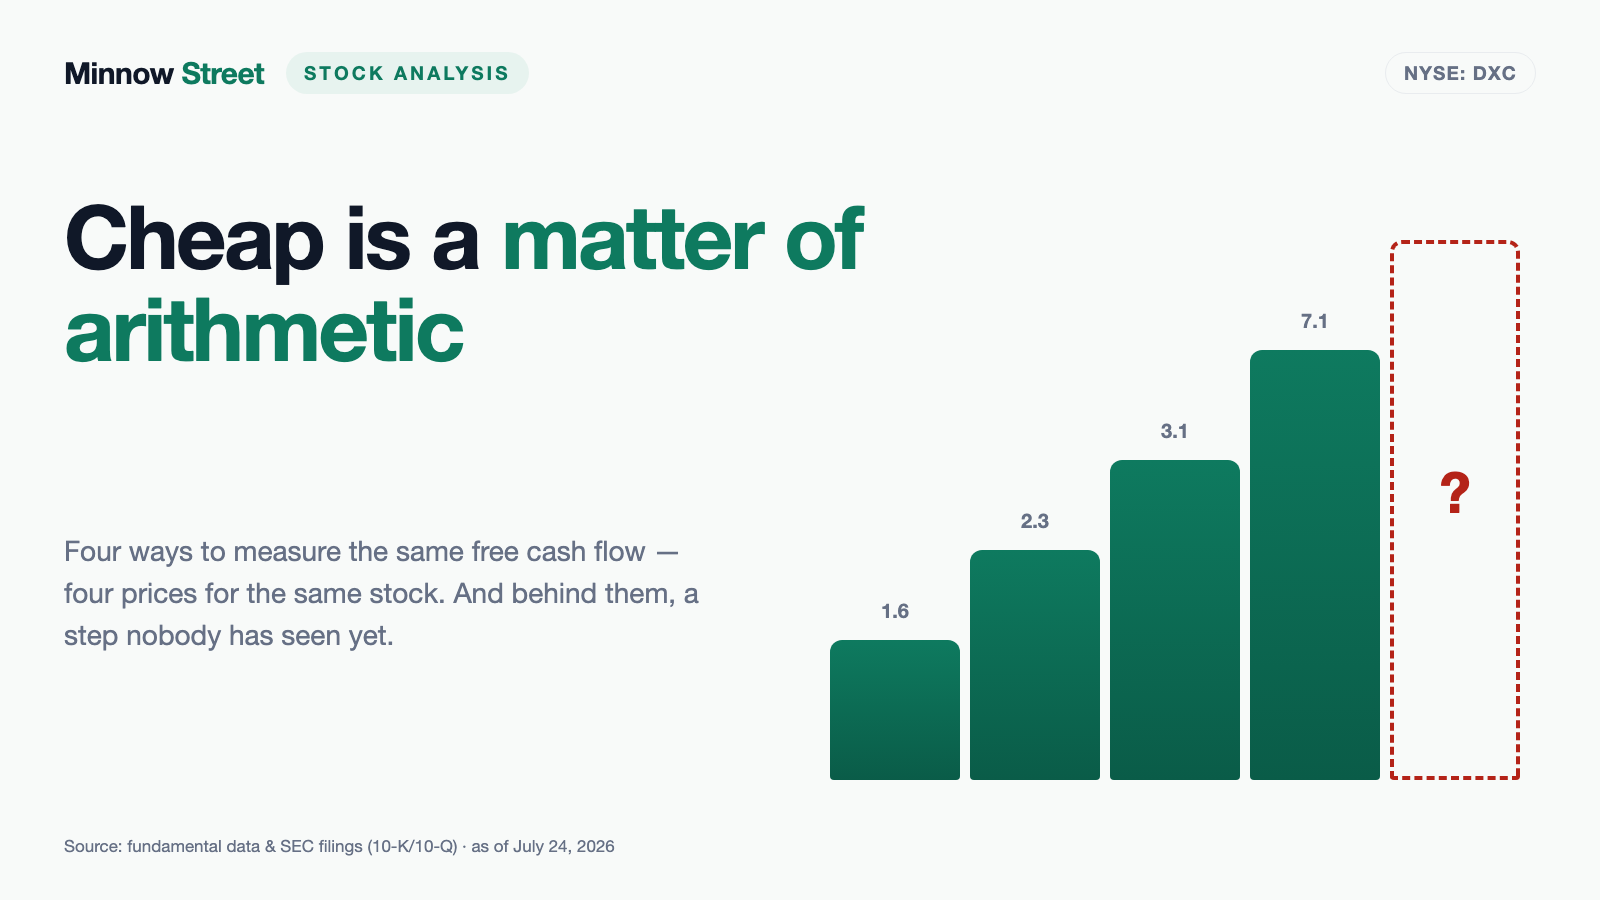
Now the four calculations for the same stock, all against the same market value:
- 1.6 — against cash flow after deducting property and equipment only ($1,036 million). That is how many data providers count.
- 2.3 — against free cash flow on DXC's own definition ($713 million).
- 3.1 — additionally after finance lease and asset financing payments ($525 million).
- 7.1 — additionally without the one-off inflow from the receivables decline ($231 million).
Even the strictest reading sits below what the market pays for an average company. The other metrics agree: the price-to-sales ratio is 0.13 and the price-to-book ratio 0.56 (DXC stockholders equity of $2,941 million as of March 31, 2026). Enterprise value equals 3.6 times adjusted EBIT of $970 million. Put differently, the market values each of the roughly 115,000 employees at about $14,300.
The flip side is in the balance sheet. The equity ratio is 22.8 percent, debt exceeds equity by about a quarter, and the Altman Z bankruptcy warning score sits at 0.96, below the usual threshold. That score deserves caution at a services company with no inventory and no factories: it rewards fixed assets DXC does not need. The hard facts speak more gently — $1.7 billion of cash, a $3.0 billion undrawn facility to November 2030, all covenants met, investment-grade ratings. This is not a liquidity problem. It is an earnings problem.
How the professionals see it: ten firms cover the stock (data as of July 27, 2026). None recommends buying, eight say hold, two say sell. The average price target is $11.29, roughly 12 percent above the July 24 close. Price targets are opinions with an expiry date, not measurements — we treat them as sentiment. What stands out here is less the level than the unanimity: nobody dares recommend this stock, and almost nobody dares write it off.
A comparison with another name from the same corner sharpens the picture: FIS also sells software to large customers but trades at roughly 13 times free cash flow. The difference is not a whim of the market — it is the sign in front of the revenue growth rate.
Opportunities and risks at a glance
Opportunities
- The cash flow is real and steady: $1,361 million, $1,398 million and $1,248 million of operating cash flow in fiscal 2024 through 2026, with free cash flow on the company's definition rising from $687 million to $713 million.
- Valuation cushion at every level: 0.13 times annual revenue, 0.56 times equity, 3.6 times adjusted EBIT. On adjusted earnings of $3.23 per share the price-to-earnings ratio is roughly 3.
- The balance sheet is getting lighter: debt cut from $3,876 million to $3,552 million, lease financing deliberately wound down ($188 million of payments after $430 million in fiscal 2024), revolving facility secured to November 2030.
- The rejected plan increase prevents 12.1 percent dilution, and $342 million of buyback authorization remains — roughly 21 percent of the market value.
- The insurance segment is the only one growing (up 5.4 percent to $1,279 million) and would be a separately valuable business on its own.
- Goodwill on the balance sheet is down to $527 million. The large write-offs of the past are done — the drop height of another impairment is small.
Risks
- Nine fiscal years of falling revenue, most recently down 4.8 percent organically and down 9.9 percent in the United States. Book-to-bill of 0.98 after 1.03 means the decline mathematically continues.
- The low ratio from the ranking rests on a generous definition. Counted strictly, only $231 million remained in fiscal 2026 — 1.8 percent of revenue.
- $294 million of the cash flow came from releasing receivables, an effect that ends when the business stops shrinking and that says nothing about earning power.
- $367 million of receivables are derecognized through a facility whose term, per the annual report, ended on July 24, 2026. No renewal is documented in the SEC record through July 27, 2026.
- An effective tax rate of 91.2 percent and a $2.4 billion valuation allowance against deferred tax assets show that pre-tax profit reaches stockholders only in fragments.
- The sole employee equity plan terminates on March 30, 2027 after stockholders rejected the extension. Say-on-pay approval was 50.03 percent — a signal the board will have to answer.
- An equity ratio of 22.8 percent, debt above equity, and a negative Moody's outlook on Baa2. A downgrade below investment grade would raise financing costs immediately.
- No dividend since fiscal 2021, and the annual report states none is intended. The fiscal 2026 buyback was executed at an average of $14.11 — 29 percent above the July 24, 2026 close.
A human conclusion
Back to the price tag trap. It works precisely because the small number does not lie. A price-to-free-cash-flow ratio of 1.3 is correctly calculated from publicly available data. It simply answers a different question than the one you are actually asking. It answers: how much cash passed through the till last year, measured against market value? Your question is: how much of that does this company actually earn — and for how much longer?
The honest answer is spread across three places in the same annual report. $713 million on the company's own definition. $525 million after lease payments. $231 million once you strip out the money that arrived only because the business is getting smaller. None of these numbers is invented, and none of them alone is the truth. Together they draw a picture: a company that still moves substantial sums, has shrunk for nine years, can barely steer its own tax burden, and whose stockholders have just raised their hands in protest.
DXC is not a company about to fall over — $1.7 billion of cash and a credit line to 2030 are too solid for that. It is a company where the decisive question is not "cheap or expensive?" but "when does the shrinking stop?". Book-to-bill of 0.98 says: not yet. The next quarterly report on July 30, 2026 will contain three lines worth more than any valuation metric — organic revenue, contract awards, and the receivables facility note.
What you make of that is your decision. And that is exactly as it should be.
Sources
- Annual report 10-K for fiscal 2026 (filed May 8, 2026, most recent periodic report) — business and segments (Item 1), risk factors (Item 1A), key metrics and liquidity (Item 7), statement of cash flows, balance sheet, Notes 4 (receivables), 5 (leases), 10 (debt), 12 (restructuring), 14 (income taxes), 15 (stockholders equity), 19 (segments)
- Quarterly report 10-Q for December 31, 2025 (filed January 30, 2026) — segment descriptions, interim fiscal 2026 figures
- Current report 8-K of July 22, 2026, Item 5.07 — results of the annual meeting held July 21, 2026
- Proxy statement DEF 14A of June 4, 2026 — Proposal 4 on the 2017 equity plan: 20 million shares, 12.1 percent of outstanding shares, plan termination on March 30, 2027
- Current report 8-K of May 7, 2026, Item 2.02 — fourth quarter and full year fiscal 2026 results
- Current report 8-K of June 11, 2026, Item 7.01 — investor day in New York
- Annual reports 10-K for fiscal 2018 through 2026 — revenue history from the structured XBRL data of each report
- Fundamental data (metrics, price history, analyst estimates), data as of July 24 to 27, 2026
This analysis is journalistic interpretation of publicly available filings and is not investment advice. It is not a solicitation to buy or sell securities. Share prices can move sharply and a total loss is possible. All figures come from the sources named above and carry the reporting date stated there; price figures are dated valuation anchors, not buy arguments. The author holds no position in DXC Technology at the time of publication.
Our Bottom Line at a Glance
- Cash generation positive
- DXC produces cash reliably: $1,361 million of operating cash flow in fiscal 2024, $1,398 million in fiscal 2025 and $1,248 million in fiscal 2026. Free cash flow on the company definition rose from $687 million to $713 million. At a business that has shrunk for nine years, that is notable.
- Quality of that cash flow negative
- Of the $1,248 million in fiscal 2026, $294 million came from a decline in receivables — a consequence of falling revenue, not earnings. Deduct the $188 million of finance lease and asset financing payments hidden in the financing section and $231 million remains, or 1.8 percent of revenue. Over three years, $790 million came from the receivables decline alone.
- Revenue trend negative
- Nine consecutive fiscal years of falling revenue: from $21,733 million in fiscal 2018 to $12,644 million in fiscal 2026, a decline of 41.8 percent. Most recently down 4.8 percent organically and down 9.9 percent in the United States. Book-to-bill was 0.98x in fiscal 2026 after 1.03x, so the decline mathematically continues.
- Earnings quality and taxes negative
- An effective tax rate of 91.2 percent in fiscal 2026 (prior year 37.1 percent) left only $18 million of $318 million of pre-tax income for common stockholders — $0.10 per diluted share after $2.10. Behind it sits a valuation allowance of roughly $2.4 billion against deferred tax assets whose use is uncertain. On an adjusted basis DXC reports $3.23 per share.
- Balance sheet and funding neutral
- Debt fell during fiscal 2026 from $3,876 million to $3,552 million, liquidity stands at $4.7 billion ($1.7 billion cash plus a $3.0 billion revolver to November 1, 2030), and all covenants were met. Against that: an equity ratio of 22.8 percent, a negative Moody's outlook on Baa2, and $367 million of receivables derecognized through a facility that ran to July 24, 2026.
- Valuation and shareholder relations neutral
- Roughly $1.64 billion of market value (163,479,858 shares, closing price $10.05 on July 24, 2026) equals 0.13 times annual revenue and 0.56 times equity — and 1.6 to 7.1 times free cash flow depending on the definition. At the same time, stockholders rejected a 20 million share increase to the equity plan on July 21, 2026 (12.1 percent of shares) and approved executive pay with only 50.03 percent.
DXC runs data centers, mainframes and applications for other corporations and still moves large sums: $1,248 million of operating cash flow in fiscal 2026 against roughly $1.64 billion of market value. That is exactly what puts the stock 23rd in our in-house P/FCF ranking. Anyone who counts, though, finds three deductions that change the picture: $535 million rather than $212 million of capital expenditures on the company own definition, $188 million of lease payments, and $294 million that arrived only because receivables shrink with revenue. What remains is $231 million. Behind it sits a business with nine years of falling revenue, a 91.2 percent tax rate, and a shareholder base that has just refused the board its equity plan increase. Not investment advice.
What Our Rating Means
Open questions
The business works in principle, but one material question is open. As long as it stays open, our findings do not carry a quality verdict.
The business carries itself: DXC generated $1,248 million of operating cash flow in fiscal 2026, cut debt from $3,876 million to $3,552 million, met every financial covenant, holds $4.7 billion of liquidity and carries an investment-grade rating from all three agencies. There is no going-concern flag, no negative equity, and after the write-offs of the past only $527 million of goodwill remains on the balance sheet — this is not a solvency risk. What remains open is the decisive operating question: revenue has fallen for a ninth consecutive year, most recently down 4.8 percent organically, and with book-to-bill at 0.98x there is no evidence that fiscal 2027 breaks the pattern. Add an effective tax rate of 91.2 percent, a cash flow that owes $294 million to a decline in receivables, and $367 million of derecognized receivables under a facility whose term ended on July 24, 2026. As long as the turn shows up in neither revenue nor order intake, this is yellow, not green. That the stock also looks cheap does not change the color: price is not a quality attribute.
A journalistic assessment by our editorial team at the time of the deep dive, based on public sources — not investment advice and not a solicitation to buy or sell. Your personal circumstances (investment goals, risk capacity, taxes) cannot be taken into account. What our levels mean, how verdicts are formed, and what conflicts of interest exist →
Worth Noting
- DXC reached our research list through the in-house stock scanner "P/FCF Ranking": 23rd among U.S. names with a displayed value of 1.3, out of 544 hits with 25 rows shown, retrieved on July 27, 2026 (list computed July 26, 2026). The German edition of the list covers every market and counted 835 hits on the same day, with European names carrying lower ratios ahead of DXC. These lists are recalculated daily — the rank and the ratio are a dated snapshot, not a permanent state.
- The scanner filters every stock with positive free cash flow and a price-to-free-cash-flow ratio of at most 10 and sorts ascending. Such a metric ranking is a sort of the universe, not a quality judgment; the displayed value of 1.3 rests on a cash flow definition that deducts only the $212 million spent on property and equipment. On DXC own definition ($535 million of capital expenditures) the ratio works out at 2.3, after lease payments 3.1, and without the receivables decline 7.1 — each against roughly $1.64 billion of market value.
- M&A check: there is no tender offer, no take-private and no merger agreement on DXC. Between the annual report of May 8, 2026 and the data cut-off of July 27, 2026, the SEC record contains the investor day (8-K of June 11, 2026, Item 7.01), the DEF 14A of June 4, 2026, the voting results (8-K of July 22, 2026, Item 5.07), two ownership filings (SCHEDULE 13G of June 24, 2026 and 13G/A of July 14, 2026) and insider reports. The risk factor about possible negotiations over acquisitions, divestitures or spin-offs is boilerplate and names no transaction.
- Do not confuse DXC Technology Company (DXC, CIK 1688568) with DexCom, Inc. (DXCM), a maker of glucose monitoring systems. Former name of the same CIK per SEC records: Everett SpinCo, Inc. (until March 31, 2017) — the spin-off shell Hewlett Packard Enterprise used before the merger with CSC.
- Price figures are dated valuation anchors, not buy arguments: closing price $10.05 on July 24, 2026, 52-week high $15.43 (December 19, 2025), 52-week low $8.22 (May 13, 2026). Market value cross-check: 163,479,858 shares (10-K cover page, as of May 1, 2026) times $10.05 equals $1.643 billion — consistent with the fundamental data. The most recent periodic report is the annual report 10-K for March 31, 2026; no newer 10-Q existed on July 27, 2026.
Frequently Asked Questions
Because a market value of roughly $1.64 billion is small relative to the cash flow. DXC generated $1,248 million of operating cash flow in fiscal 2026. The scanner filters every stock with positive free cash flow and a ratio of at most 10, then sorts ascending. On July 27, 2026 that placed DXC 23rd out of 544 U.S. hits, with the 25 strongest shown.
It depends on the definition. DXC itself deducts $535 million of capital expenditures from $1,248 million of operating cash flow and reports $713 million for fiscal 2026. Deduct only the $212 million for property and equipment and you get $1,036 million. Deduct another $188 million of lease payments and $525 million remains; strip out the one-off $294 million from the receivables decline and $231 million is left.
Because the effective tax rate was 91.2 percent in fiscal 2026. Of $318 million of pre-tax income, $290 million went to tax authorities, leaving $18 million for common stockholders, or $0.10 per diluted share. Behind it sits a valuation allowance of roughly $2.4 billion against deferred tax assets. On an adjusted basis DXC reports $3.23 per share, which is a ratio of roughly 3.
No. Between the annual report of May 8, 2026 and July 27, 2026, the SEC record contains only the investor day of June 11, 2026, the proxy statement, the voting results of July 22, 2026, two ownership filings and insider reports. There is no tender offer and no merger agreement. The boilerplate risk factor about possible negotiations names no specific transaction.
A contract under which DXC sells receivables to banks. The maximum amount is $400 million. As of March 31, 2026, $367 million had been sold and derecognized from the balance sheet, which brings the cash forward. The annual report gives July 24, 2026 as the termination date. Whether the contract was renewed does not appear in the SEC record through July 27, 2026; the next quarterly report is scheduled for July 30, 2026.
On March 31. Fiscal 2026 ran from April 1, 2025 to March 31, 2026 and therefore largely covers calendar 2025. Anyone comparing DXC with peers that report on calendar years shifts the figures by one quarter. Every figure in this analysis therefore names the fiscal year and the reporting date explicitly.
The current report gives no reasoning, only the result: 67,900,669 votes against the 20 million share increase and 49,829,849 in favor. The proxy statement had itself put those 20 million at 12.1 percent of outstanding shares. In the same vote, executive compensation received only 50.03 percent approval — both point to dissatisfaction among large holders.
No. The board suspended the dividend beginning in the first quarter of fiscal 2021 to preserve cash. The fiscal 2026 annual report states explicitly that reinstatement is not intended. Capital goes into buybacks instead: $250 million in fiscal 2026 at an average of $14.11 per share, with $342 million still authorized.
Found an error?
Did you spot a factual error, an outdated number, or a typo in this deep dive? Let us know briefly — your report goes straight to the editorial team.