The Warning Signs Before Bankruptcy — 792 U.S. Cases Since 2005
We examined every mandatory filing by listed U.S. companies since 2005 to find out which warning sign was visible, and how long before the bankruptcy petition. The basis: 792 cases measured against 973,326 company-months from 11,310 companies, using nothing but public regulatory data. The result cuts both ways. The signals are early and measurable — typically more than a year ahead. And every single one of them is wrong in more than 95 out of 100 cases.
 Thomas Mücke
Founder & Publisher
Thomas Mücke
Founder & Publisher
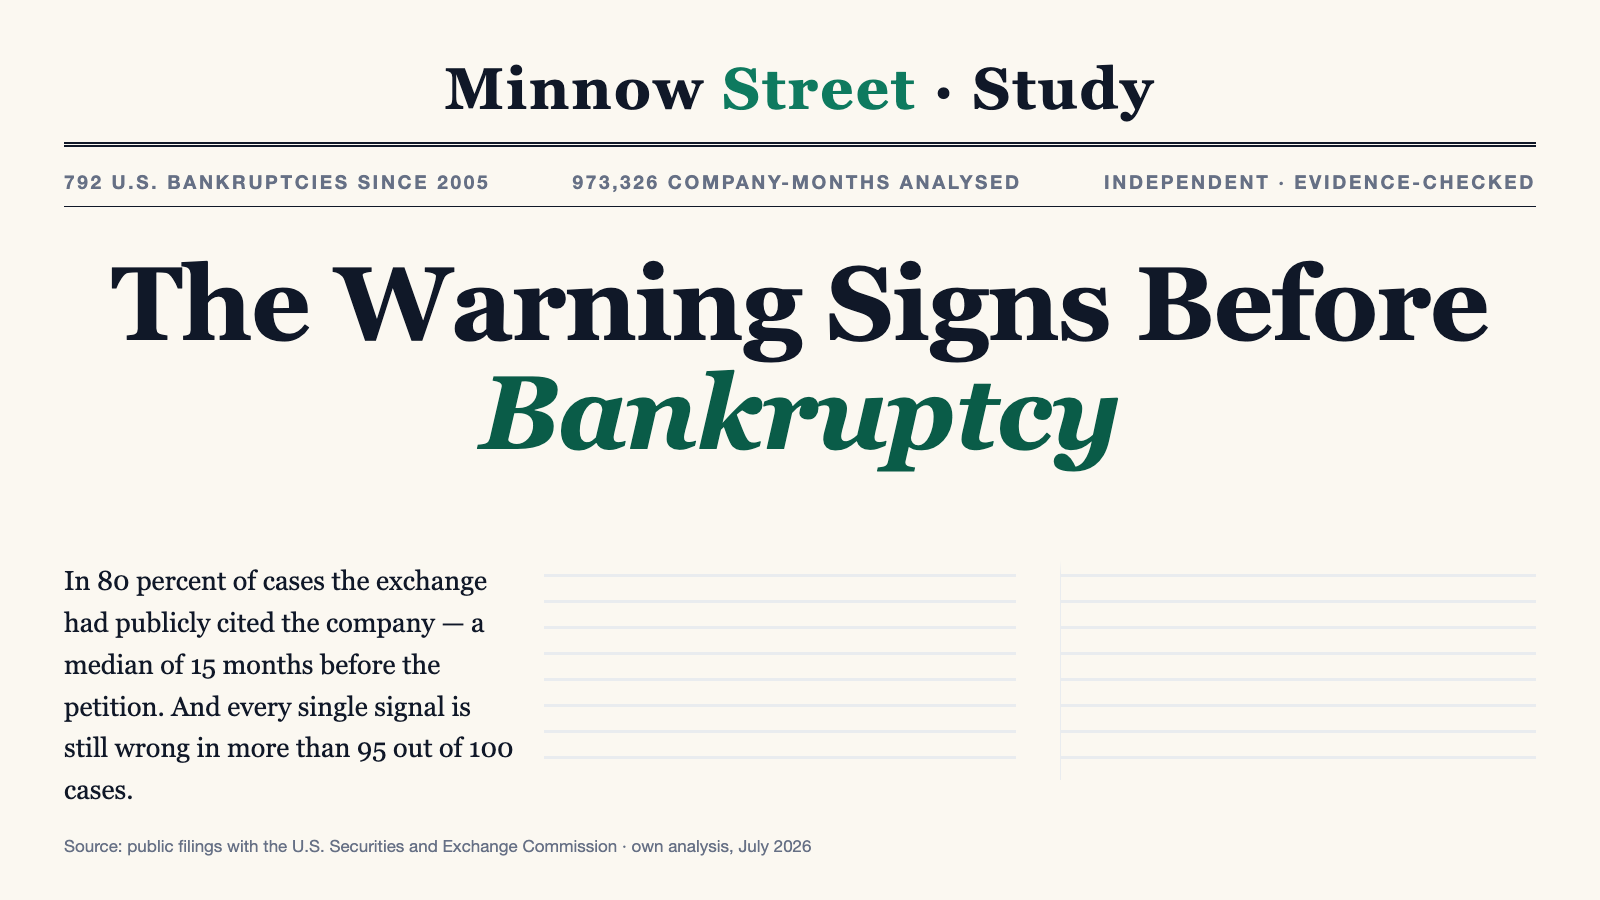
When a U.S. company files for bankruptcy, it is almost never a surprise. In 80 percent of cases the exchange had publicly cited the company for failing to meet continued listing standards — a median of 15 months before the petition. In two thirds of cases the company itself had already filed notice that its financial report would be late. And in 54 percent of cases the balance sheet had been in the distress zone for more than three years.
We examined every mandatory filing by listed U.S. companies since 2005 to establish which warning sign was visible, and when. The basis is public data from the U.S. Securities and Exchange Commission alone: 792 bankruptcies of operating companies listed on the NYSE or Nasdaq, measured against a population of 11,310 companies and 973,326 company-months.
The result cuts both ways. The signals are early and they are measurable. But even the sharpest single signal is wrong in 95 out of 100 cases: of all companies cited by their exchange, 96.4 percent are still around twelve months later. Anyone hoping to turn this into a trading strategy runs into a third finding, one rarely stated in the literature — more on that at the end.
What was measured
The study rests on three sources, all public, all held by the SEC:
- Every mandatory filing since 1994. From the full filing record (983,737 company files), current reports (Form 8-K) were evaluated by their official item numbers — item 1.03 for bankruptcy, 3.01 for the exchange notice, 4.01 for a change of auditor, 4.02 for the declaration that previously issued figures can no longer be relied upon.
- Every balance sheet since 2009. From 68 quarterly datasets, 61,313 financial statements were computed into an Altman Z'' score and six further ratios.
- Every audit opinion from 2001 to 2026. From 50,212 annual reports, we extracted whether the auditor had flagged substantial doubt about the company's ability to continue as a going concern.
That last signal was found through the standard wording U.S. auditing standards prescribe:
"substantial doubt about the entity's ability to continue as a going concern"
— wording under U.S. auditing standard AS 2415 and ASC 205-40, as it appears in the audit report of the annual filing (Form 10-K).
The exchange notice is equally unambiguous. It carries its own official item number, which the SEC defines in Form 8-K as:
"Item 3.01 — Notice of Delisting or Failure to Satisfy a Continued Listing Rule or Standard; Transfer of Listing"
— official designation in SEC Form 8-K.
Two methodological decisions shape everything that follows. First: every signal is dated to the day it was filed, never to the balance sheet date. Assigning a ratio to quarter-end when the report only appears ten weeks later measures knowledge nobody had at the time. Second: every official item number was verified against the original document. That proved necessary — only 42 percent of filings carrying the bankruptcy item are in fact a petition by the company itself. The rest concern subsidiaries, confirm a plan already under way, or are simply mis-tagged.
How early the signals were visible
The table below shows, for each signal, in how many of the 792 cases it appeared at all, and how many months before the petition it was first visible.
| Signal | appeared in | lead time (median) |
|---|---|---|
| Exchange notice — continued listing standard missed | 80.3% | 15.2 months |
| Capital raised in the market | 73.9% | 47.4 months |
| Going-concern doubt in the audit opinion | 65.4% | 20.1 months |
| Late filing notified | 64.4% | 26.5 months |
| Material contract terminated | 61.0% | 31.0 months |
| Altman Z'' in the distress zone | 54.3% | 38.1 months |
| Change of auditor | 41.9% | 29.4 months |
| Credit facility accelerated | 31.9% | 4.7 months |
| Late filing never made good | 29.7% | 10.1 months |
The spread is the real finding. At one end sits the Altman score: it warns a median of more than three years ahead — so early that the warning is useless on its own, because anything can happen in three years. At the other end sits the accelerated credit facility at 4.7 months. That is not an early warning at all.
The useful window lies in between. The exchange notice at 15 months and the going-concern opinion at 20 months are early enough to act on and late enough to be concrete.
How often the signals are wrong
Lead time is only half the story. It says how often a company that did go bankrupt had shown the signal beforehand. The question that matters to an investor is the reverse: of all companies showing this signal, how many actually fail?
The base rate is 0.90 percent — that share of the companies observed files for bankruptcy within twelve months. Against that yardstick, the single signals look like this:
| Signal | bankruptcy within 12 months | warning power |
|---|---|---|
| Credit facility accelerated | 4.61% | 5.1× |
| Exchange notice | 3.60% | 4.0× |
| Late filing never made good | 2.87% | 3.2× |
| Write-down announced | 2.49% | 2.8× |
| Going-concern doubt | 2.22% | 2.5× |
| Altman Z'' in the distress zone | 2.12% | 2.4× |
| Change of auditor | 1.40% | 1.6× |
This is the uncomfortable number in this study: even the best single signal is wrong in more than 95 out of 100 cases. Reading an accelerated credit facility as an announcement of bankruptcy means being wrong 95.4 percent of the time. That does not devalue the signal — a fivefold increase in probability is a great deal — but it rules out any judgement about an individual company.
What matters is what appears together
Single signals are blunt. It gets interesting when several are active at once:
| signals active at once | company-months | bankruptcy within 12 months |
|---|---|---|
| none | 361,730 | 0.18% |
| one | 201,359 | 0.43% |
| two | 134,247 | 0.86% |
| three | 88,492 | 1.47% |
| four | 64,430 | 1.92% |
| five | 45,086 | 2.48% |
| six or more | 77,982 | 3.16% |
From 0.18 to 3.16 percent — a factor of 18, and the series rises without a single exception. The sharpest three-signal combinations reach almost 20 percent bankruptcy within twelve months, or 22 times the base rate: an announced write-down, plus interest not covered by earnings, plus cash lasting less than four quarters. Level with it: a late filing never made good, plus a going-concern opinion, plus restructuring charges.
Even here, four out of five of those companies survive the year.
The Altman score is an all-clear, not an alarm
The Altman Z-score is the best-known bankruptcy metric in the world. As an alarm it performs modestly here: 2.4 times the base rate, far weaker than an exchange notice. Its strength lies elsewhere.
Take only companies without any filing signal — the unremarkable majority — and split them by their Altman score:
- Altman above 2.6: 0.09 percent bankruptcy within twelve months
- Altman below 1.1: 1.01 percent
A factor of eleven inside the same quiet group. The Altman score is therefore less useful for flagging danger than for granting an all-clear — which is practically valuable, because it clears the field for the cases that genuinely need attention.
Two limits are documented. First, share buybacks blind the score. Bed Bath & Beyond reported an Altman Z'' of 6.01 one year before bankruptcy — arithmetically healthy. The reason: 9.7 billion dollars of accumulated retained earnings against a balance sheet total of 5.1 billion, while real equity had shrunk to 174 million. Second, a third of all balance sheets cannot be computed at all for lack of a usable breakdown; Hertz, for instance, never produced a value.
What the signals were worth in the market
Early warning is one thing, share price another. For the 86 triggers of the two sharpest three-signal combinations we recomputed prices day by day — including long-delisted stocks, past the end of their exchange listing.
The median price path after the signal: −23.9 percent after three months, −31.5 after six, −48.2 percent after twelve. The broad market gained 17.1 percent over the same spans. Seventy percent of the stocks were down after a year, and almost half had lost more than half their value.
And yet: 19 percent stood more than 50 percent higher a year later. That minority decides everything that follows.
The number such studies usually leave out
A hit rate without a control group is worthless. Cheap, thinly traded stocks that have already fallen lose 30 percent all the time, with or without a filing. So for every position we built a matched twin: a company-month with no signal at all, from the same year, the same price bracket, the same trading volume and the same distance from its 52-week high.
The base rate of those twins: 9.8 percent reach a 30 percent decline within three months. It swings hard — 38 percent in 2008, just 2 percent in 2013 — and it depends on price level: stocks between one and two dollars manage it 20.1 percent of the time, stocks above 20 dollars 8.0 percent.
Measured against that yardstick, the signals hold up. The best two-signal combinations reach the target in 31 to 47 percent of cases — three to four times their twins. And it is not a fluke: of the ten combinations that led in the first half of the period up to 2015, all ten kept their edge from 2016 onwards.
Why this still does not scale
Take all 32 statistically viable combinations together and you get around 500 opportunities a year. That is exactly when the edge disappears: the hit rate drops from 47 to 30 percent, and after borrowing costs each position is down 10.2 percent. More opportunities mean worse opportunities here, because the volume comes from the weaker combinations.
The second reason is the distribution. The typical case wins — the median runs from plus 11 to plus 30 percent depending on the combination. The mean sits below that or in the red, because individual rebounds cost a multiple of a normal gain. The worst single position in our analysis moved 1,513 percent against the trade.
Keep the thing small and the picture changes. Three to nine opportunities a year, each position limited to a fixed share of the portfolio, plus a stop — and the result turns positive. About that stop, the data says something precise that contradicts the usual advice:
- It works. The worst single case improves from −352 to −62 percent.
- It is not honoured. Aiming to exit at a 25 percent adverse move means exiting, in the worst case, at 62 to 104 percent. These stocks jump over the level instead of touching it.
- It costs return where nothing exploded. A third of positions are stopped out, many of which would later have reached the target anyway. The hit rate falls from 68 to 57 percent as a result.
That is the practical yield of this analysis: the signals are good. What becomes of them is decided by the process around them — the number of positions, the size of each, and how the outliers are handled.
The four balance-sheet warning signals from this study now run as a scanner of their own: Bankruptcy Study: Stacked Warning Signals lists U.S.-listed companies where at least three of the four are burning at once. It counts signals rather than demanding one fixed combination — exactly what the analysis argues for.
Limits of this study
The analysis rests on filing data, not on bankruptcy court records. It therefore captures companies that met their reporting obligations to the end better than those that dropped out of reporting first. Proof of an exchange listing is only cleanly available from around 2005; for older cases such as Enron or WorldCom, listing is carried as an attribute rather than an exclusion criterion.
The price calculations include no stock-specific borrowing fees, no check on borrow availability, no trading costs and no slippage. Targets and stops are evaluated on closing prices. The observations overlap — same company, same crisis, same market phase — which is why we deliberately do not present significance statistics as proof, but rather consistency across twenty-one years and the re-check in the second half of the period.
And the most important caveat: every result here is an average over hundreds of cases. About the individual company triggering a signal today, they say nothing. A smoke detector is not a demolition order.
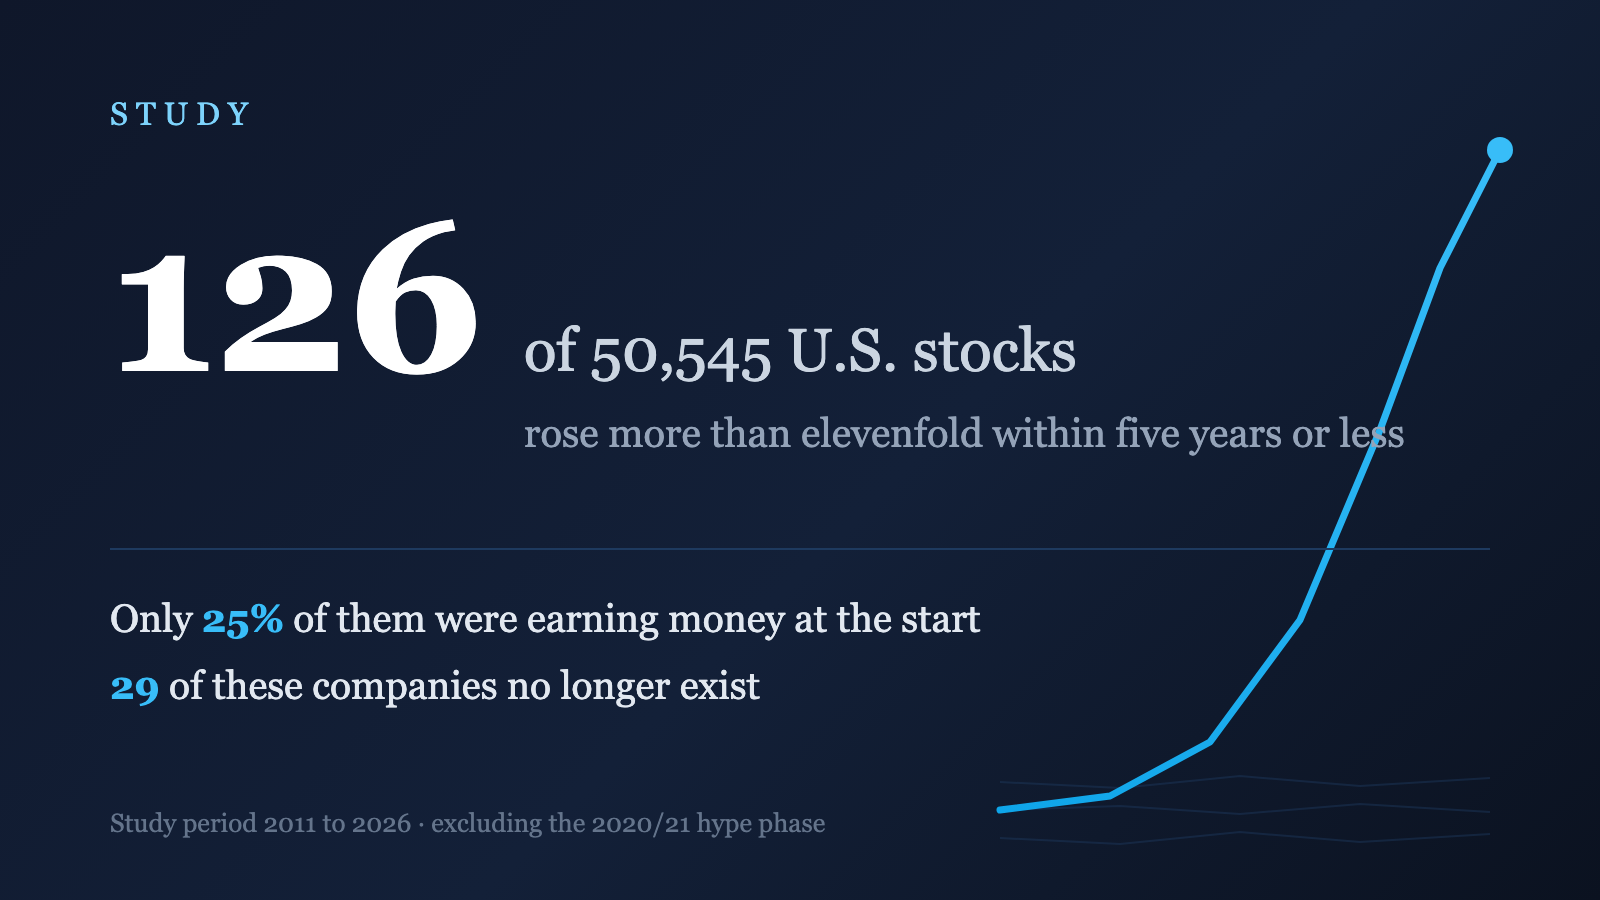
This is the second in our series of studies covering entire stock universes. The first measured the opposite direction: 126 U.S. stocks that rose more than elevenfold within five years — and what they had in common beforehand. Both studies, and everything that follows, live in the Studies section.
This article is a historical analysis and not investment advice. It contains no buy or sell recommendation, no forecast, and no statement about any individual company listed today. Anyone making investment decisions should assess their own situation and risks — if in doubt, with professional advice.
Frequently Asked Questions
792 bankruptcies of listed, operating U.S. companies since 2005, measured against a population of 11,310 companies and 973,326 company-months. Banks, funds and shell companies are excluded. The data comes exclusively from public filings with the U.S. Securities and Exchange Commission.
The Altman Z-score entering the distress zone, a median 38.1 months before the petition; it appeared in 54.3% of cases. The latest signal is an accelerated credit facility at 4.7 months. That is no longer an early warning — it is the beginning of the end.
Not reliable enough to judge an individual company. The base rate is 0.90% bankruptcy within twelve months; the sharpest single signal lifts it to 4.61%. That is a fivefold increase — and it also means that more than 95 in 100 companies flagged survive the year.
As an alarm it is mediocre, with 2.4 times the base rate. As an all-clear it is strong: among companies with no filing signal at all, those with a score above 2.6 default at 0.09% while those below 1.1 default at 1.01% — a factor of eleven inside the same unremarkable group.
Not as a mass strategy. Trading every viable combination produces around 500 opportunities a year but destroys the edge: the hit rate falls from 47% to 30%, and after borrowing costs each position loses 10.2%. A small number of strictly selected positions with limited size does end up positive.
Because cheap, thinly traded stocks that have already fallen lose 30% all the time. Without a control group you measure that background noise instead of the signal. The base rate for such matched stocks is 9.8% per three months, ranging from 2% in 2013 to 38% in 2008.
The auditor states in the audit report that there is substantial doubt about the company's ability to continue operating. The signal appeared in 65.4% of bankruptcy cases, a median 20.1 months beforehand, and raises the probability of bankruptcy to 2.5 times the base rate.